| Param | Original file | Final file |
|---|---|---|
| Filename | modeM0/AS1A02_132T01_9000001212_08729cztM0_level2.evt | modeM0/AS1A02_132T01_9000001212_08729cztM0_level2_quad_clean.evt |
| Size (bytes) | 125,830,080 | 35,974,080 |
| Size | 120.0 MB | 34.3 MB |
| Events in quadrant A | 931,940 | 236,042 |
| Events in quadrant B | 924,124 | 246,567 |
| Events in quadrant C | 931,271 | 241,722 |
| Events in quadrant D | 896,118 | 230,788 |
| Mode M0 | |||
|---|---|---|---|
| Quadrant | BADHDUFLAG | Total packets | Discarded packets |
| A | 0 | 3895 | 1 |
| B | 0 | 3856 | 1 |
| C | 0 | 3856 | 1 |
| D | 0 | 3876 | 1 |
| Mode M9 | |||
|---|---|---|---|
| Quadrant | BADHDUFLAG | Total packets | Discarded packets |
| A | 0 | 6 | 0 |
| B | 0 | 6 | 0 |
| C | 0 | 6 | 0 |
| D | 0 | 7 | 0 |
| Mode SS | |||
|---|---|---|---|
| Quadrant | BADHDUFLAG | Total packets | Discarded packets |
| A | 0 | 36 | 0 |
| B | 0 | 36 | 0 |
| C | 0 | 36 | 0 |
| D | 0 | 36 | 0 |
| Quadrant | Total seconds | Saturated seconds | Saturation percentage |
|---|---|---|---|
| A | 1834 | 8 | 0.436205% |
| B | 1834 | 5 | 0.272628% |
| C | 1834 | 9 | 0.490731% |
| D | 1834 | 1 | 0.054526% |
Noise dominated data is calculated using 1-second bins in cleaned event files. If a bin has >2000 counts, and if more than 50% of those come from <1% of pixels, then it is considered to be noise-dominated and hence unusable.
| Quadrant | # 1 sec bins | Bins with >0 counts | Bins with >2000 counts | High rate bins dominated by noise | Noise dominated (total time) | Noise dominated (detector-on time) | Marked lightcurve |
|---|---|---|---|---|---|---|---|
| A | 1834 | 1834 | 2 | 2 | 0.11% | 0.11% | 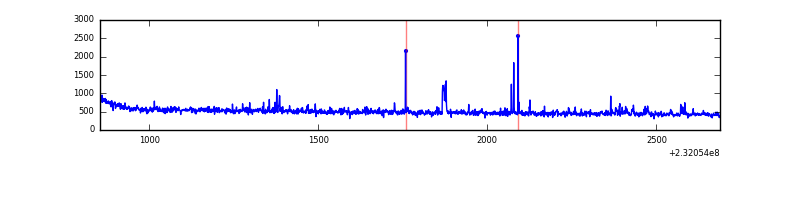 |
| B | 1834 | 1834 | 0 | 0 | 0.00% | 0.00% | 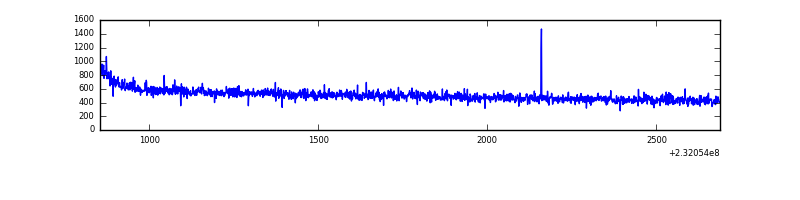 |
| C | 1834 | 1834 | 5 | 5 | 0.27% | 0.27% |  |
| D | 1834 | 1834 | 0 | 0 | 0.00% | 0.00% | 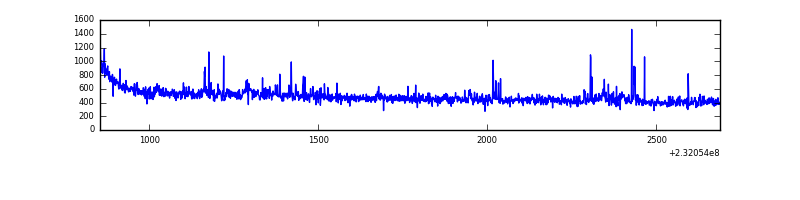 |
Top three noisy pixels from each quadrant. If the there are fewer than three noisy pixels in the level2.evt file, extra rows are filled as -1
| Pixel properties | Quadrant properties | ||||||
|---|---|---|---|---|---|---|---|
| Quadrant | DetID | PixID | Counts | Sigma | Mean | Median | Sigma |
| A | 13 | 251 | 26577 | 550.97 | 229 | 225 | 47.8 |
| A | 5 | 16 | 21473 | 444.26 | 229 | 225 | 47.8 |
| A | 2 | 79 | 2576 | 49.16 | 229 | 225 | 47.8 |
| B | 12 | 111 | 4692 | 95.98 | 236 | 231 | 46.5 |
| B | 11 | 111 | 3917 | 79.31 | 236 | 231 | 46.5 |
| B | 4 | 80 | 3083 | 61.36 | 236 | 231 | 46.5 |
| C | 14 | 234 | 21902 | 389.24 | 231 | 232 | 55.7 |
| C | 14 | 67 | 5818 | 100.34 | 231 | 232 | 55.7 |
| C | 13 | 61 | 1653 | 25.52 | 231 | 232 | 55.7 |
| D | 1 | 52 | 16570 | 278.1 | 224 | 219 | 58.8 |
| D | 2 | 14 | 10546 | 175.64 | 224 | 219 | 58.8 |
| D | 2 | 152 | 8218 | 136.05 | 224 | 219 | 58.8 |
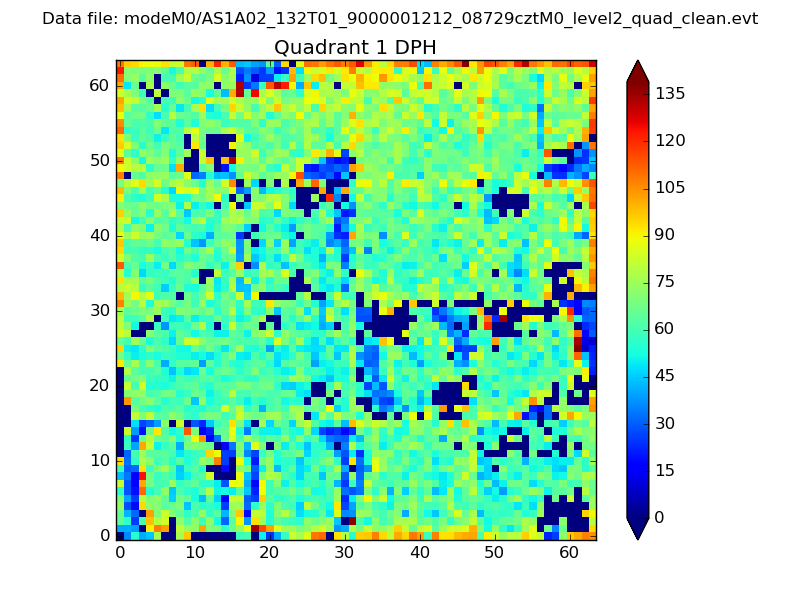
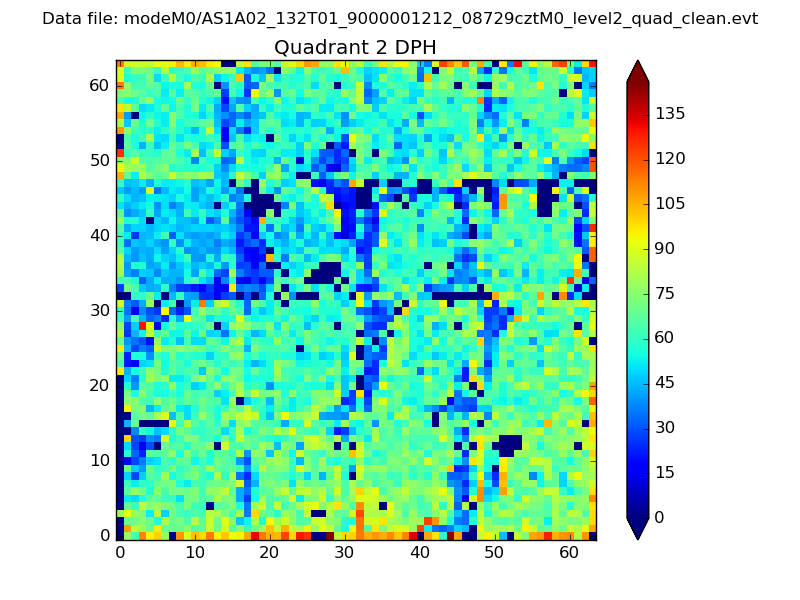
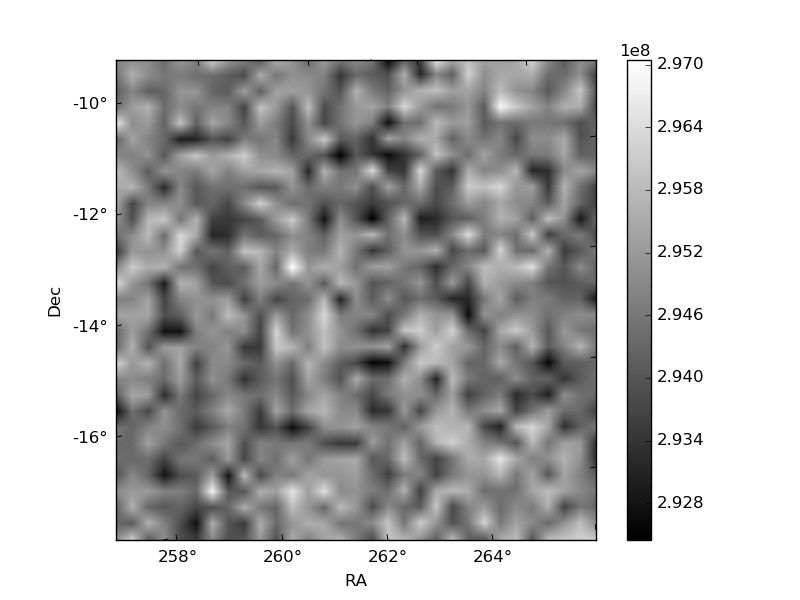
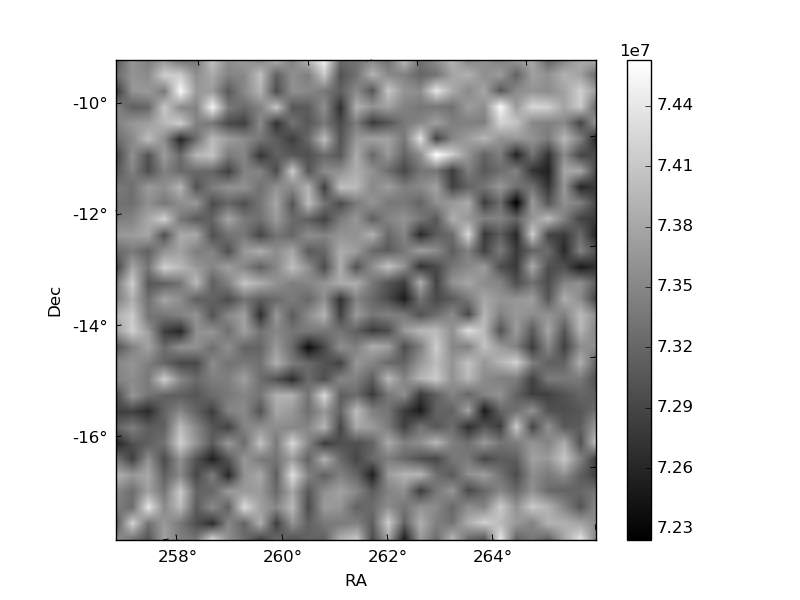
Histogram calculated using DETX and DETY for each event in the final _common_clean file
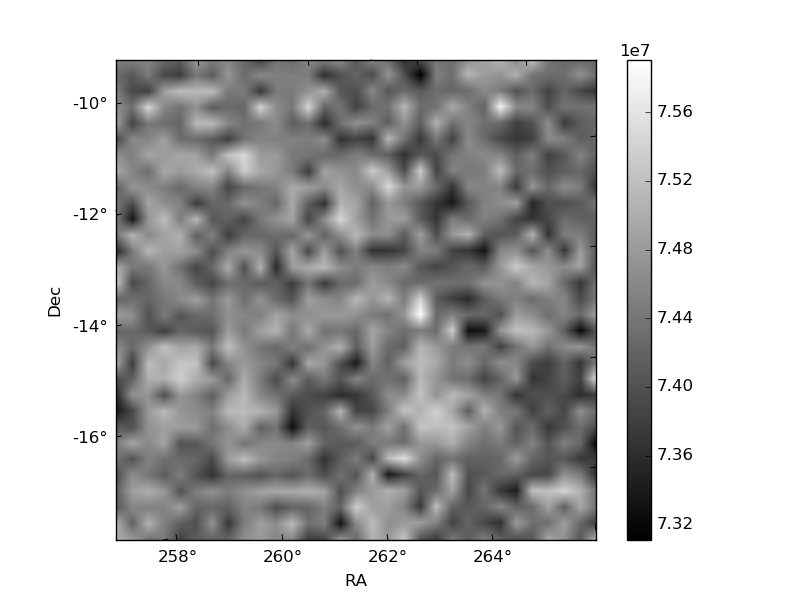
| Quadrant A | 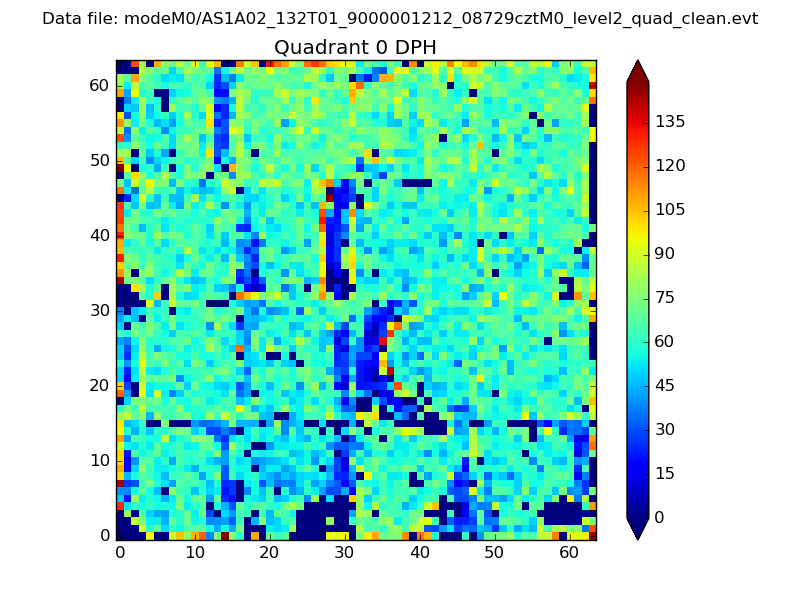 |
 |
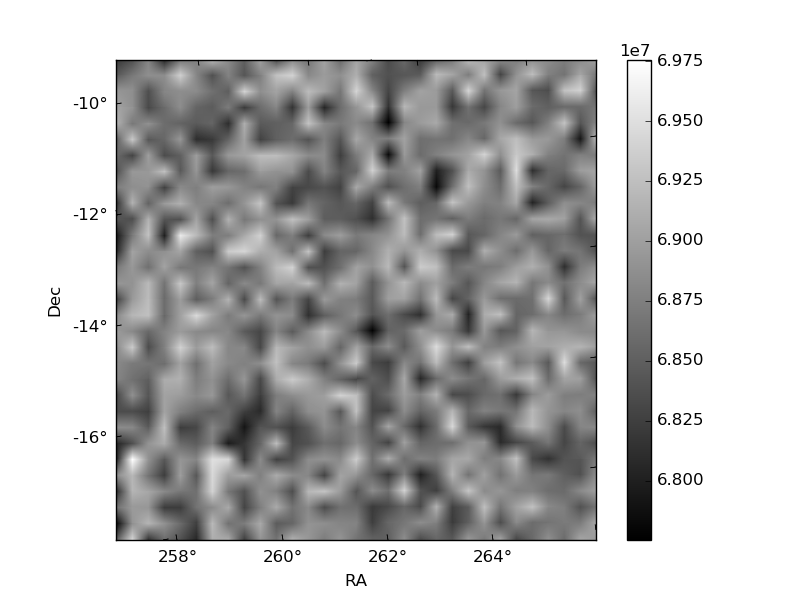
Quadrant B |
|---|---|---|---|
| Quadrant D | 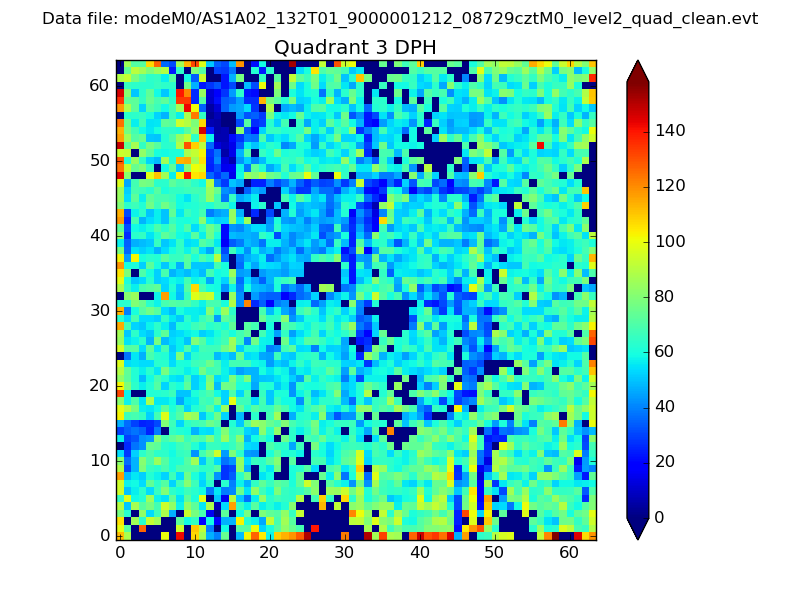 |
 |
Quadrant C |
| Plot type | Count rate plots | Images |
|---|---|---|
| Comparison with Poisson distribution Blue bars denote a histogram of data divided into 1 sec bins. Red curve is a Poisson curve with rate = median count rate of data. |
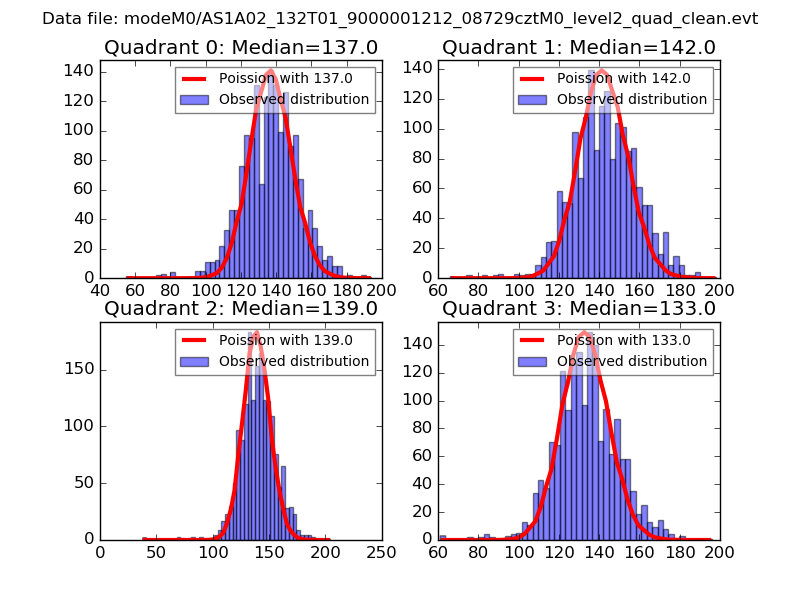 |
 |
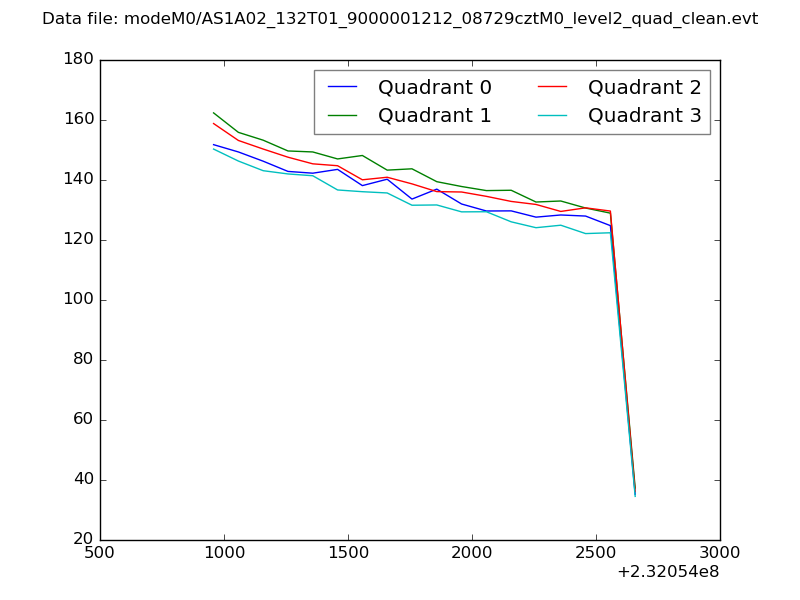
| Quadrant-wise count rates Data is divided into 100 sec bins |
 |
|
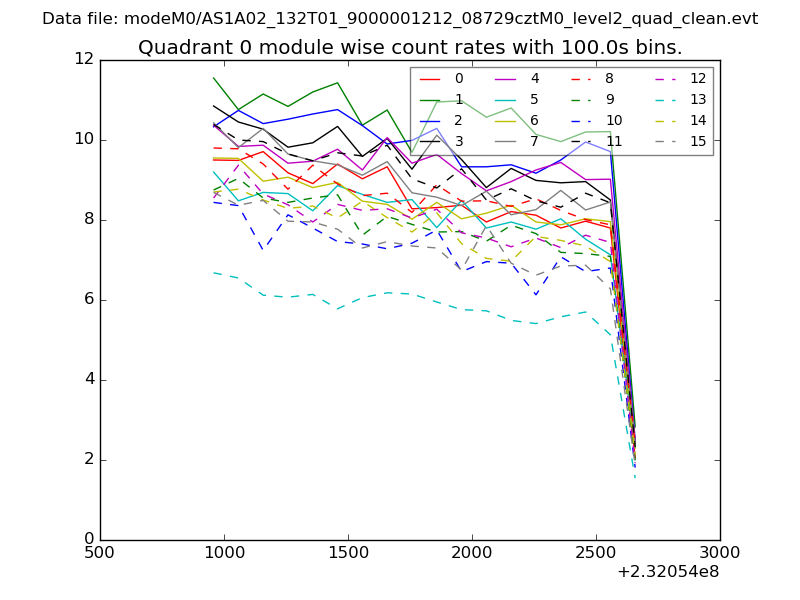
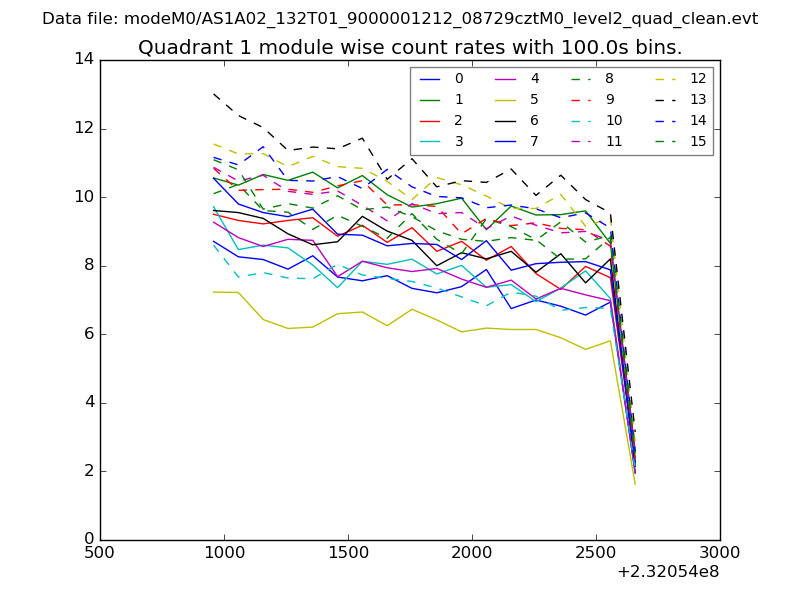
| Module-wise count rates for Quadrant A Data is divided into 100 sec bins |
 |
 |
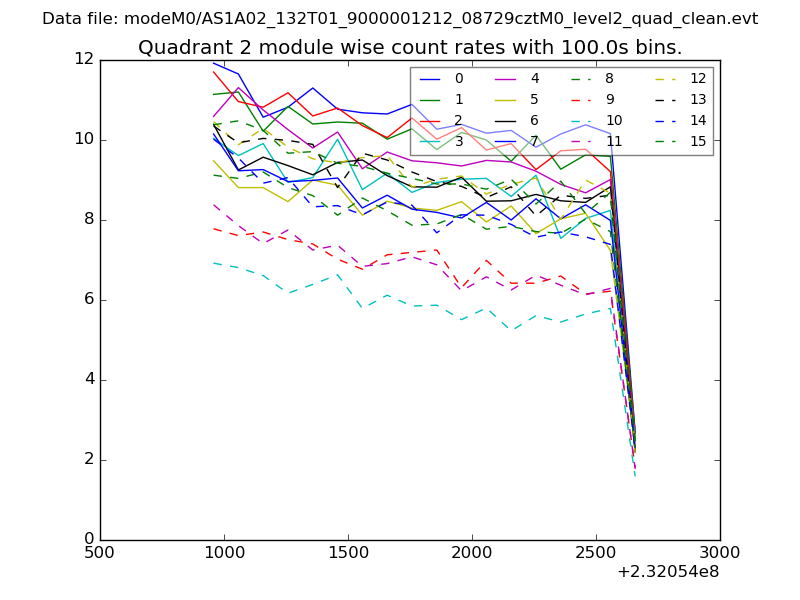
| Module-wise count rates for Quadrant B Data is divided into 100 sec bins |
 |
 |
| Module-wise count rates for Quadrant C Data is divided into 100 sec bins |
 |
 |
| Module-wise count rates for Quadrant D Data is divided into 100 sec bins |
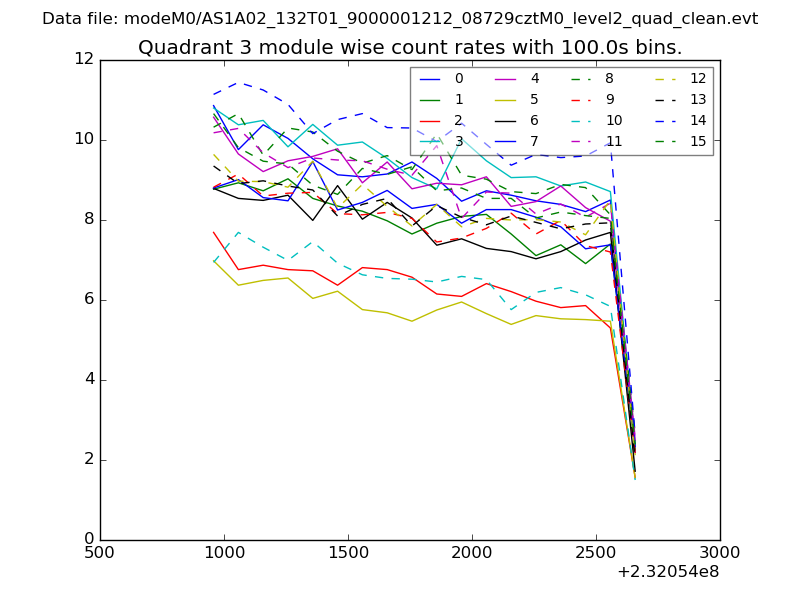 |
 |
| Parameter | Plot |
|---|---|
| CZT HV Monitor | 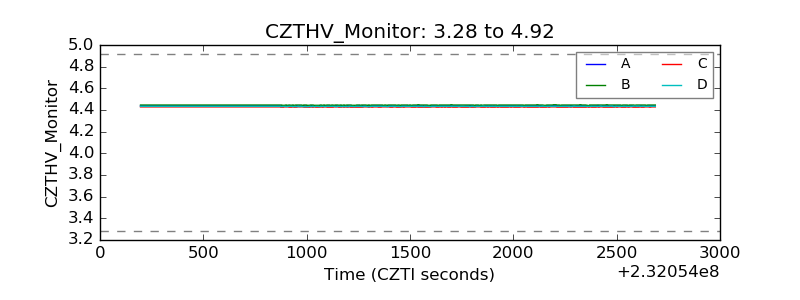 |
| D_VDD | 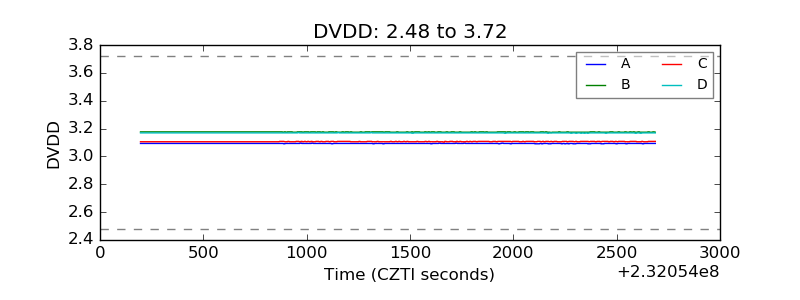 |
| Temperature 1 | 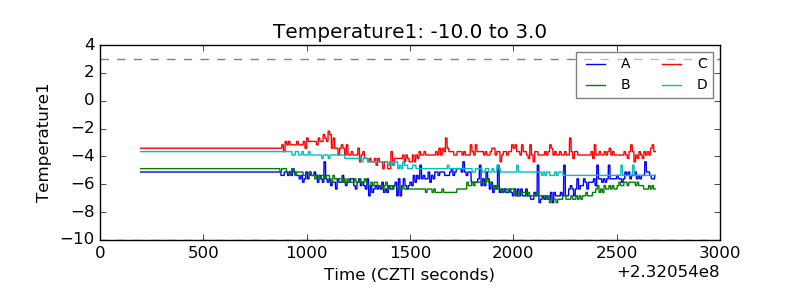 |
| Veto HV Monitor |  |
| Veto LLD | 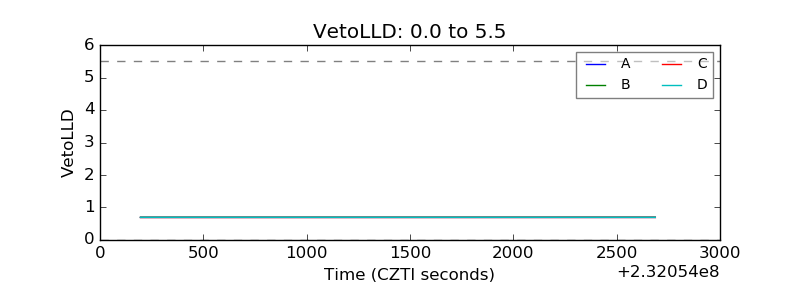 |
| Alpha Counter | 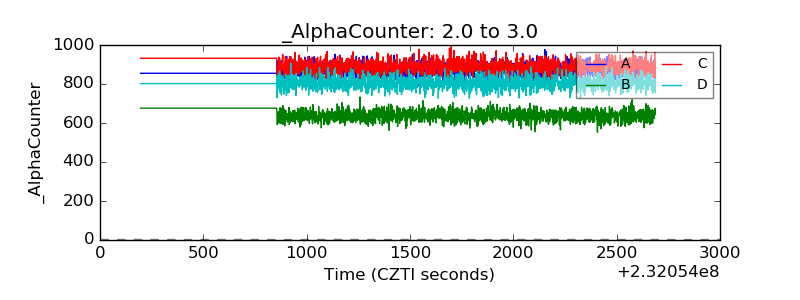 |
| _CPM_Rate | 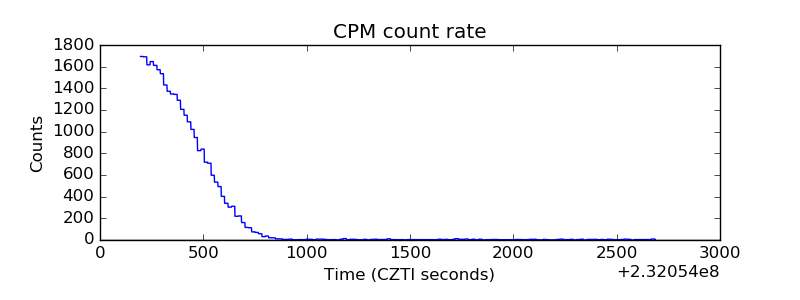 |
| CZT Counter | 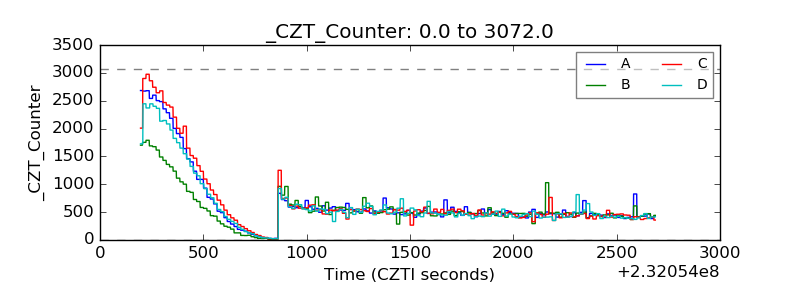 |
| +2.5 Volts monitor |  |
| +5 Volts monitor | 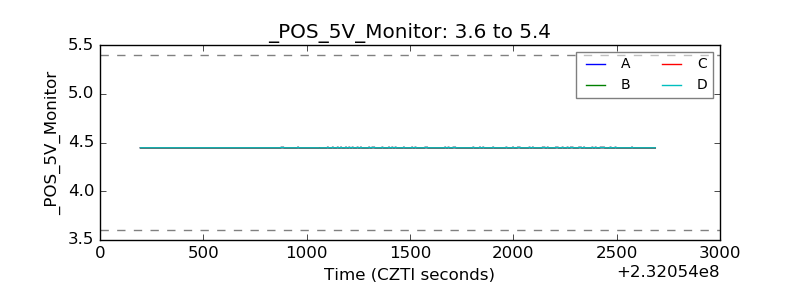 |
| _ROLL_ROT | 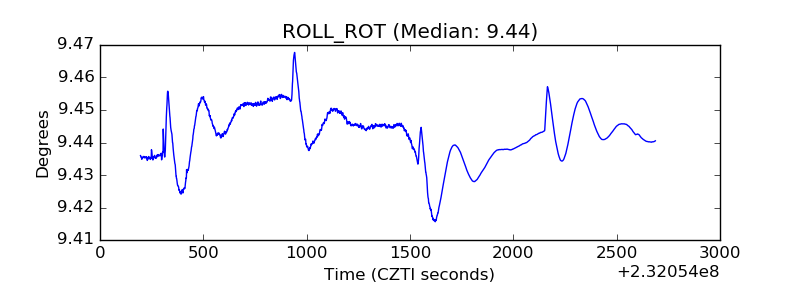 |
| _Roll_DEC | 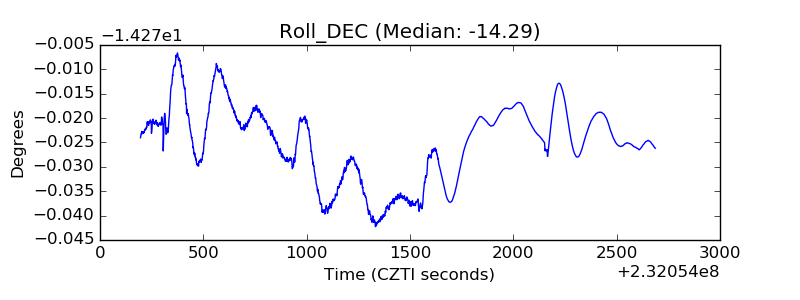 |
| _Roll_RA | 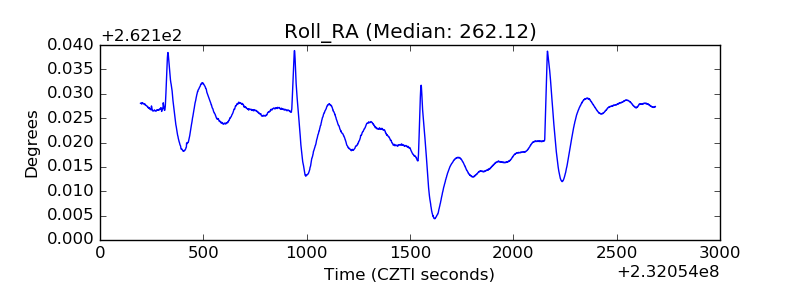 |
| Veto Counter | 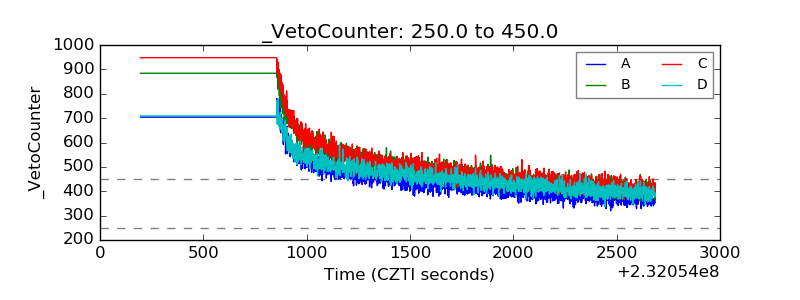 |