| Param | Original file | Final file |
|---|---|---|
| Filename | modeM0/AS1G07_027T01_9000001210cztM0_level2.fits | modeM0/AS1G07_027T01_9000001210cztM0_level2_quad_clean.evt |
| Size (bytes) | 193,377,600 | 190,134,720 |
| Size | 184.4 MB | 181.3 MB |
| Events in quadrant A | 1,173,752 | 1,146,689 |
| Events in quadrant B | 1,133,884 | 1,134,368 |
| Events in quadrant C | 1,177,044 | 1,098,871 |
| Events in quadrant D | 1,006,932 | 1,012,978 |
| Mode SS | |||
|---|---|---|---|
| Quadrant | BADHDUFLAG | Total packets | Discarded packets |
| A | 0 | 402 | 0 |
| B | 0 | 402 | 0 |
| C | 0 | 402 | 0 |
| D | 0 | 402 | 0 |
| Mode M9 | |||
|---|---|---|---|
| Quadrant | BADHDUFLAG | Total packets | Discarded packets |
| A | 0 | 42 | 0 |
| B | 0 | 42 | 0 |
| C | 0 | 42 | 0 |
| D | 0 | 42 | 0 |
| Mode M0 | |||
|---|---|---|---|
| Quadrant | BADHDUFLAG | Total packets | Discarded packets |
| A | 0 | 41785 | 0 |
| B | 0 | 41283 | 0 |
| C | 0 | 40984 | 0 |
| D | 0 | 44934 | 0 |
| Quadrant | Total seconds | Saturated seconds | Saturation percentage |
|---|---|---|---|
| A | 19827 | 280 | 1.412216% |
| B | 19827 | 249 | 1.255863% |
| C | 19827 | 213 | 1.074293% |
| D | 19825 | 514 | 2.592686% |
Noise dominated data is calculated using 1-second bins in cleaned event files. If a bin has >2000 counts, and if more than 50% of those come from <1% of pixels, then it is considered to be noise-dominated and hence unusable.
| Quadrant | # 1 sec bins | Bins with >0 counts | Bins with >2000 counts | High rate bins dominated by noise | Noise dominated (total time) | Noise dominated (detector-on time) | Marked lightcurve |
|---|---|---|---|---|---|---|---|
| A | 23902 | 19823 | 0 | 0 | 0.00% | 0.00% |  |
| B | 23902 | 19823 | 0 | 0 | 0.00% | 0.00% |  |
| C | 23902 | 19823 | 0 | 0 | 0.00% | 0.00% |  |
| D | 23902 | 19766 | 0 | 0 | 0.00% | 0.00% |  |
Top three noisy pixels from each quadrant. If the there are fewer than three noisy pixels in the level2.evt file, extra rows are filled as -1
| Pixel properties | Quadrant properties | ||||||
|---|---|---|---|---|---|---|---|
| Quadrant | DetID | PixID | Counts | Sigma | Mean | Median | Sigma |
| A | 0 | 29 | 1156 | 11.17 | 305 | 286 | 77.9 |
| A | 7 | 110 | 1002 | 9.19 | 305 | 286 | 77.9 |
| A | 0 | 30 | 922 | 8.17 | 305 | 286 | 77.9 |
| B | 2 | 9 | 981 | 11.52 | 299 | 285 | 60.4 |
| B | 3 | 17 | 758 | 7.83 | 299 | 285 | 60.4 |
| B | 14 | 254 | 755 | 7.78 | 299 | 285 | 60.4 |
| C | 1 | 80 | 858 | 6.81 | 310 | 289 | 83.5 |
| C | 1 | 81 | 843 | 6.63 | 310 | 289 | 83.5 |
| C | 12 | 241 | 802 | 6.14 | 310 | 289 | 83.5 |
| D | 3 | 14 | 758 | 6.39 | 286 | 261 | 77.7 |
| D | 10 | 189 | 749 | 6.28 | 286 | 261 | 77.7 |
| D | 6 | 231 | 734 | 6.08 | 286 | 261 | 77.7 |
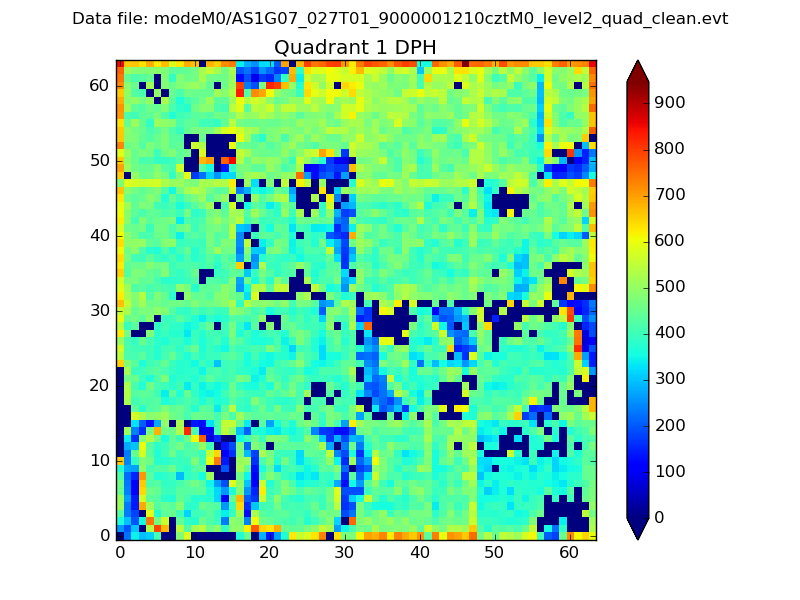
Histogram calculated using DETX and DETY for each event in the final _common_clean file
| Quadrant A |  |
 |
Quadrant B |
|---|---|---|---|
| Quadrant D |  |
 |
Quadrant C |
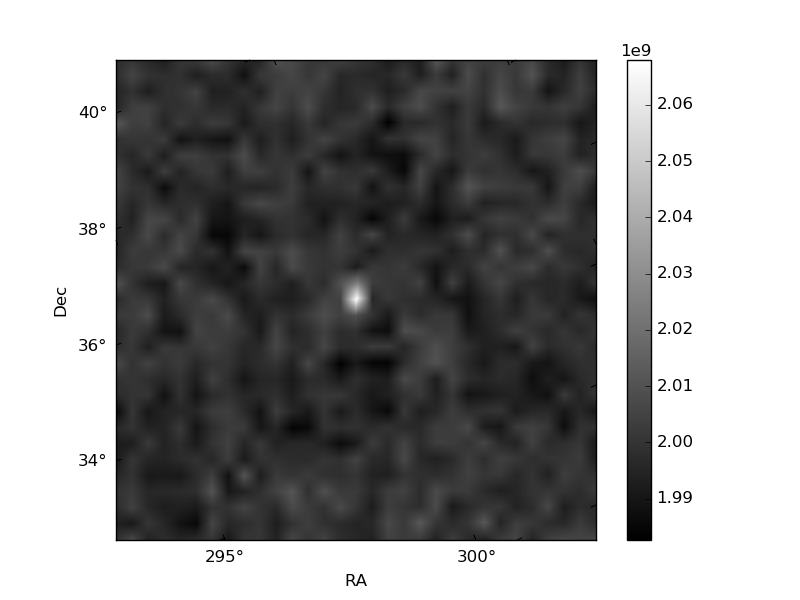
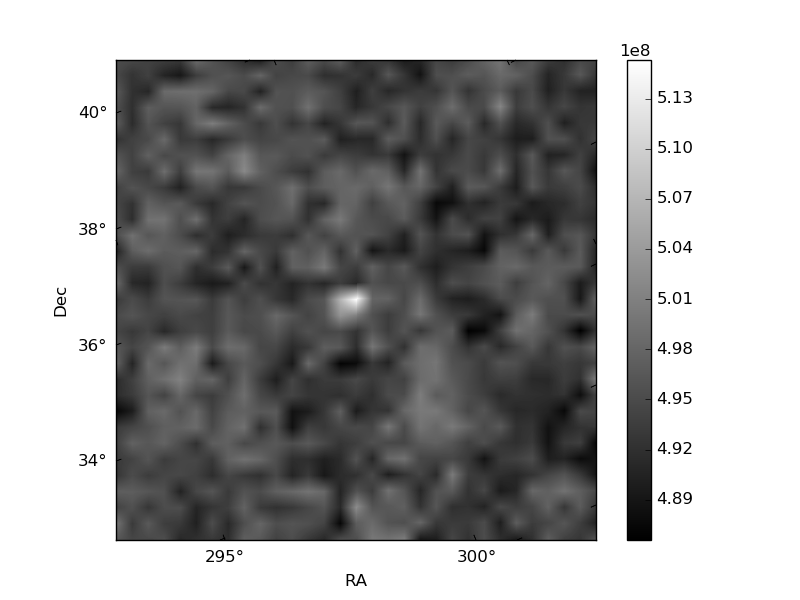
| Plot type | Count rate plots | Images |
|---|---|---|
| Comparison with Poisson distribution Blue bars denote a histogram of data divided into 1 sec bins. Red curve is a Poisson curve with rate = median count rate of data. |
 |
 |
| Quadrant-wise count rates Data is divided into 100 sec bins |
 |
|
| Module-wise count rates for Quadrant A Data is divided into 100 sec bins |
 |
 |
| Module-wise count rates for Quadrant B Data is divided into 100 sec bins |
 |
 |
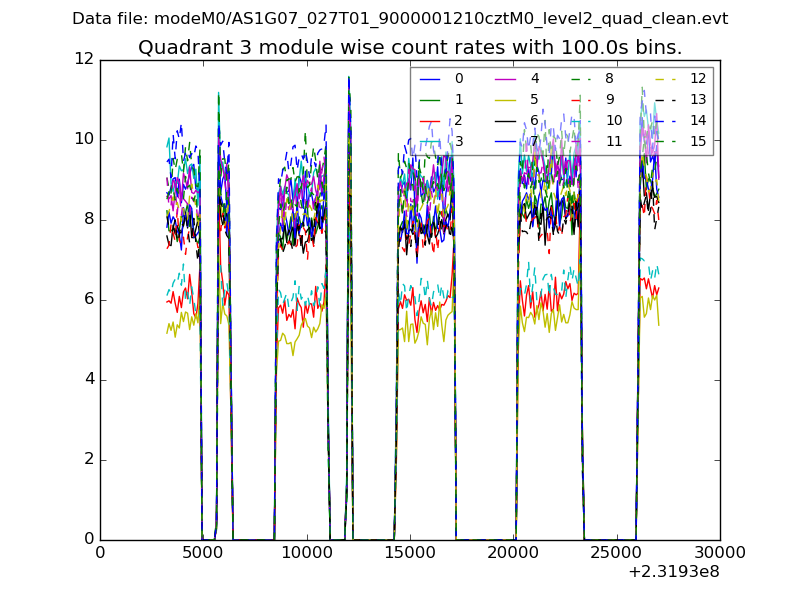
| Module-wise count rates for Quadrant C Data is divided into 100 sec bins |
 |
 |
| Module-wise count rates for Quadrant D Data is divided into 100 sec bins |
 |
 |
| Parameter | Plot |
|---|---|
| CZT HV Monitor |  |
| D_VDD | 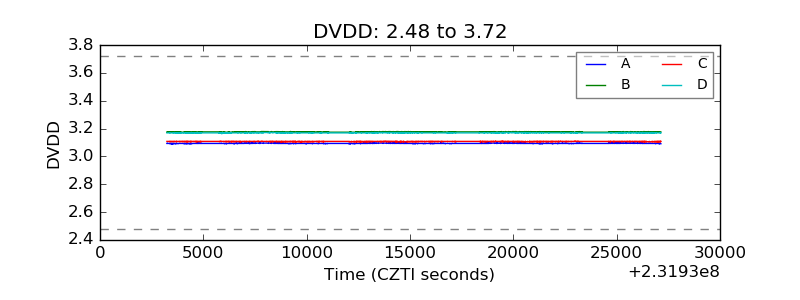 |
| Temperature 1 |  |
| Veto HV Monitor |  |
| Veto LLD |  |
| Alpha Counter |  |
| _CPM_Rate |  |
| CZT Counter | 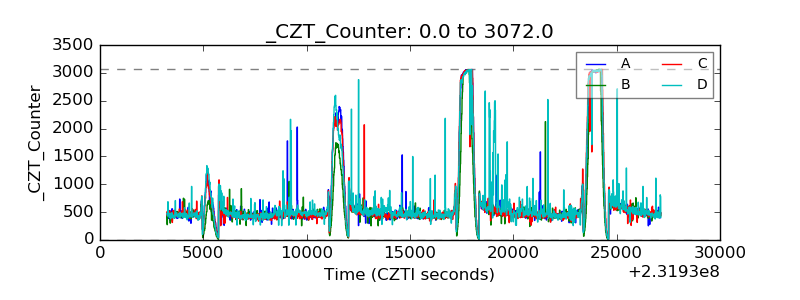 |
| +2.5 Volts monitor |  |
| +5 Volts monitor |  |
| _ROLL_ROT |  |
| _Roll_DEC |  |
| _Roll_RA |  |
| Veto Counter |  |