| Param | Original file | Final file |
|---|---|---|
| Filename | modeM0/AS1G07_027T01_9000001210_08710cztM0_level2.evt | modeM0/AS1G07_027T01_9000001210_08710cztM0_level2_quad_clean.evt |
| Size (bytes) | 466,165,440 | 68,918,400 |
| Size | 444.6 MB | 65.7 MB |
| Events in quadrant A | 3,310,367 | 410,779 |
| Events in quadrant B | 3,252,236 | 412,147 |
| Events in quadrant C | 3,170,037 | 410,489 |
| Events in quadrant D | 3,938,568 | 395,017 |
| Mode SS | |||
|---|---|---|---|
| Quadrant | BADHDUFLAG | Total packets | Discarded packets |
| A | 0 | 134 | 0 |
| B | 0 | 134 | 0 |
| C | 0 | 134 | 0 |
| D | 0 | 134 | 0 |
| Mode M9 | |||
|---|---|---|---|
| Quadrant | BADHDUFLAG | Total packets | Discarded packets |
| A | 0 | 18 | 0 |
| B | 0 | 18 | 0 |
| C | 0 | 18 | 0 |
| D | 0 | 19 | 0 |
| Mode M0 | |||
|---|---|---|---|
| Quadrant | BADHDUFLAG | Total packets | Discarded packets |
| A | 0 | 13995 | 3 |
| B | 0 | 13765 | 2 |
| C | 0 | 13628 | 2 |
| D | 0 | 15893 | 2 |
| Quadrant | Total seconds | Saturated seconds | Saturation percentage |
|---|---|---|---|
| A | 6569 | 103 | 1.567971% |
| B | 6569 | 94 | 1.430964% |
| C | 6569 | 84 | 1.278733% |
| D | 6569 | 313 | 4.764804% |
Noise dominated data is calculated using 1-second bins in cleaned event files. If a bin has >2000 counts, and if more than 50% of those come from <1% of pixels, then it is considered to be noise-dominated and hence unusable.
| Quadrant | # 1 sec bins | Bins with >0 counts | Bins with >2000 counts | High rate bins dominated by noise | Noise dominated (total time) | Noise dominated (detector-on time) | Marked lightcurve |
|---|---|---|---|---|---|---|---|
| A | 7674 | 6569 | 5 | 5 | 0.07% | 0.08% | 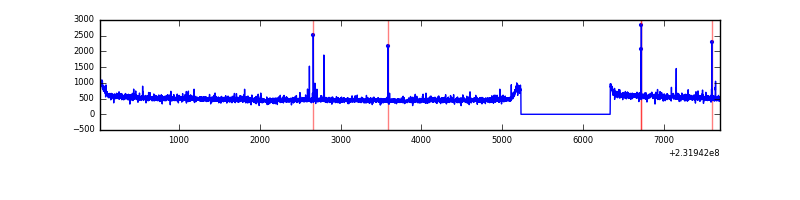 |
| B | 7674 | 6569 | 0 | 0 | 0.00% | 0.00% | 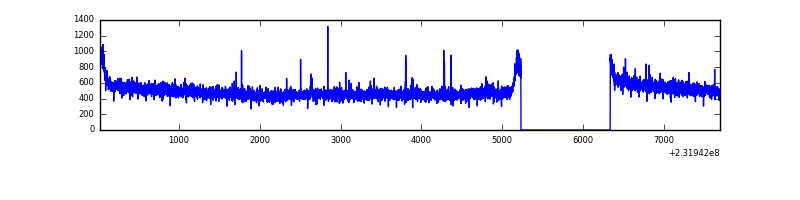 |
| C | 7674 | 6569 | 1 | 1 | 0.01% | 0.02% | 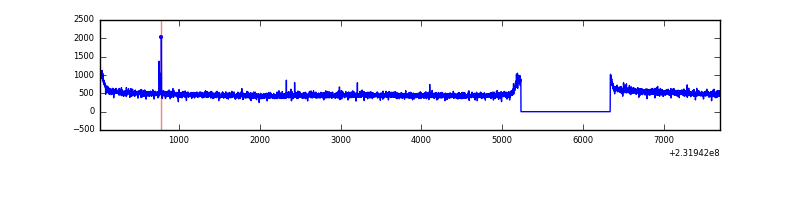 |
| D | 7674 | 6569 | 152 | 152 | 1.98% | 2.31% | 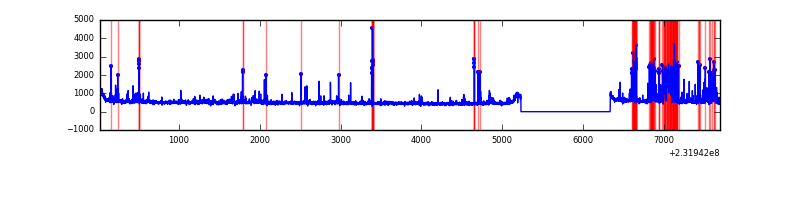 |
Top three noisy pixels from each quadrant. If the there are fewer than three noisy pixels in the level2.evt file, extra rows are filled as -1
| Pixel properties | Quadrant properties | ||||||
|---|---|---|---|---|---|---|---|
| Quadrant | DetID | PixID | Counts | Sigma | Mean | Median | Sigma |
| A | 13 | 251 | 71212 | 415.62 | 832 | 815 | 169.4 |
| A | 15 | 174 | 22356 | 127.18 | 832 | 815 | 169.4 |
| A | 5 | 16 | 8894 | 47.7 | 832 | 815 | 169.4 |
| B | 12 | 111 | 16197 | 96.2 | 832 | 812 | 159.9 |
| B | 11 | 111 | 13282 | 77.98 | 832 | 812 | 159.9 |
| B | 4 | 173 | 10507 | 60.62 | 832 | 812 | 159.9 |
| C | 14 | 234 | 11700 | 58.02 | 808 | 813 | 187.7 |
| C | 13 | 61 | 6148 | 28.43 | 808 | 813 | 187.7 |
| C | 14 | 67 | 3528 | 14.47 | 808 | 813 | 187.7 |
| D | 2 | 152 | 522532 | 2741.62 | 788 | 771 | 190.3 |
| D | 8 | 195 | 139981 | 731.49 | 788 | 771 | 190.3 |
| D | 1 | 52 | 126192 | 659.03 | 788 | 771 | 190.3 |
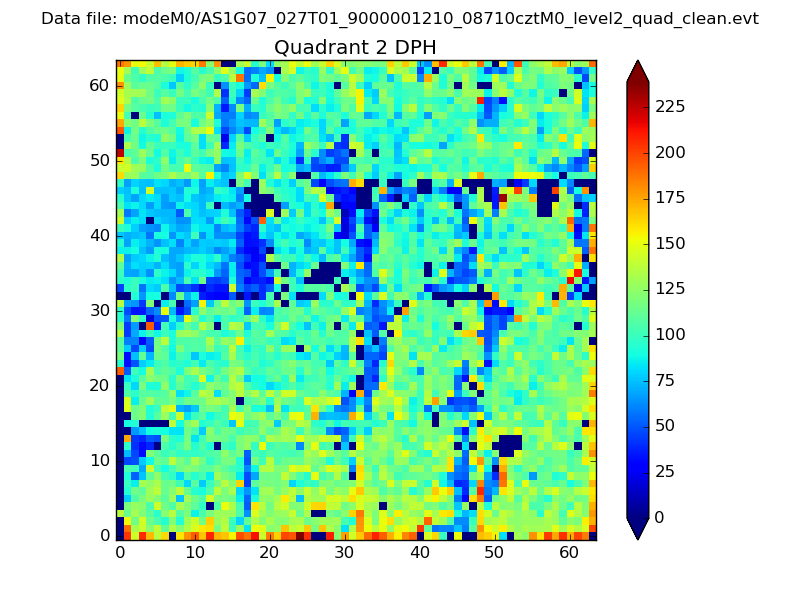
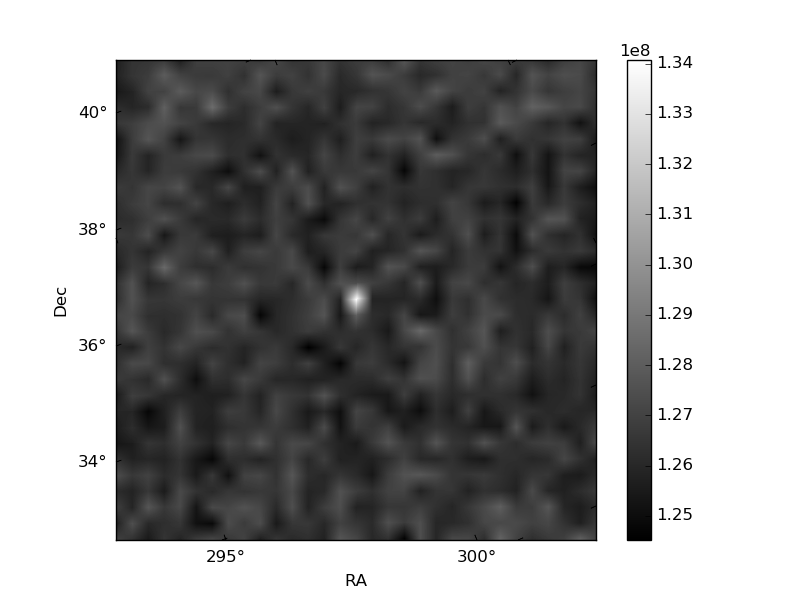
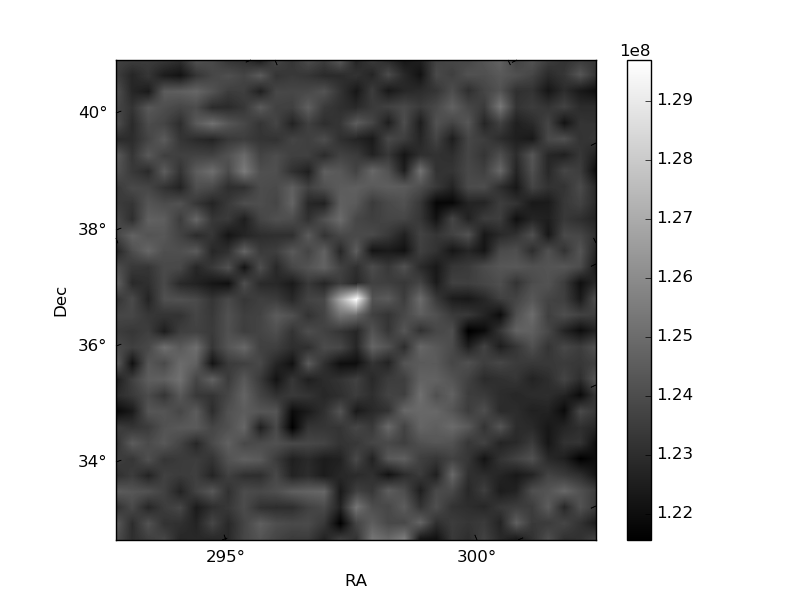
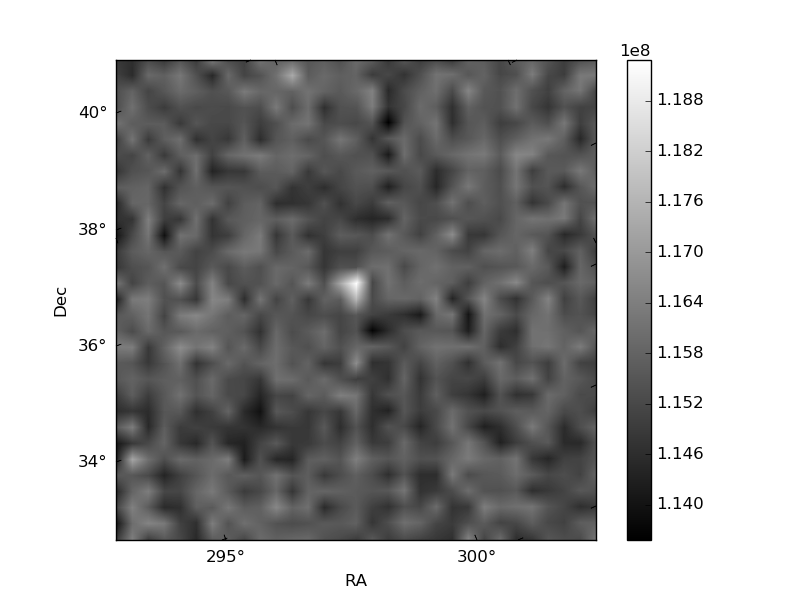
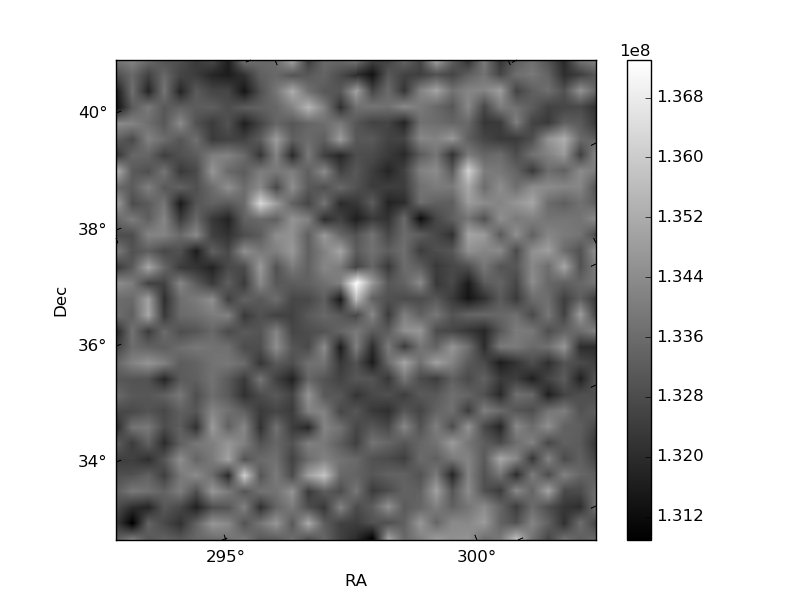
Histogram calculated using DETX and DETY for each event in the final _common_clean file
| Quadrant A | 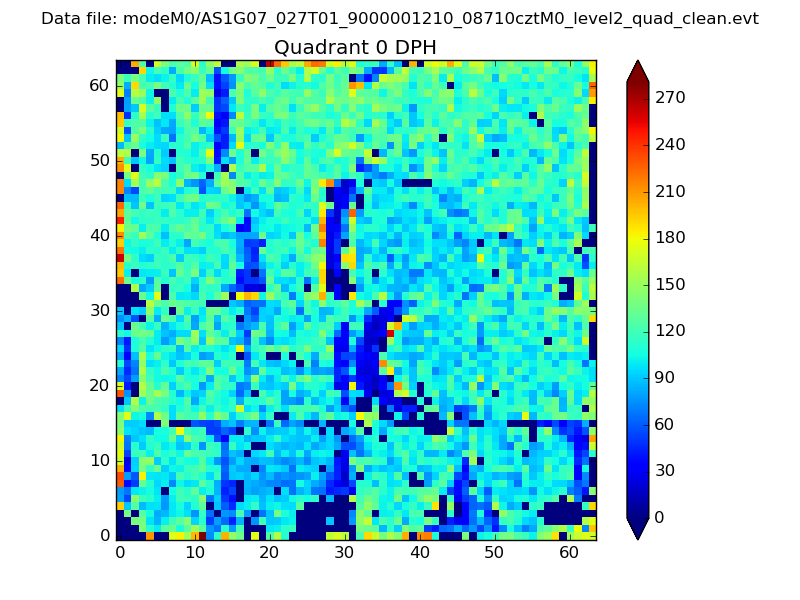 |
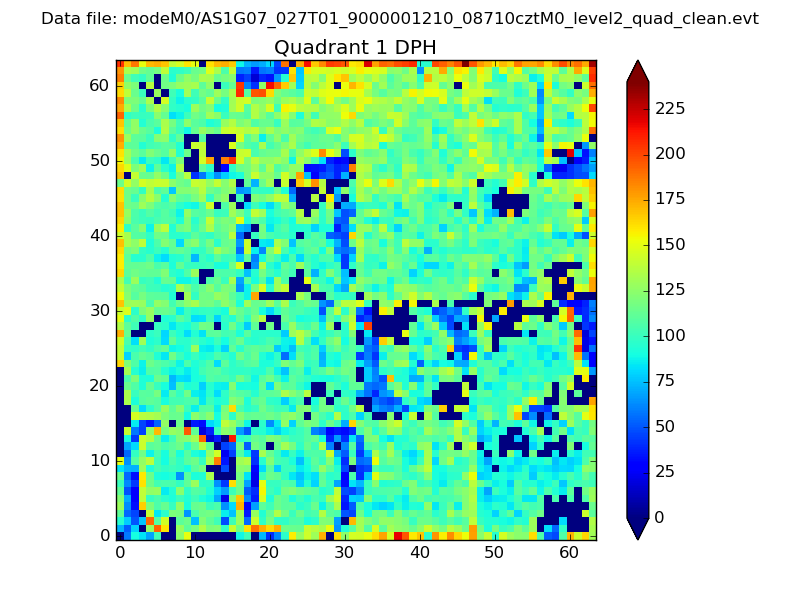 |
Quadrant B |
|---|---|---|---|
| Quadrant D | 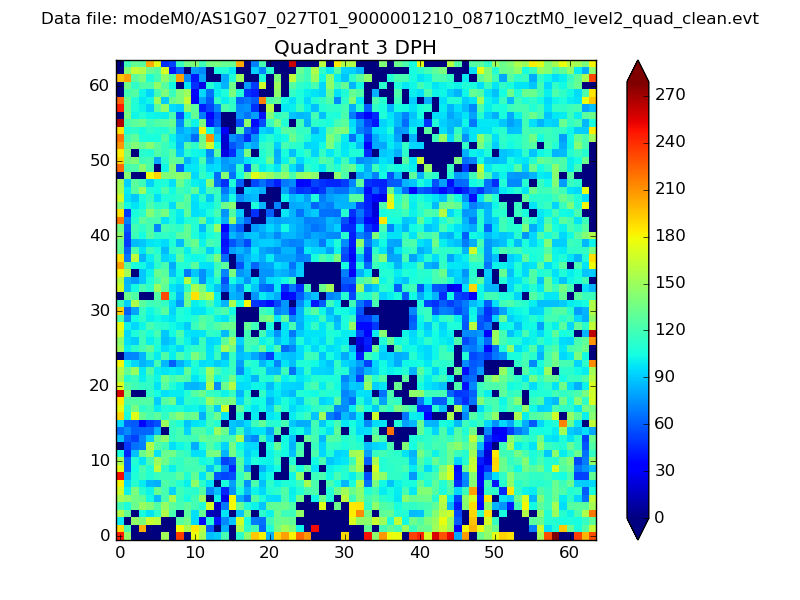 |
 |
Quadrant C |
| Plot type | Count rate plots | Images |
|---|---|---|
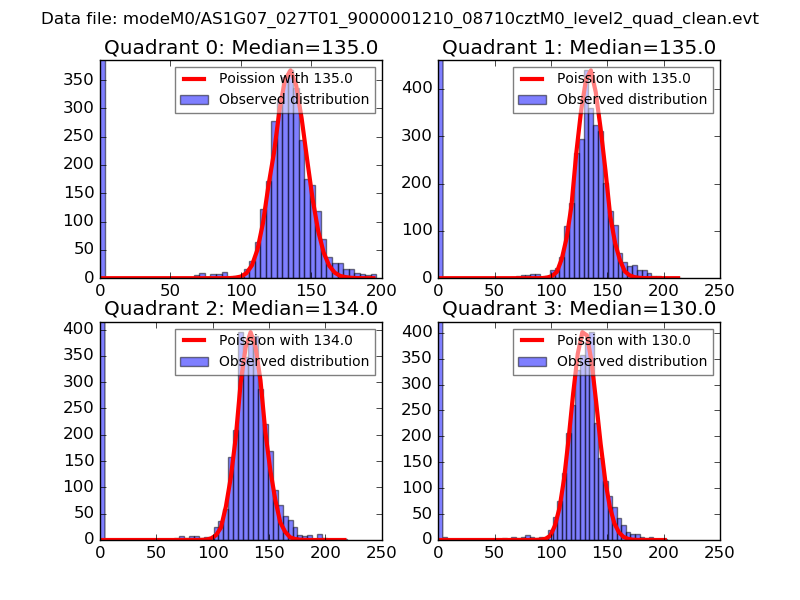
| Comparison with Poisson distribution Blue bars denote a histogram of data divided into 1 sec bins. Red curve is a Poisson curve with rate = median count rate of data. |
 |
 |
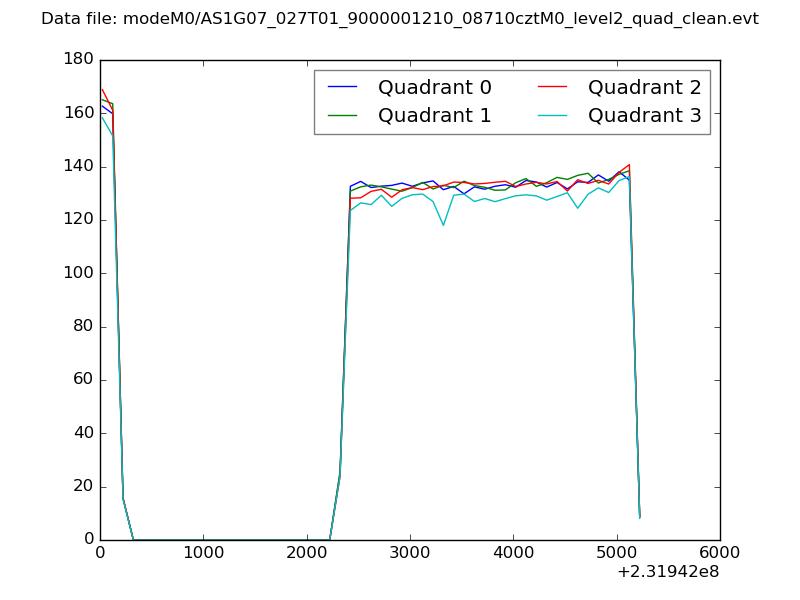
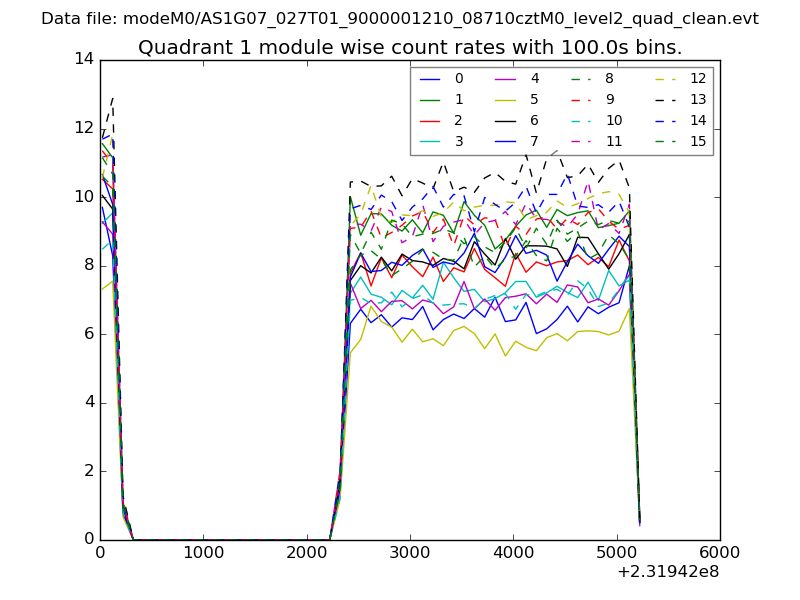
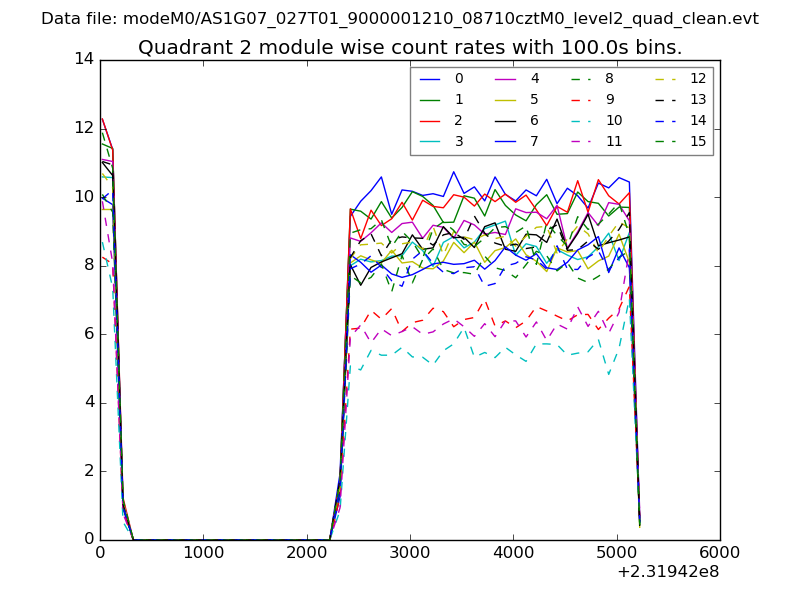
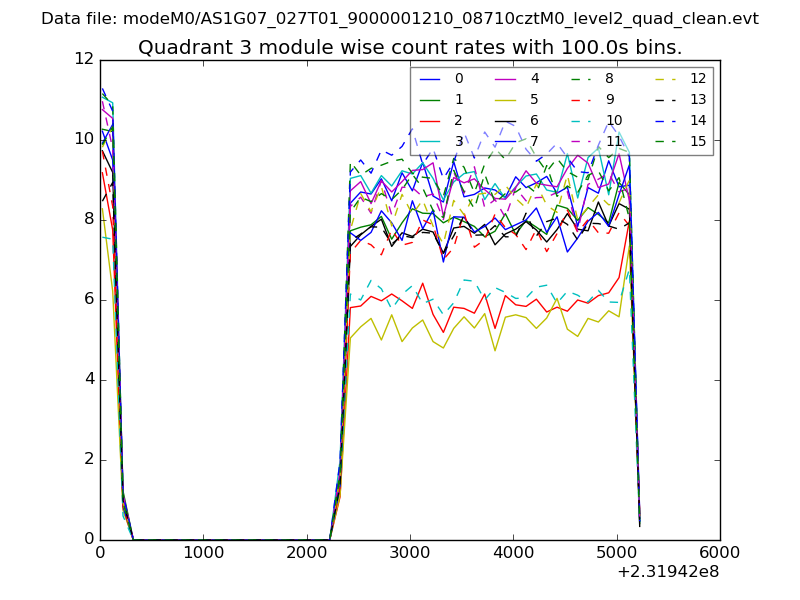
| Quadrant-wise count rates Data is divided into 100 sec bins |
 |
|
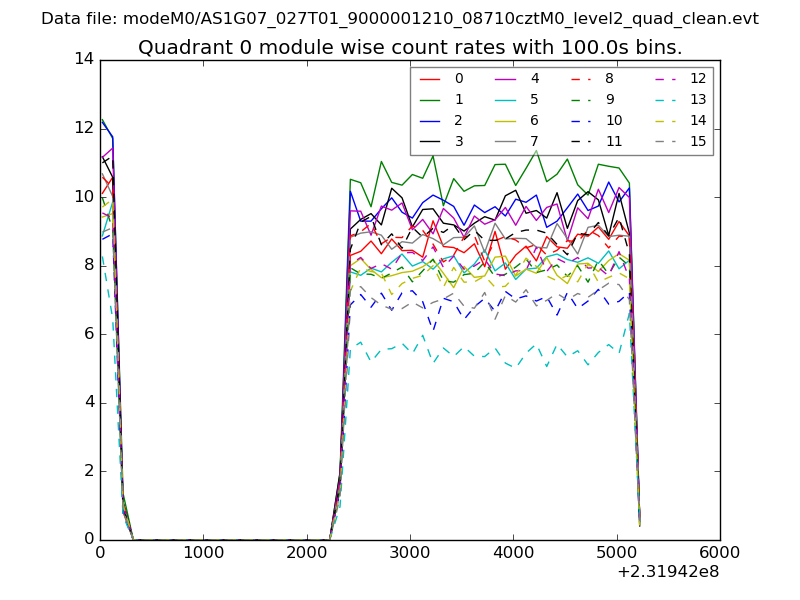
| Module-wise count rates for Quadrant A Data is divided into 100 sec bins |
 |
 |
| Module-wise count rates for Quadrant B Data is divided into 100 sec bins |
 |
 |
| Module-wise count rates for Quadrant C Data is divided into 100 sec bins |
 |
 |
| Module-wise count rates for Quadrant D Data is divided into 100 sec bins |
 |
 |
| Parameter | Plot |
|---|---|
| CZT HV Monitor | 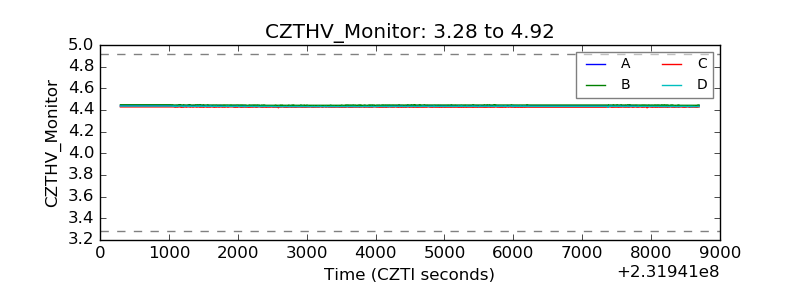 |
| D_VDD | 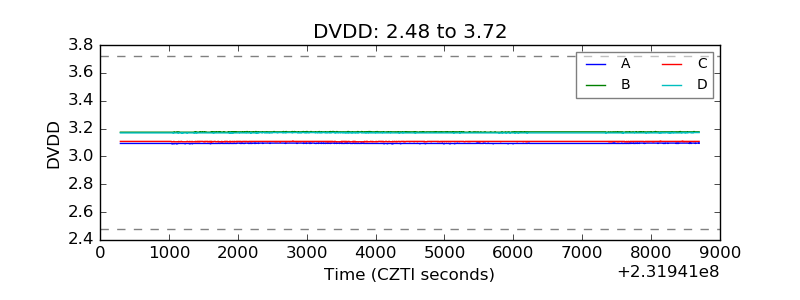 |
| Temperature 1 |  |
| Veto HV Monitor | 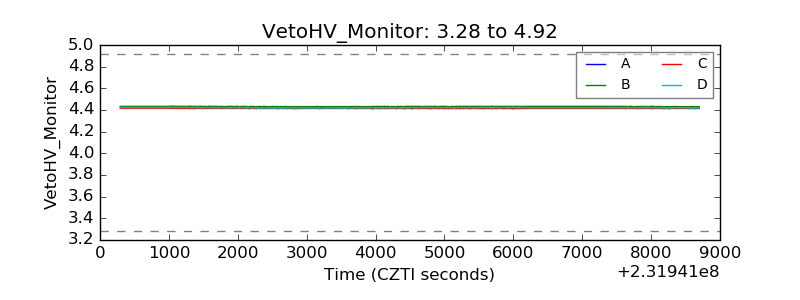 |
| Veto LLD | 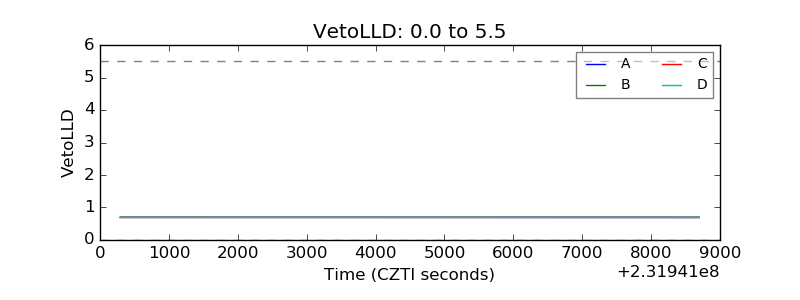 |
| Alpha Counter | 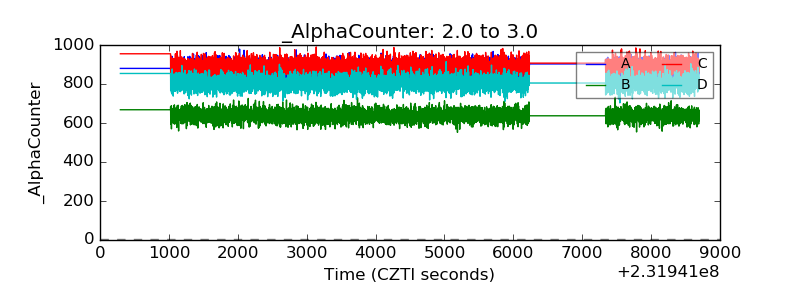 |
| _CPM_Rate | 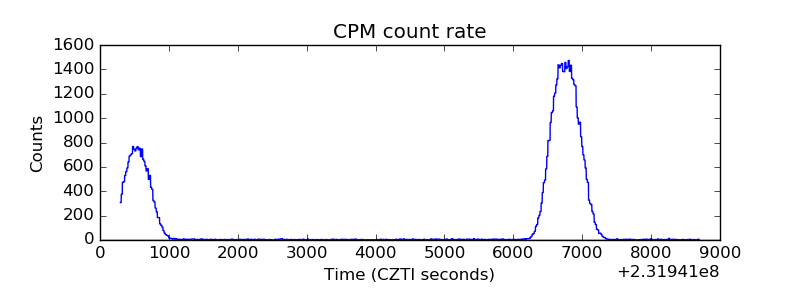 |
| CZT Counter | 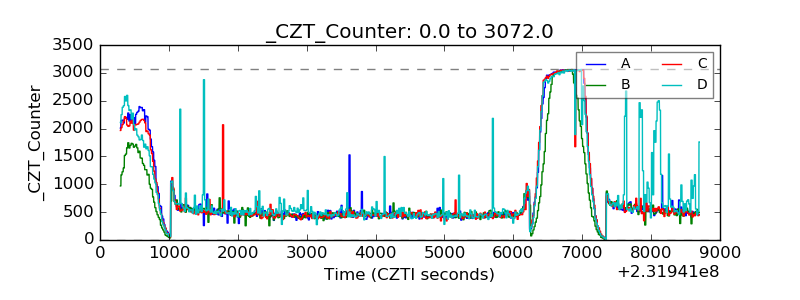 |
| +2.5 Volts monitor |  |
| +5 Volts monitor |  |
| _ROLL_ROT |  |
| _Roll_DEC |  |
| _Roll_RA | 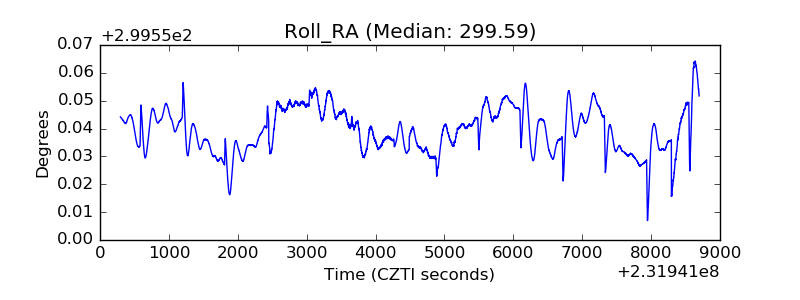 |
| Veto Counter | 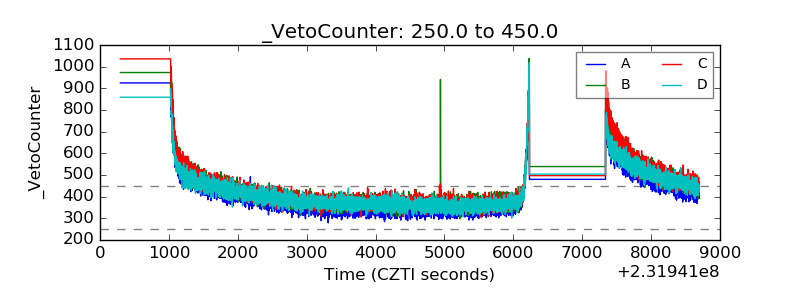 |