| Param | Original file | Final file |
|---|---|---|
| Filename | modeM0/AS1G07_027T01_9000001210_08711cztM0_level2.evt | modeM0/AS1G07_027T01_9000001210_08711cztM0_level2_quad_clean.evt |
| Size (bytes) | 450,034,560 | 70,744,320 |
| Size | 429.2 MB | 67.5 MB |
| Events in quadrant A | 3,181,938 | 431,258 |
| Events in quadrant B | 3,127,714 | 432,451 |
| Events in quadrant C | 3,050,510 | 431,992 |
| Events in quadrant D | 3,851,991 | 417,688 |
| Mode SS | |||
|---|---|---|---|
| Quadrant | BADHDUFLAG | Total packets | Discarded packets |
| A | 0 | 124 | 0 |
| B | 0 | 124 | 0 |
| C | 0 | 124 | 0 |
| D | 0 | 124 | 0 |
| Mode M9 | |||
|---|---|---|---|
| Quadrant | BADHDUFLAG | Total packets | Discarded packets |
| A | 0 | 13 | 0 |
| B | 0 | 13 | 0 |
| C | 0 | 13 | 0 |
| D | 0 | 13 | 0 |
| Mode M0 | |||
|---|---|---|---|
| Quadrant | BADHDUFLAG | Total packets | Discarded packets |
| A | 0 | 13364 | 2 |
| B | 0 | 13126 | 1 |
| C | 0 | 12926 | 1 |
| D | 0 | 15451 | 1 |
| Quadrant | Total seconds | Saturated seconds | Saturation percentage |
|---|---|---|---|
| A | 6142 | 71 | 1.155975% |
| B | 6142 | 57 | 0.928036% |
| C | 6142 | 49 | 0.797786% |
| D | 6142 | 304 | 4.949528% |
Noise dominated data is calculated using 1-second bins in cleaned event files. If a bin has >2000 counts, and if more than 50% of those come from <1% of pixels, then it is considered to be noise-dominated and hence unusable.
| Quadrant | # 1 sec bins | Bins with >0 counts | Bins with >2000 counts | High rate bins dominated by noise | Noise dominated (total time) | Noise dominated (detector-on time) | Marked lightcurve |
|---|---|---|---|---|---|---|---|
| A | 7372 | 6142 | 11 | 11 | 0.15% | 0.18% | 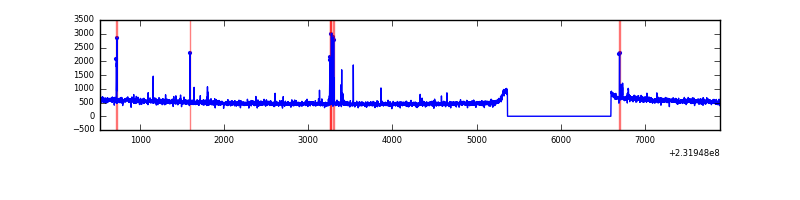 |
| B | 7372 | 6142 | 1 | 1 | 0.01% | 0.02% | 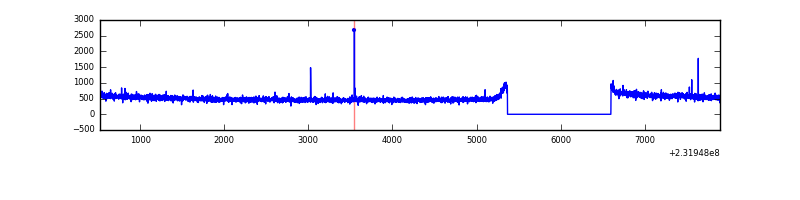 |
| C | 7372 | 6142 | 0 | 0 | 0.00% | 0.00% | 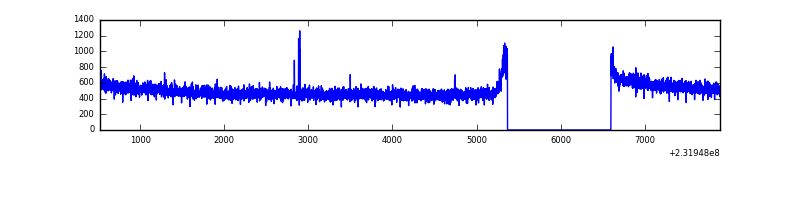 |
| D | 7372 | 6142 | 179 | 179 | 2.43% | 2.91% |  |
Top three noisy pixels from each quadrant. If the there are fewer than three noisy pixels in the level2.evt file, extra rows are filled as -1
| Pixel properties | Quadrant properties | ||||||
|---|---|---|---|---|---|---|---|
| Quadrant | DetID | PixID | Counts | Sigma | Mean | Median | Sigma |
| A | 13 | 251 | 83048 | 513.45 | 795 | 781 | 160.2 |
| A | 15 | 174 | 27208 | 164.94 | 795 | 781 | 160.2 |
| A | 0 | 254 | 9306 | 53.21 | 795 | 781 | 160.2 |
| B | 12 | 111 | 14905 | 94.29 | 798 | 782 | 149.8 |
| B | 11 | 111 | 12199 | 76.23 | 798 | 782 | 149.8 |
| B | 0 | 219 | 8424 | 51.02 | 798 | 782 | 149.8 |
| C | 13 | 61 | 6045 | 29.2 | 780 | 785 | 180.1 |
| C | 14 | 234 | 5257 | 24.83 | 780 | 785 | 180.1 |
| C | 14 | 67 | 3763 | 16.53 | 780 | 785 | 180.1 |
| D | 2 | 152 | 511330 | 2768.51 | 754 | 736 | 184.4 |
| D | 1 | 52 | 171487 | 925.84 | 754 | 736 | 184.4 |
| D | 7 | 55 | 80423 | 432.07 | 754 | 736 | 184.4 |
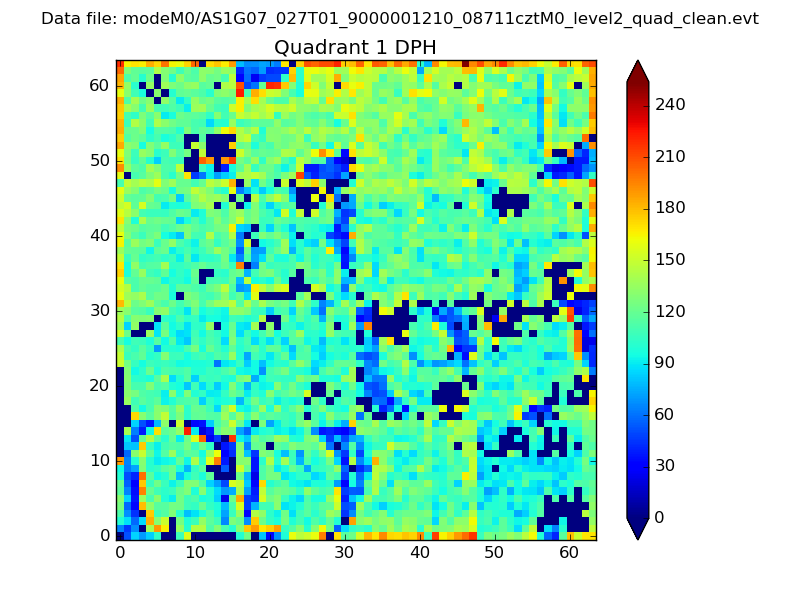
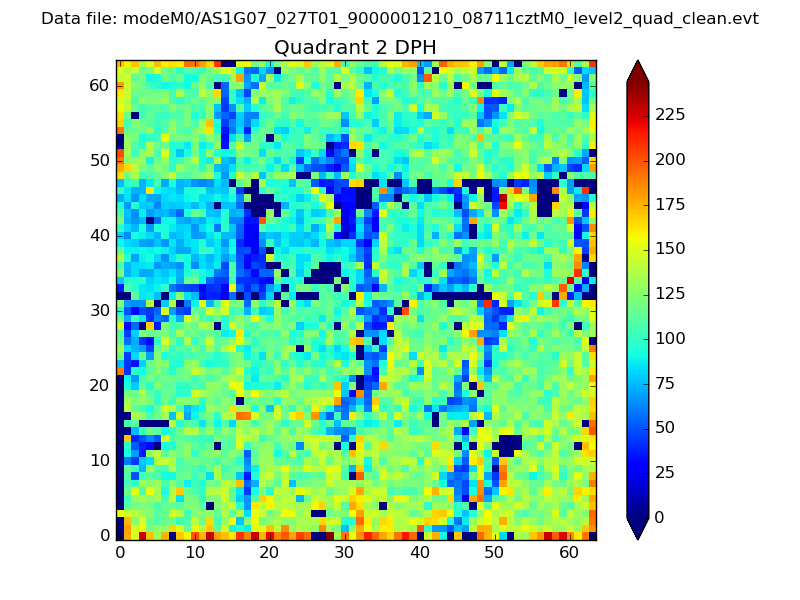
Histogram calculated using DETX and DETY for each event in the final _common_clean file
| Quadrant A | 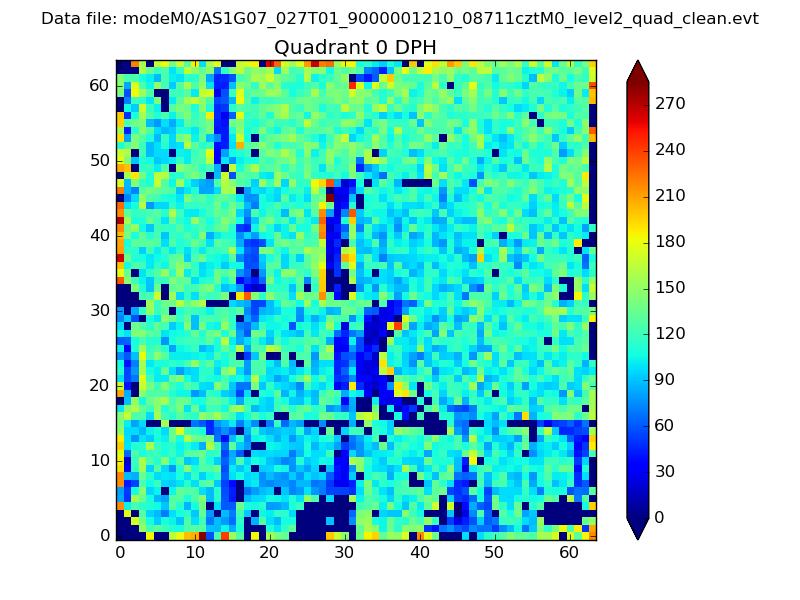 |
 |
Quadrant B |
|---|---|---|---|
| Quadrant D | 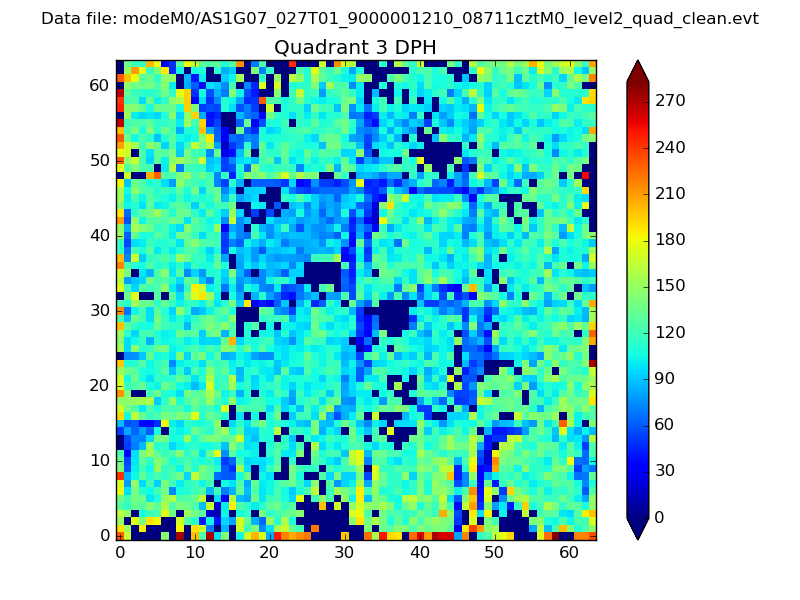 |
 |
Quadrant C |
| Plot type | Count rate plots | Images |
|---|---|---|
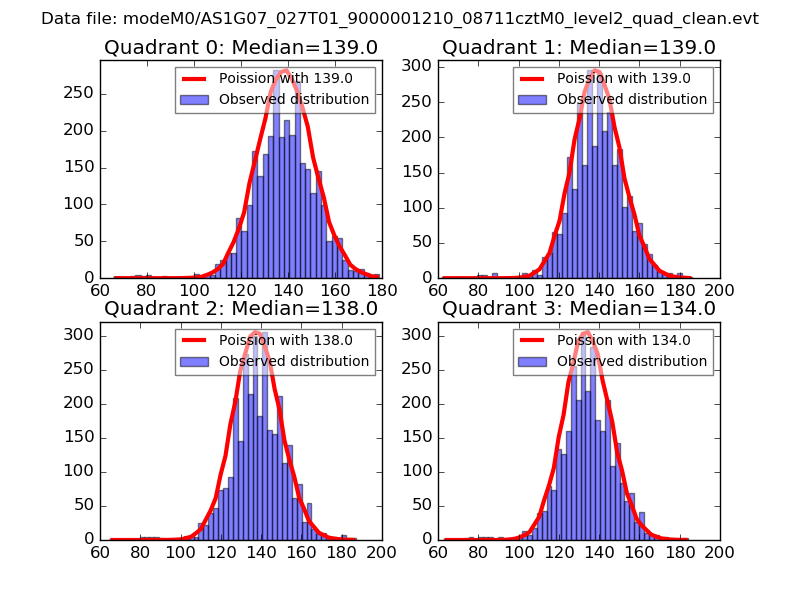
| Comparison with Poisson distribution Blue bars denote a histogram of data divided into 1 sec bins. Red curve is a Poisson curve with rate = median count rate of data. |
 |
 |
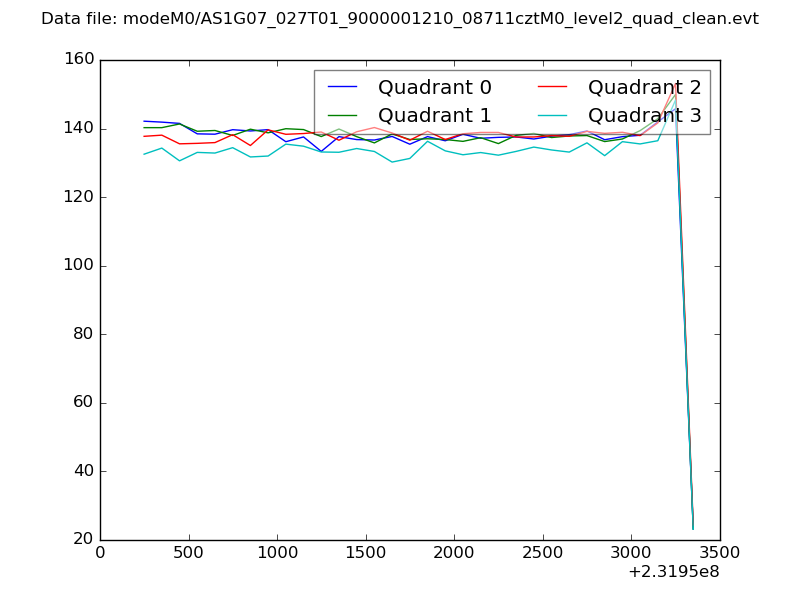
| Quadrant-wise count rates Data is divided into 100 sec bins |
 |
|
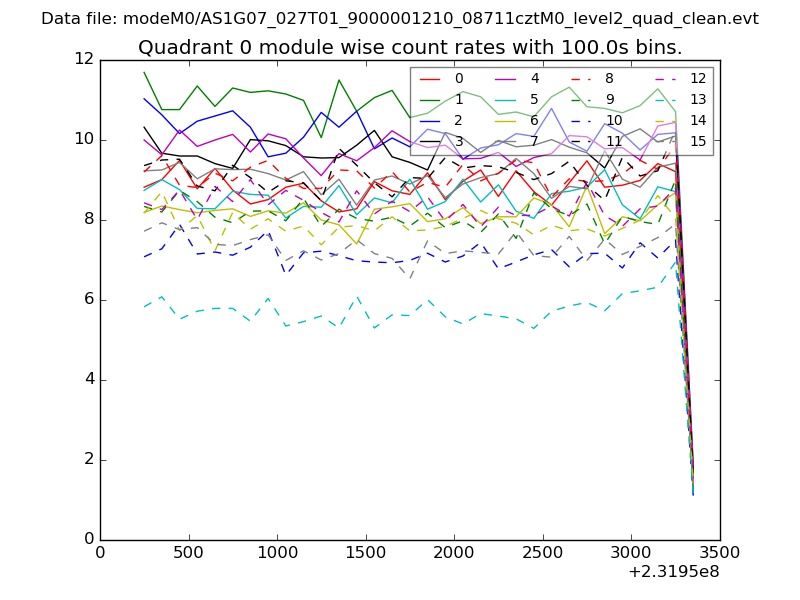
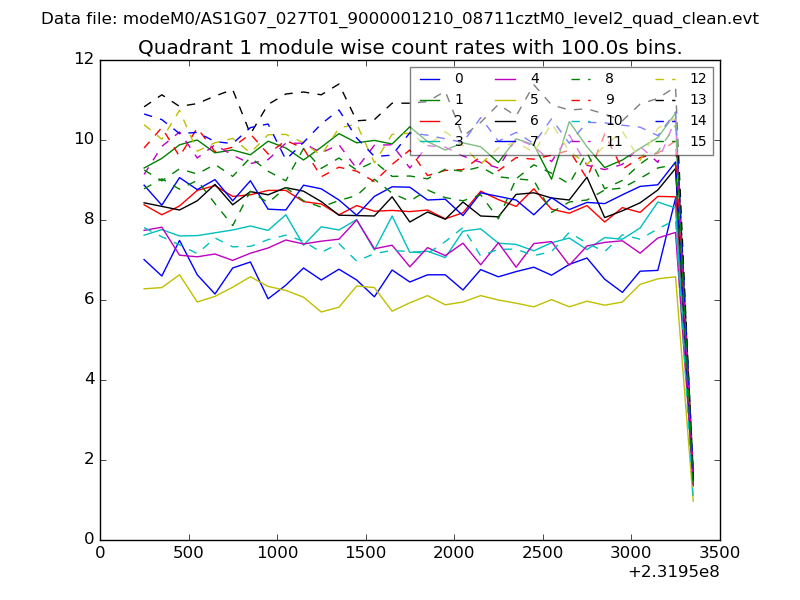
| Module-wise count rates for Quadrant A Data is divided into 100 sec bins |
 |
 |
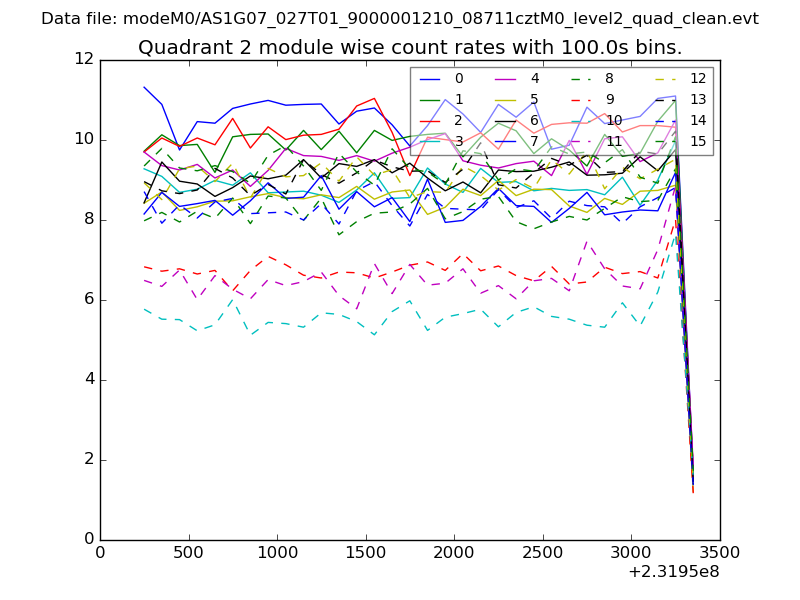
| Module-wise count rates for Quadrant B Data is divided into 100 sec bins |
 |
 |
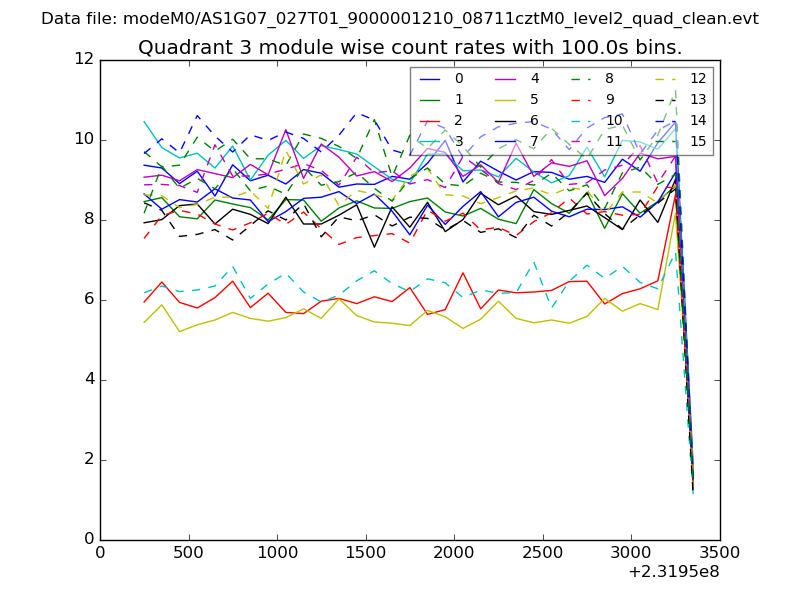
| Module-wise count rates for Quadrant C Data is divided into 100 sec bins |
 |
 |
| Module-wise count rates for Quadrant D Data is divided into 100 sec bins |
 |
 |
| Parameter | Plot |
|---|---|
| CZT HV Monitor | 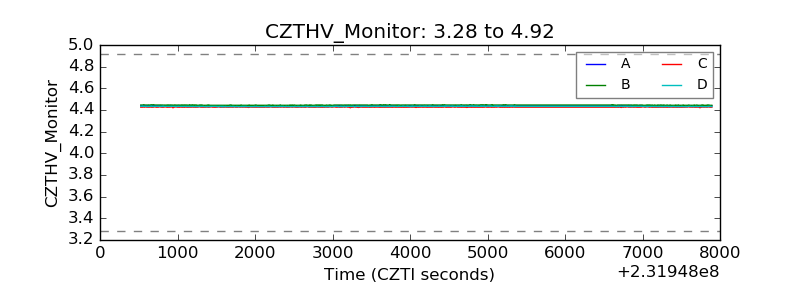 |
| D_VDD | 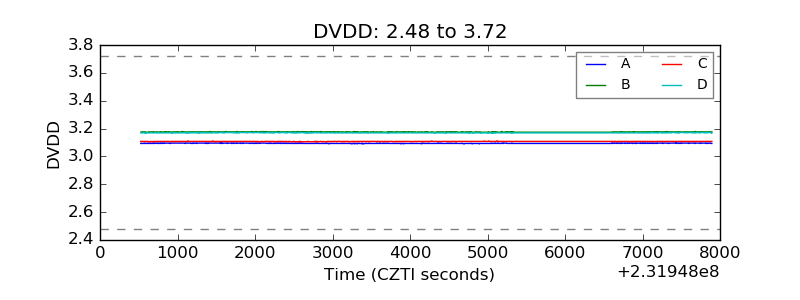 |
| Temperature 1 |  |
| Veto HV Monitor | 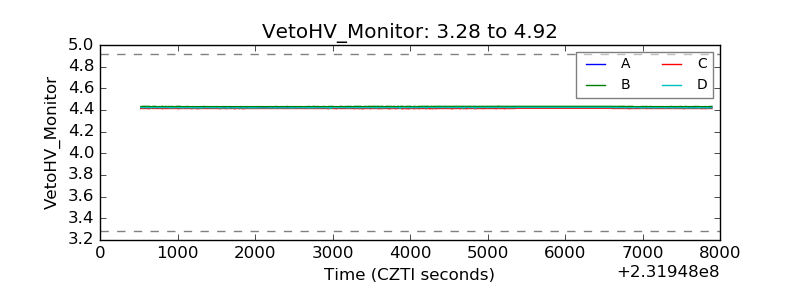 |
| Veto LLD | 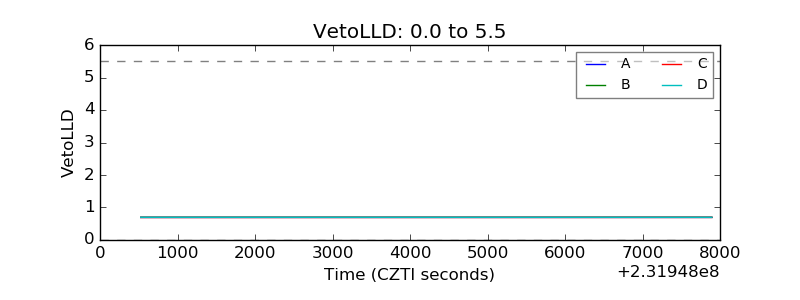 |
| Alpha Counter | 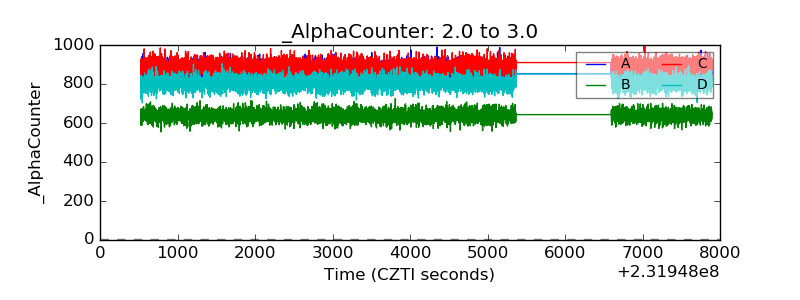 |
| _CPM_Rate | 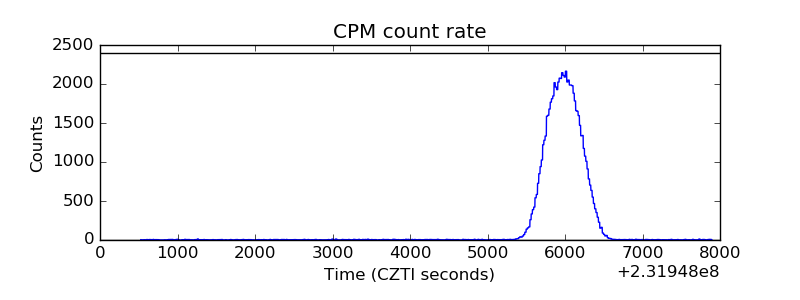 |
| CZT Counter | 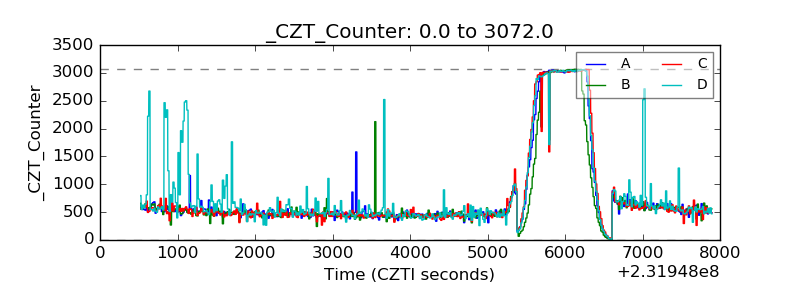 |
| +2.5 Volts monitor |  |
| +5 Volts monitor |  |
| _ROLL_ROT | 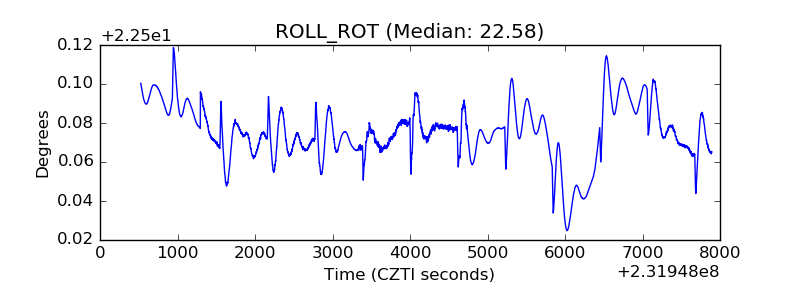 |
| _Roll_DEC | 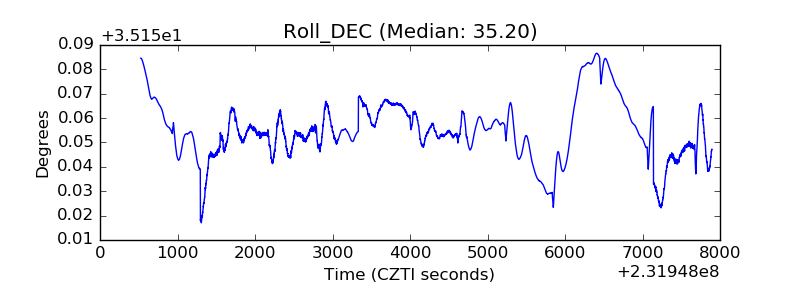 |
| _Roll_RA | 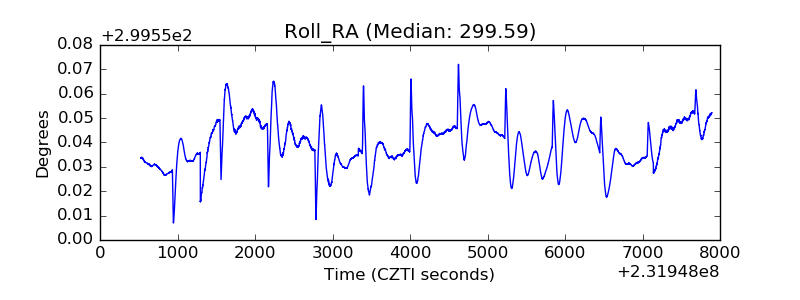 |
| Veto Counter | 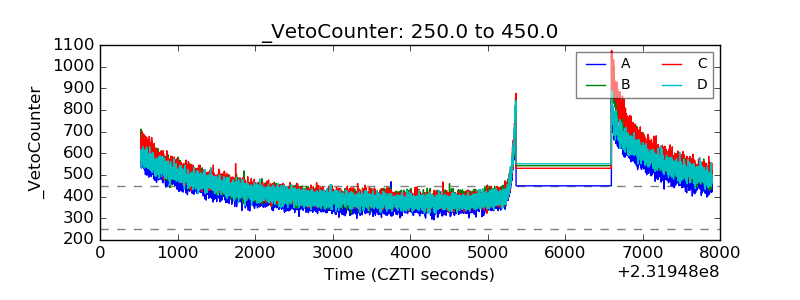 |