| Param | Original file | Final file |
|---|---|---|
| Filename | modeM0/AS1G07_027T01_9000001210_08712cztM0_level2.evt | modeM0/AS1G07_027T01_9000001210_08712cztM0_level2_quad_clean.evt |
| Size (bytes) | 173,200,320 | 25,879,680 |
| Size | 165.2 MB | 24.7 MB |
| Events in quadrant A | 1,245,197 | 154,569 |
| Events in quadrant B | 1,248,276 | 155,627 |
| Events in quadrant C | 1,222,641 | 154,177 |
| Events in quadrant D | 1,366,132 | 148,114 |
| Mode SS | |||
|---|---|---|---|
| Quadrant | BADHDUFLAG | Total packets | Discarded packets |
| A | 0 | 48 | 0 |
| B | 0 | 48 | 0 |
| C | 0 | 48 | 0 |
| D | 0 | 48 | 0 |
| Mode M0 | |||
|---|---|---|---|
| Quadrant | BADHDUFLAG | Total packets | Discarded packets |
| A | 0 | 5123 | 2 |
| B | 0 | 5122 | 0 |
| C | 0 | 4994 | 0 |
| D | 0 | 5536 | 0 |
| Quadrant | Total seconds | Saturated seconds | Saturation percentage |
|---|---|---|---|
| A | 2364 | 5 | 0.211506% |
| B | 2365 | 3 | 0.126850% |
| C | 2365 | 1 | 0.042283% |
| D | 2365 | 43 | 1.818182% |
Noise dominated data is calculated using 1-second bins in cleaned event files. If a bin has >2000 counts, and if more than 50% of those come from <1% of pixels, then it is considered to be noise-dominated and hence unusable.
| Quadrant | # 1 sec bins | Bins with >0 counts | Bins with >2000 counts | High rate bins dominated by noise | Noise dominated (total time) | Noise dominated (detector-on time) | Marked lightcurve |
|---|---|---|---|---|---|---|---|
| A | 2365 | 2365 | 0 | 0 | 0.00% | 0.00% | 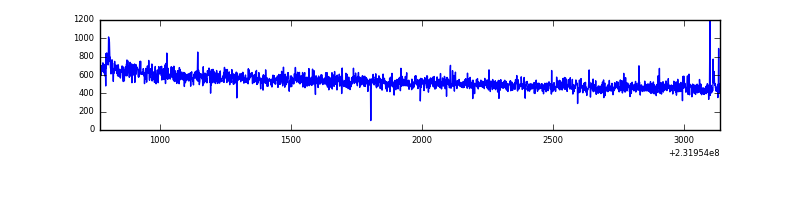 |
| B | 2365 | 2365 | 0 | 0 | 0.00% | 0.00% | 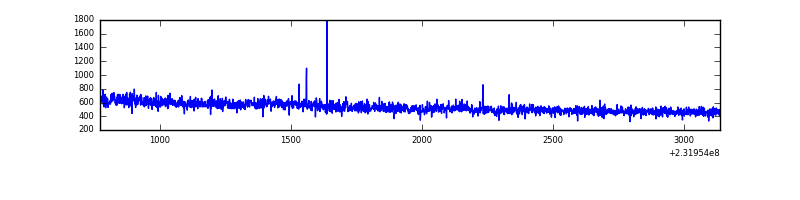 |
| C | 2365 | 2365 | 0 | 0 | 0.00% | 0.00% | 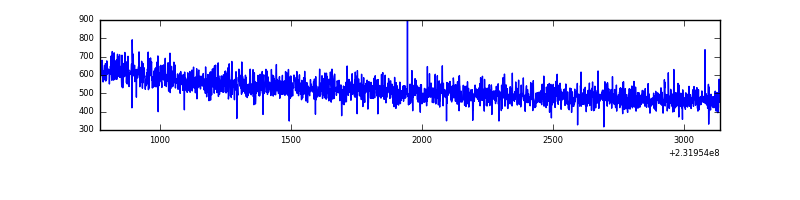 |
| D | 2365 | 2365 | 38 | 38 | 1.61% | 1.61% | 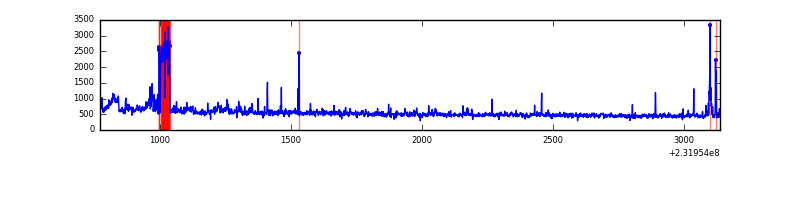 |
Top three noisy pixels from each quadrant. If the there are fewer than three noisy pixels in the level2.evt file, extra rows are filled as -1
| Pixel properties | Quadrant properties | ||||||
|---|---|---|---|---|---|---|---|
| Quadrant | DetID | PixID | Counts | Sigma | Mean | Median | Sigma |
| A | 13 | 251 | 16989 | 257.45 | 317 | 312 | 64.8 |
| A | 15 | 174 | 4033 | 57.44 | 317 | 312 | 64.8 |
| A | 5 | 16 | 3285 | 45.9 | 317 | 312 | 64.8 |
| B | 0 | 219 | 7493 | 118.9 | 318 | 312 | 60.4 |
| B | 12 | 111 | 5540 | 86.56 | 318 | 312 | 60.4 |
| B | 11 | 111 | 4673 | 72.21 | 318 | 312 | 60.4 |
| C | 13 | 61 | 2374 | 28.47 | 313 | 315 | 72.3 |
| C | 8 | 222 | 1309 | 13.75 | 313 | 315 | 72.3 |
| C | 12 | 4 | 850 | 7.4 | 313 | 315 | 72.3 |
| D | 7 | 55 | 79066 | 958.19 | 306 | 300 | 82.2 |
| D | 1 | 52 | 43295 | 523.04 | 306 | 300 | 82.2 |
| D | 12 | 233 | 20372 | 244.18 | 306 | 300 | 82.2 |
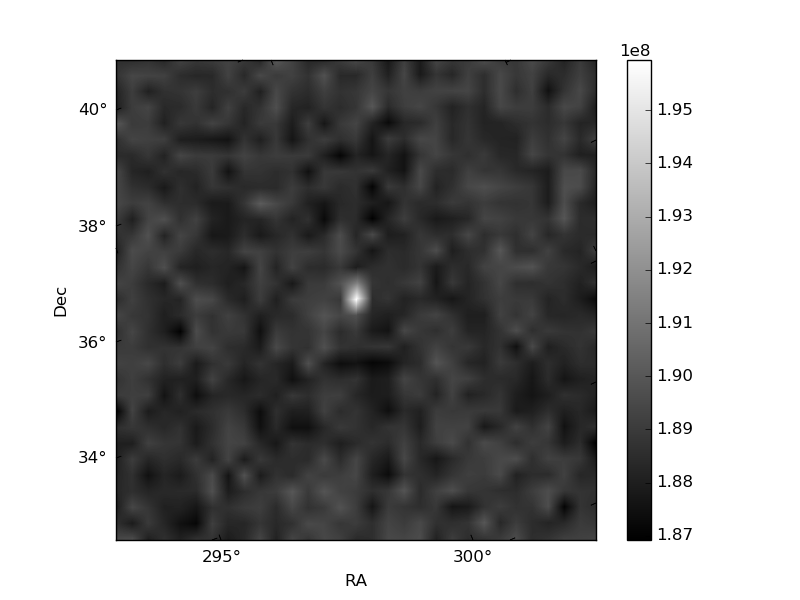
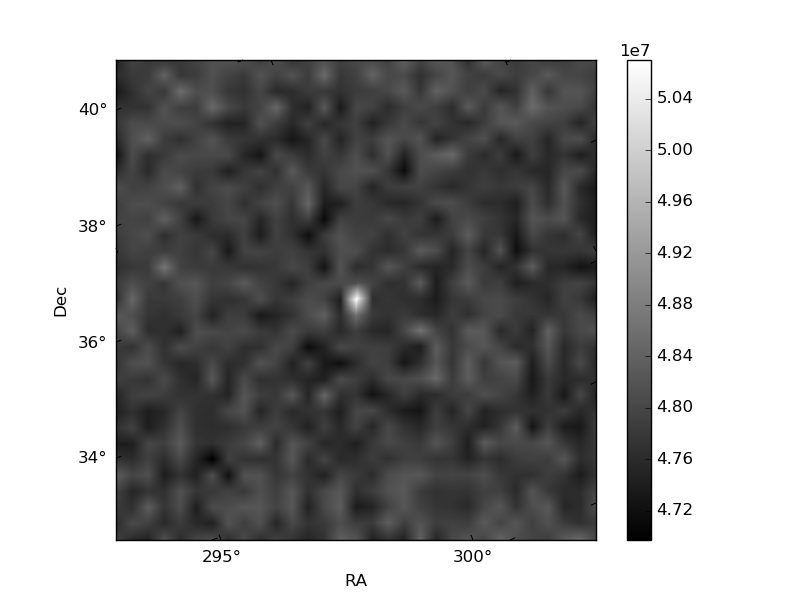
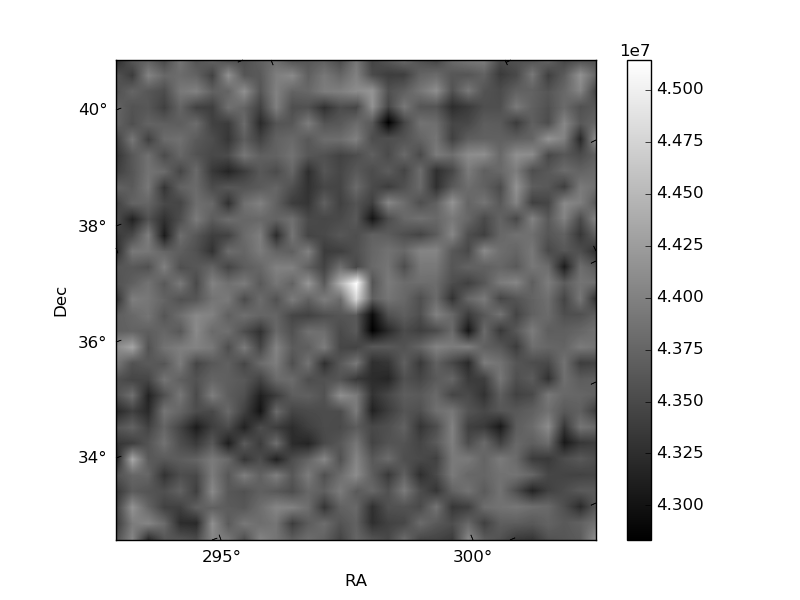
Histogram calculated using DETX and DETY for each event in the final _common_clean file
| Quadrant A | 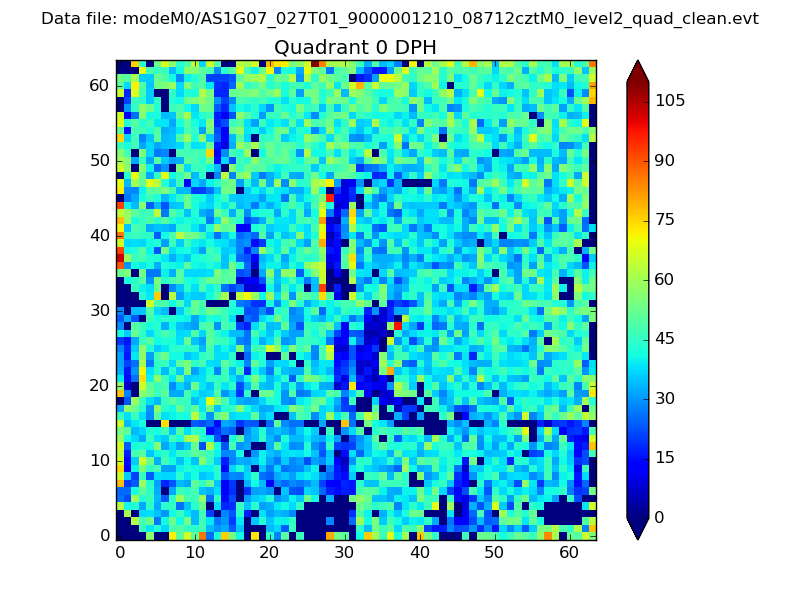 |
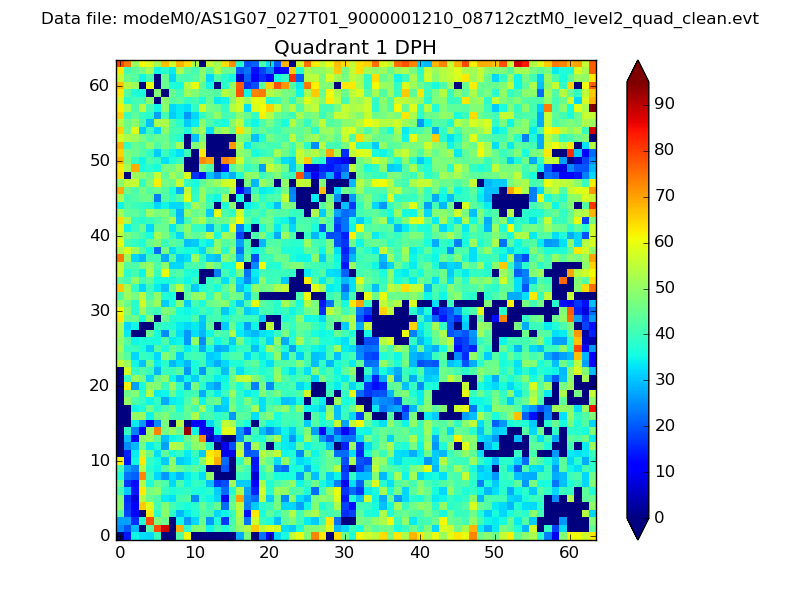 |
Quadrant B |
|---|---|---|---|
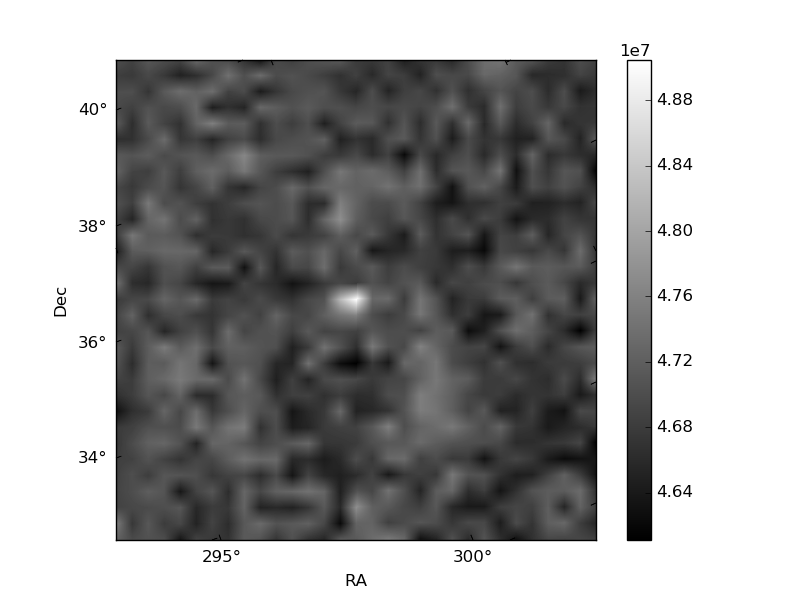
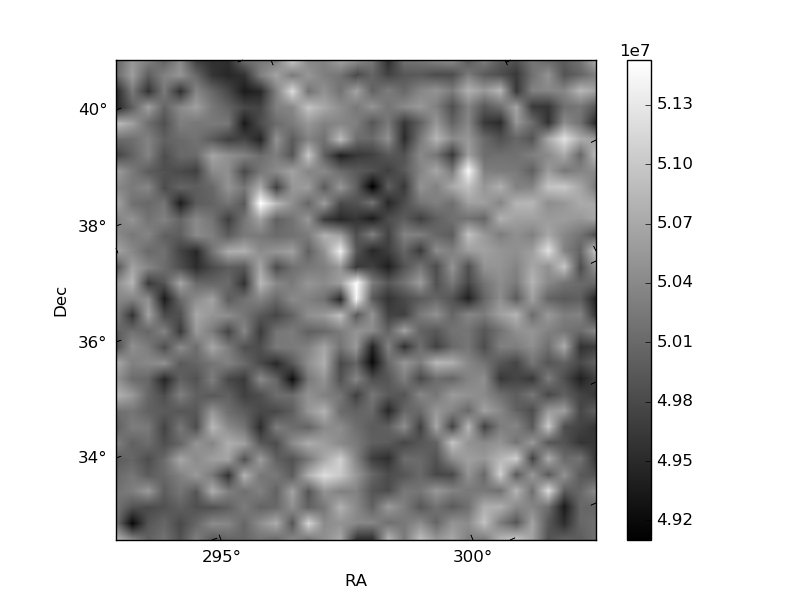
| Quadrant D | 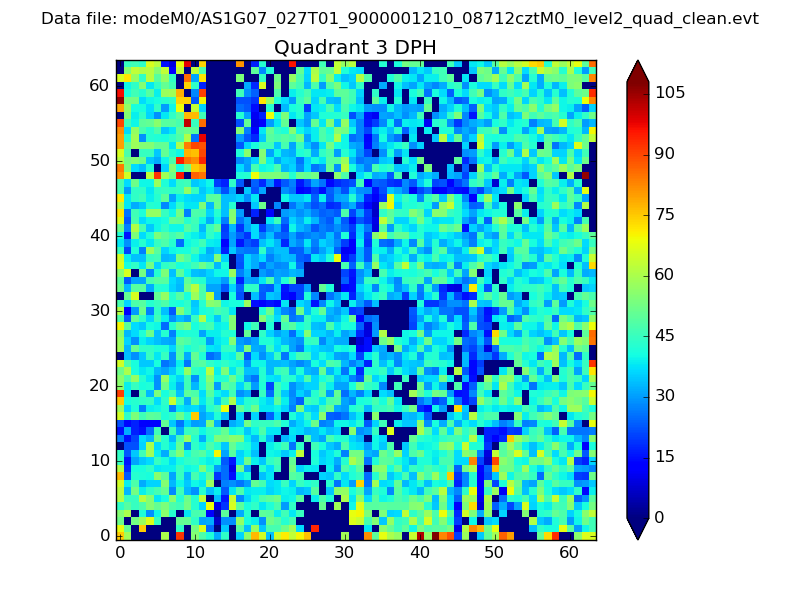 |
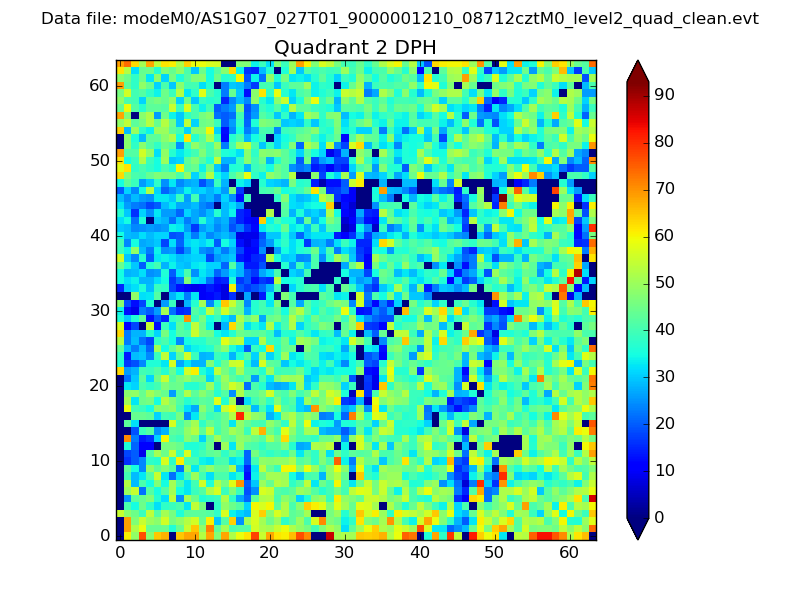 |
Quadrant C |
| Plot type | Count rate plots | Images |
|---|---|---|
| Comparison with Poisson distribution Blue bars denote a histogram of data divided into 1 sec bins. Red curve is a Poisson curve with rate = median count rate of data. |
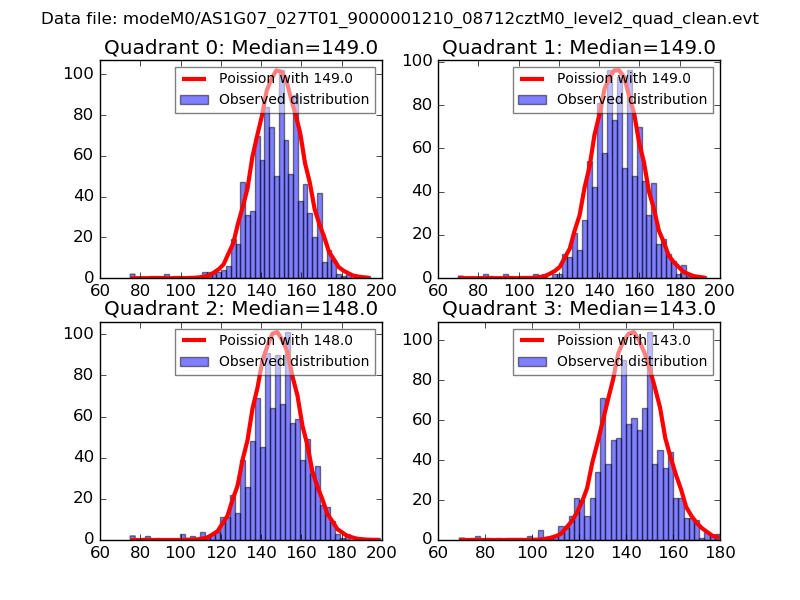 |
 |
| Quadrant-wise count rates Data is divided into 100 sec bins |
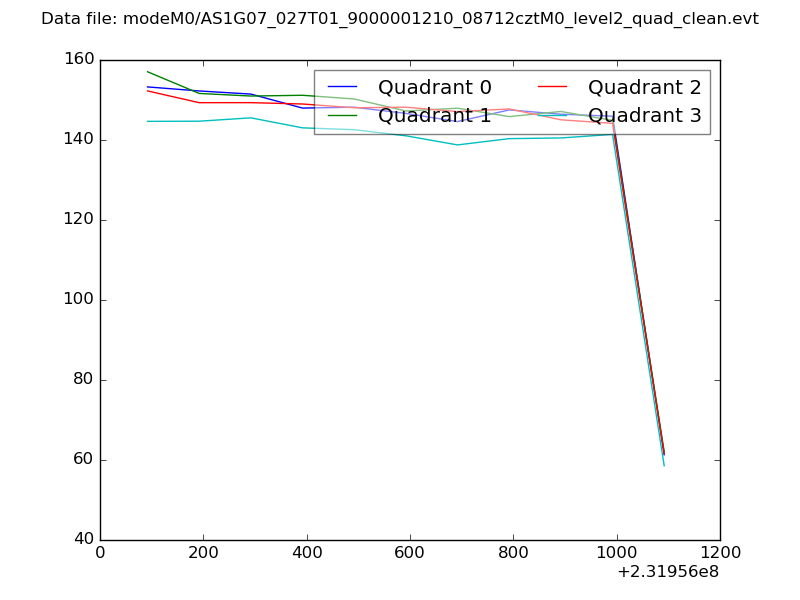 |
|
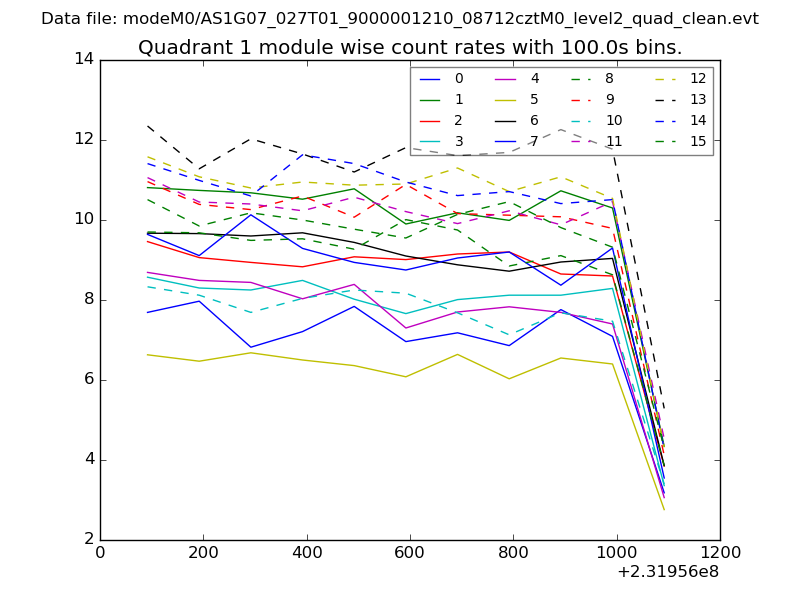
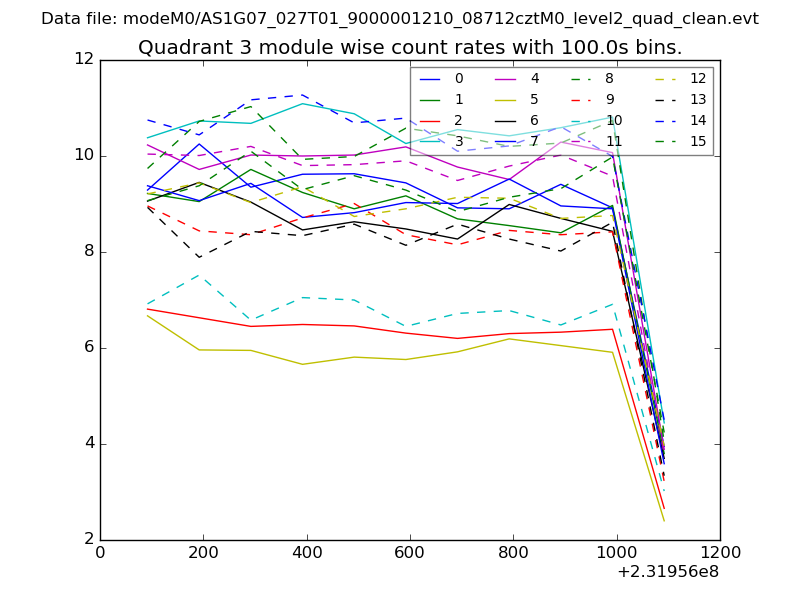
| Module-wise count rates for Quadrant A Data is divided into 100 sec bins |
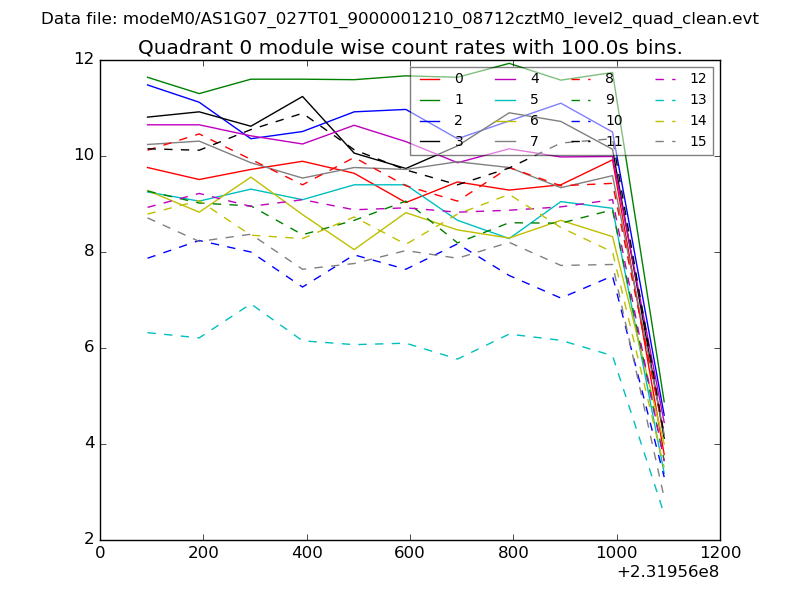 |
 |
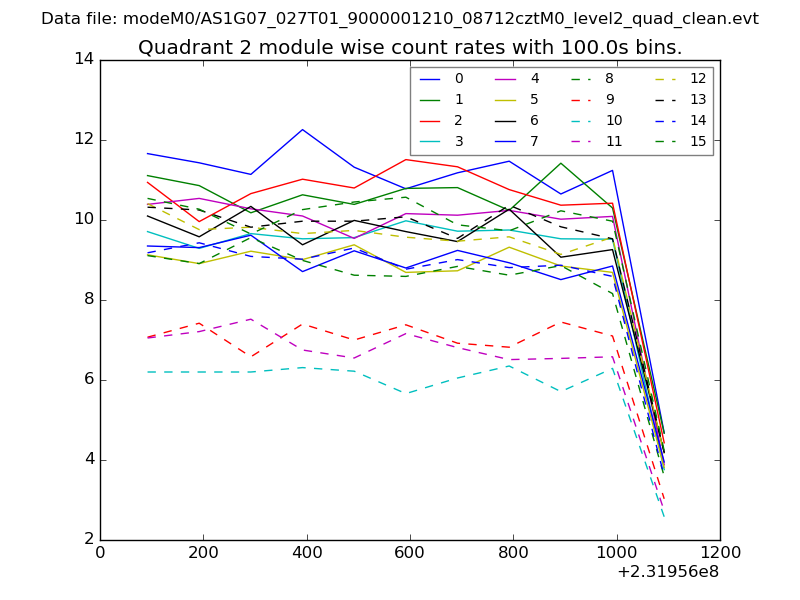
| Module-wise count rates for Quadrant B Data is divided into 100 sec bins |
 |
 |
| Module-wise count rates for Quadrant C Data is divided into 100 sec bins |
 |
 |
| Module-wise count rates for Quadrant D Data is divided into 100 sec bins |
 |
 |
| Parameter | Plot |
|---|---|
| CZT HV Monitor | 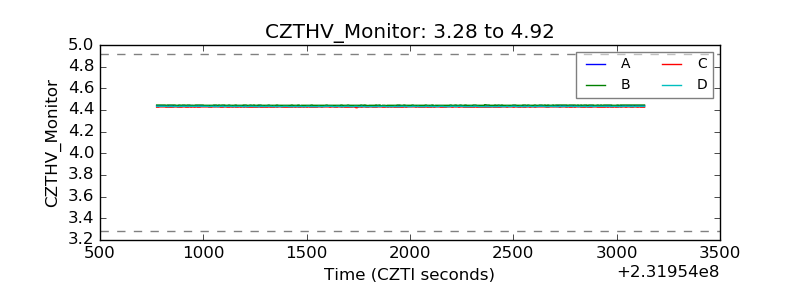 |
| D_VDD | 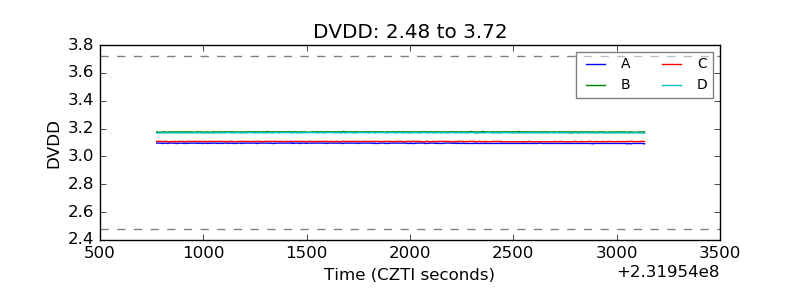 |
| Temperature 1 | 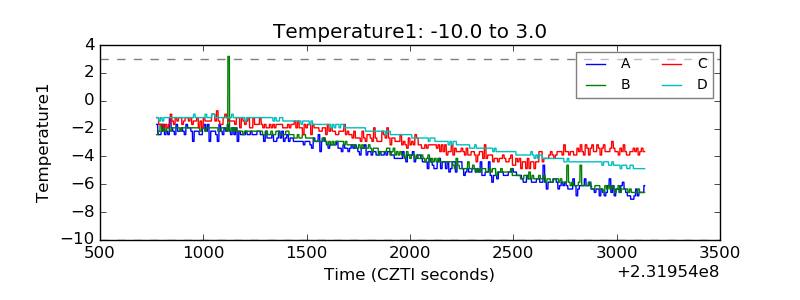 |
| Veto HV Monitor | 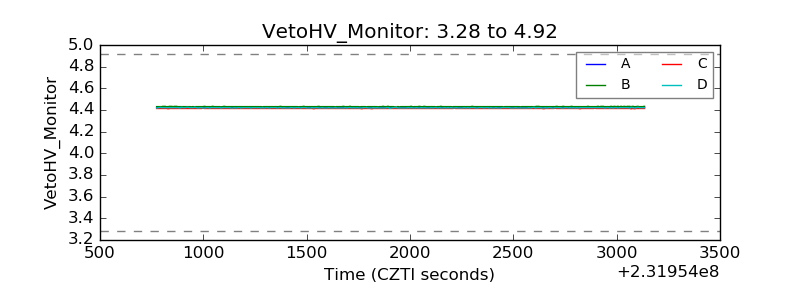 |
| Veto LLD |  |
| Alpha Counter | 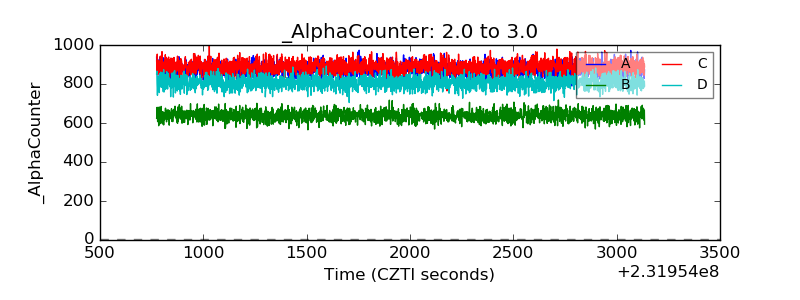 |
| _CPM_Rate | 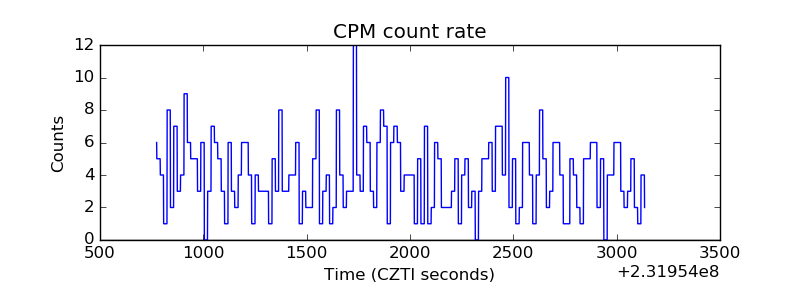 |
| CZT Counter | 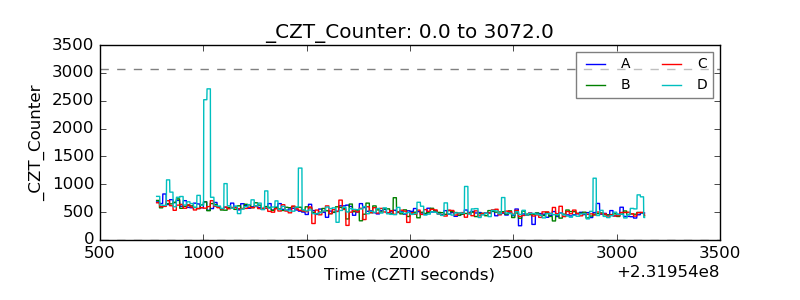 |
| +2.5 Volts monitor |  |
| +5 Volts monitor |  |
| _ROLL_ROT | 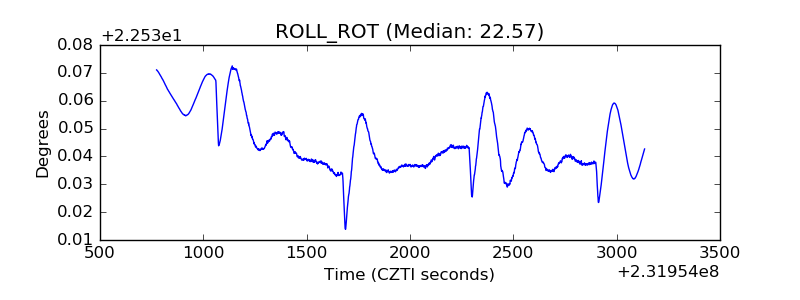 |
| _Roll_DEC |  |
| _Roll_RA | 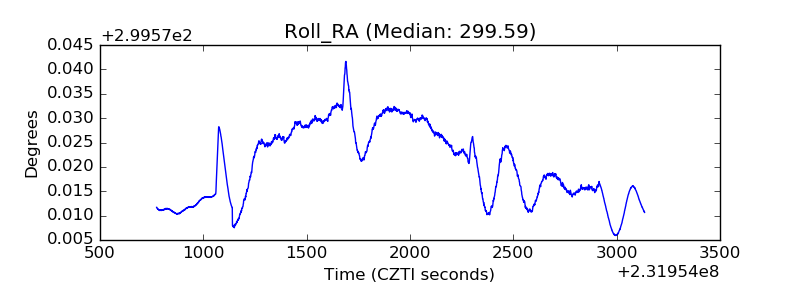 |
| Veto Counter | 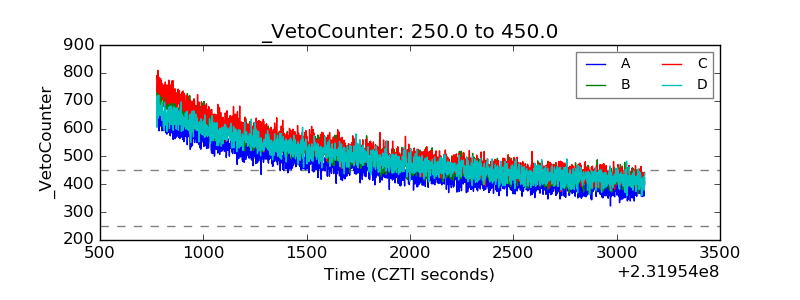 |