| Param | Original file | Final file |
|---|---|---|
| Filename | modeM0/AS1G07_005T02_9000001214cztM0_level2.fits | modeM0/AS1G07_005T02_9000001214cztM0_level2_quad_clean.evt |
| Size (bytes) | 179,634,240 | 245,367,360 |
| Size | 171.3 MB | 234.0 MB |
| Events in quadrant A | 1,073,842 | 1,586,253 |
| Events in quadrant B | 1,026,462 | 1,584,392 |
| Events in quadrant C | 1,043,512 | 1,485,640 |
| Events in quadrant D | 916,680 | 1,395,404 |
| Mode SS | |||
|---|---|---|---|
| Quadrant | BADHDUFLAG | Total packets | Discarded packets |
| A | 0 | 408 | 0 |
| B | 0 | 408 | 0 |
| C | 0 | 408 | 0 |
| D | 0 | 408 | 0 |
| Mode M9 | |||
|---|---|---|---|
| Quadrant | BADHDUFLAG | Total packets | Discarded packets |
| A | 0 | 28 | 0 |
| B | 0 | 28 | 0 |
| C | 0 | 28 | 0 |
| D | 0 | 28 | 0 |
| Mode M0 | |||
|---|---|---|---|
| Quadrant | BADHDUFLAG | Total packets | Discarded packets |
| A | 0 | 41391 | 0 |
| B | 0 | 41680 | 0 |
| C | 0 | 44954 | 0 |
| D | 0 | 43059 | 0 |
| Quadrant | Total seconds | Saturated seconds | Saturation percentage |
|---|---|---|---|
| A | 20034 | 220 | 1.098133% |
| B | 20034 | 230 | 1.148048% |
| C | 20034 | 454 | 2.266148% |
| D | 20034 | 234 | 1.168014% |
Noise dominated data is calculated using 1-second bins in cleaned event files. If a bin has >2000 counts, and if more than 50% of those come from <1% of pixels, then it is considered to be noise-dominated and hence unusable.
| Quadrant | # 1 sec bins | Bins with >0 counts | Bins with >2000 counts | High rate bins dominated by noise | Noise dominated (total time) | Noise dominated (detector-on time) | Marked lightcurve |
|---|---|---|---|---|---|---|---|
| A | 22849 | 20031 | 0 | 0 | 0.00% | 0.00% | 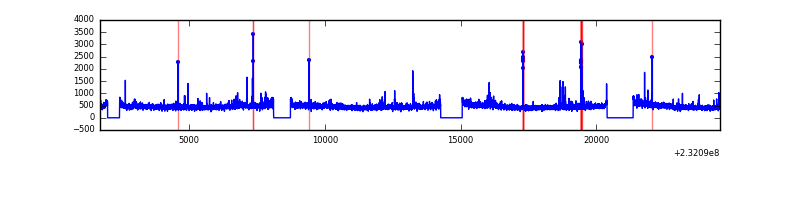 |
| B | 22849 | 20029 | 0 | 0 | 0.00% | 0.00% |  |
| C | 22849 | 20029 | 0 | 0 | 0.00% | 0.00% |  |
| D | 22849 | 20031 | 0 | 0 | 0.00% | 0.00% |  |
Top three noisy pixels from each quadrant. If the there are fewer than three noisy pixels in the level2.evt file, extra rows are filled as -1
| Pixel properties | Quadrant properties | ||||||
|---|---|---|---|---|---|---|---|
| Quadrant | DetID | PixID | Counts | Sigma | Mean | Median | Sigma |
| A | 0 | 29 | 1077 | 11.41 | 278 | 260 | 71.6 |
| A | 14 | 188 | 1076 | 11.39 | 278 | 260 | 71.6 |
| A | 14 | 204 | 927 | 9.31 | 278 | 260 | 71.6 |
| B | 2 | 9 | 913 | 11.67 | 271 | 258 | 56.1 |
| B | 2 | 8 | 721 | 8.25 | 271 | 258 | 56.1 |
| B | 3 | 17 | 702 | 7.91 | 271 | 258 | 56.1 |
| C | 1 | 80 | 814 | 7.52 | 275 | 255 | 74.3 |
| C | 1 | 81 | 754 | 6.71 | 275 | 255 | 74.3 |
| C | 2 | 191 | 734 | 6.44 | 275 | 255 | 74.3 |
| D | 1 | 3 | 693 | 6.49 | 260 | 237 | 70.2 |
| D | 1 | 19 | 677 | 6.27 | 260 | 237 | 70.2 |
| D | 3 | 31 | 668 | 6.14 | 260 | 237 | 70.2 |
Histogram calculated using DETX and DETY for each event in the final _common_clean file
| Quadrant A | 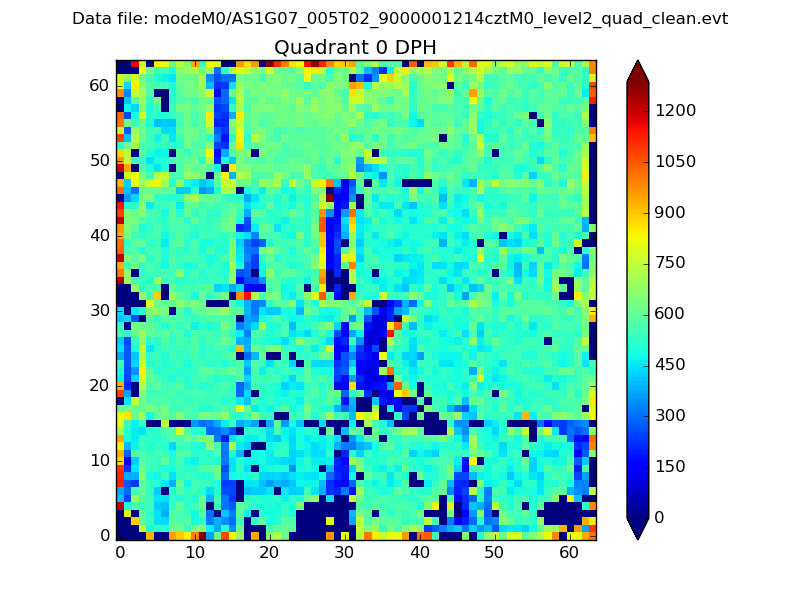 |
 |
Quadrant B |
|---|---|---|---|
| Quadrant D |  |
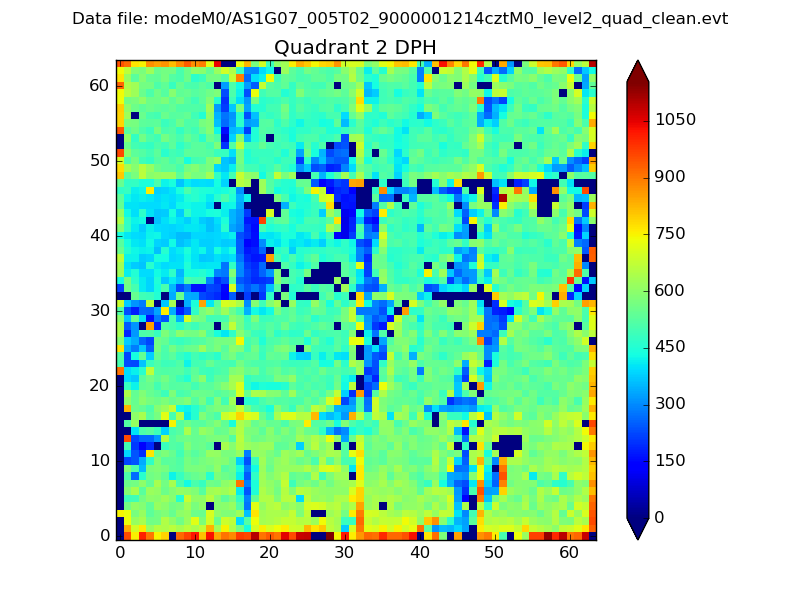 |
Quadrant C |
| Plot type | Count rate plots | Images |
|---|---|---|
| Comparison with Poisson distribution Blue bars denote a histogram of data divided into 1 sec bins. Red curve is a Poisson curve with rate = median count rate of data. |
 |
 |
| Quadrant-wise count rates Data is divided into 100 sec bins |
 |
|
| Module-wise count rates for Quadrant A Data is divided into 100 sec bins |
 |
 |
| Module-wise count rates for Quadrant B Data is divided into 100 sec bins |
 |
 |
| Module-wise count rates for Quadrant C Data is divided into 100 sec bins |
 |
 |
| Module-wise count rates for Quadrant D Data is divided into 100 sec bins |
 |
 |
| Parameter | Plot |
|---|---|
| CZT HV Monitor | 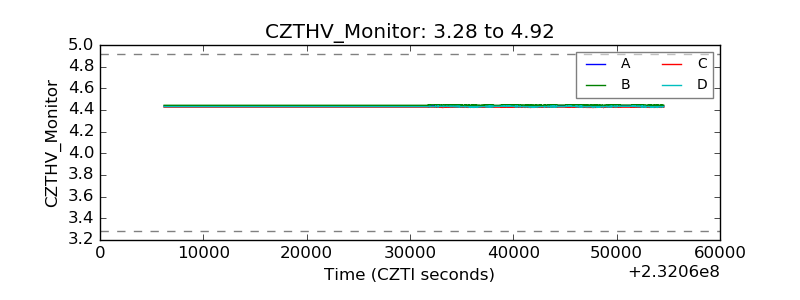 |
| D_VDD |  |
| Temperature 1 |  |
| Veto HV Monitor |  |
| Veto LLD |  |
| Alpha Counter |  |
| _CPM_Rate |  |
| CZT Counter | 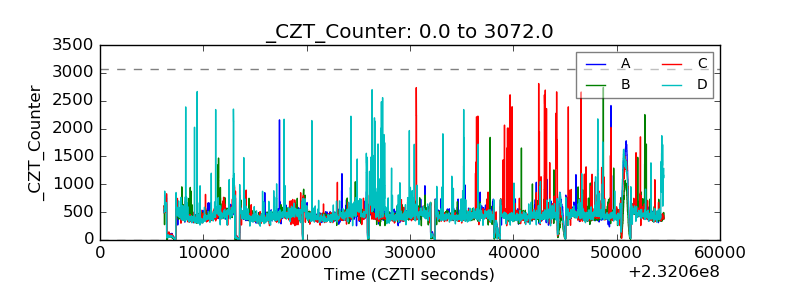 |
| +2.5 Volts monitor |  |
| +5 Volts monitor |  |
| _ROLL_ROT | 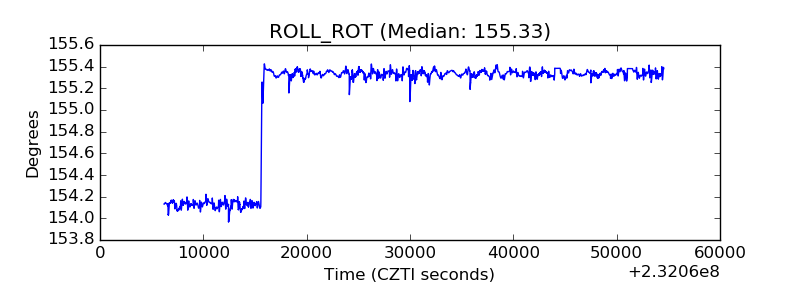 |
| _Roll_DEC |  |
| _Roll_RA | 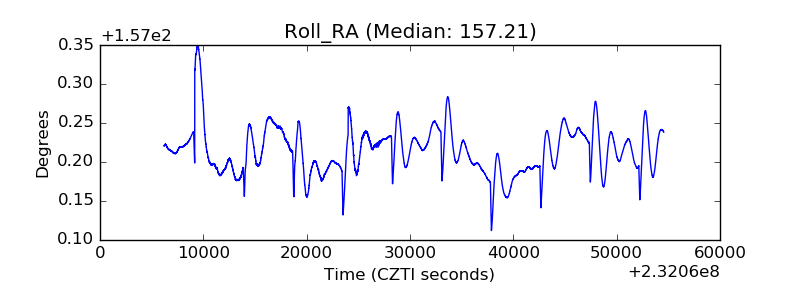 |
| Veto Counter |  |