| Param | Original file | Final file |
|---|---|---|
| Filename | modeM0/AS1G07_005T02_9000001214_08731cztM0_level2.evt | modeM0/AS1G07_005T02_9000001214_08731cztM0_level2_quad_clean.evt |
| Size (bytes) | 479,603,520 | 120,412,800 |
| Size | 457.4 MB | 114.8 MB |
| Events in quadrant A | 3,399,582 | 782,324 |
| Events in quadrant B | 3,554,080 | 793,655 |
| Events in quadrant C | 3,383,436 | 790,324 |
| Events in quadrant D | 3,678,514 | 759,421 |
| Mode SS | |||
|---|---|---|---|
| Quadrant | BADHDUFLAG | Total packets | Discarded packets |
| A | 0 | 154 | 0 |
| B | 0 | 154 | 0 |
| C | 0 | 154 | 0 |
| D | 0 | 154 | 0 |
| Mode M9 | |||
|---|---|---|---|
| Quadrant | BADHDUFLAG | Total packets | Discarded packets |
| A | 0 | 13 | 0 |
| B | 0 | 13 | 0 |
| C | 0 | 13 | 0 |
| D | 0 | 13 | 0 |
| Mode M0 | |||
|---|---|---|---|
| Quadrant | BADHDUFLAG | Total packets | Discarded packets |
| A | 0 | 15493 | 4 |
| B | 0 | 15858 | 3 |
| C | 0 | 15533 | 3 |
| D | 0 | 16493 | 3 |
| Quadrant | Total seconds | Saturated seconds | Saturation percentage |
|---|---|---|---|
| A | 7492 | 34 | 0.453817% |
| B | 7492 | 68 | 0.907635% |
| C | 7492 | 44 | 0.587293% |
| D | 7492 | 94 | 1.254672% |
Noise dominated data is calculated using 1-second bins in cleaned event files. If a bin has >2000 counts, and if more than 50% of those come from <1% of pixels, then it is considered to be noise-dominated and hence unusable.
| Quadrant | # 1 sec bins | Bins with >0 counts | Bins with >2000 counts | High rate bins dominated by noise | Noise dominated (total time) | Noise dominated (detector-on time) | Marked lightcurve |
|---|---|---|---|---|---|---|---|
| A | 8827 | 7495 | 0 | 0 | 0.00% | 0.00% | 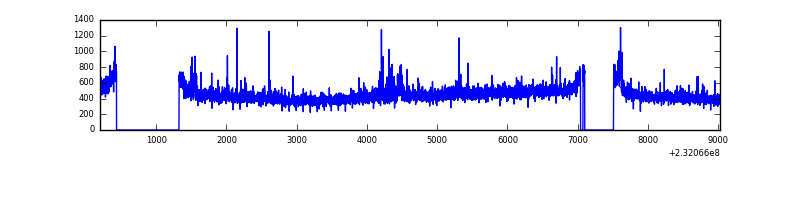 |
| B | 8827 | 7495 | 5 | 5 | 0.06% | 0.07% | 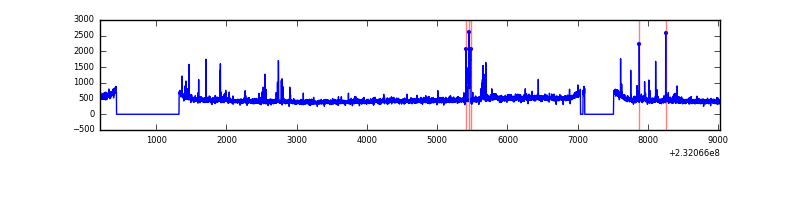 |
| C | 8827 | 7495 | 1 | 1 | 0.01% | 0.01% | 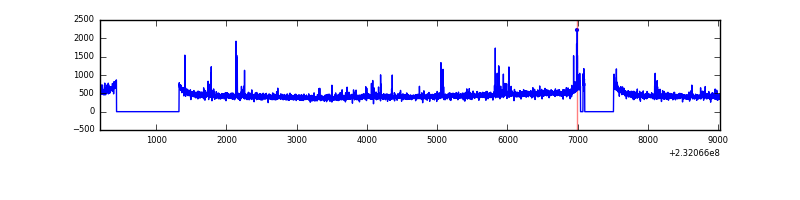 |
| D | 8827 | 7495 | 64 | 64 | 0.73% | 0.85% |  |
Top three noisy pixels from each quadrant. If the there are fewer than three noisy pixels in the level2.evt file, extra rows are filled as -1
| Pixel properties | Quadrant properties | ||||||
|---|---|---|---|---|---|---|---|
| Quadrant | DetID | PixID | Counts | Sigma | Mean | Median | Sigma |
| A | 13 | 251 | 102669 | 589.52 | 851 | 829 | 172.8 |
| A | 15 | 236 | 8632 | 45.17 | 851 | 829 | 172.8 |
| A | 0 | 226 | 7877 | 40.8 | 851 | 829 | 172.8 |
| B | 5 | 255 | 78624 | 477.15 | 864 | 842 | 163.0 |
| B | 4 | 48 | 47095 | 283.73 | 864 | 842 | 163.0 |
| B | 0 | 214 | 25035 | 148.41 | 864 | 842 | 163.0 |
| C | 1 | 3 | 29638 | 148.42 | 841 | 844 | 194.0 |
| C | 1 | 16 | 26468 | 132.08 | 841 | 844 | 194.0 |
| C | 14 | 234 | 22582 | 112.05 | 841 | 844 | 194.0 |
| D | 1 | 52 | 177090 | 810.74 | 824 | 803 | 217.4 |
| D | 7 | 71 | 173230 | 792.99 | 824 | 803 | 217.4 |
| D | 2 | 152 | 53958 | 244.46 | 824 | 803 | 217.4 |
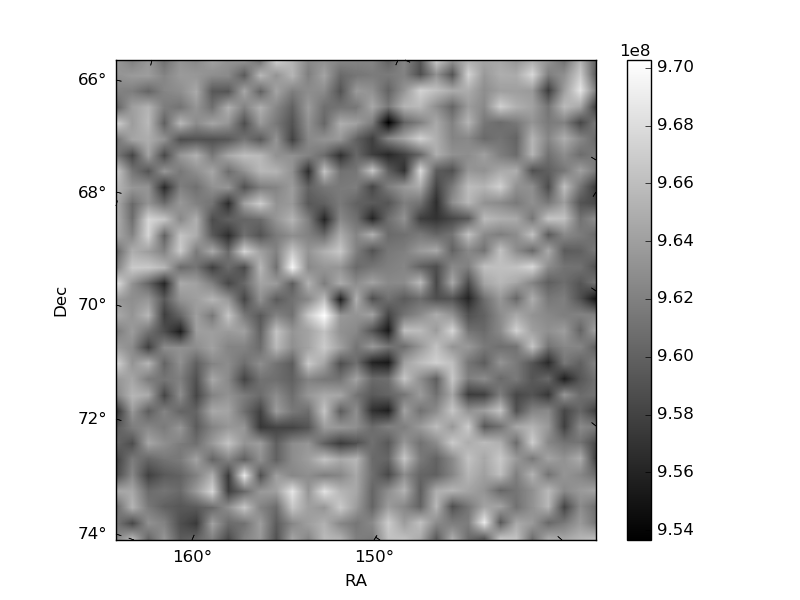
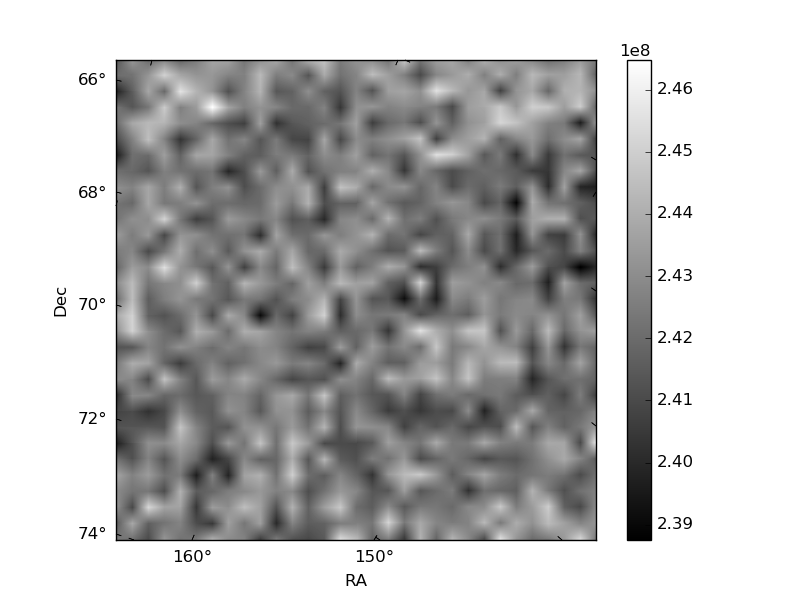
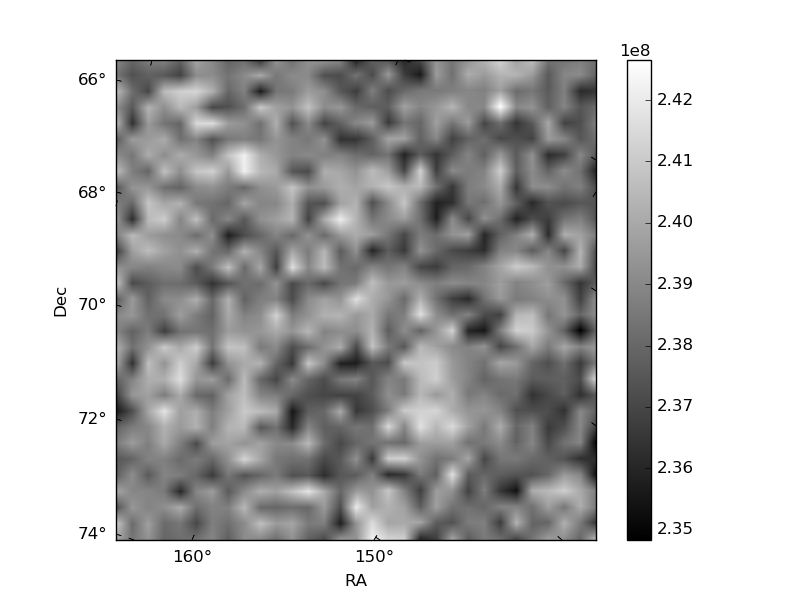
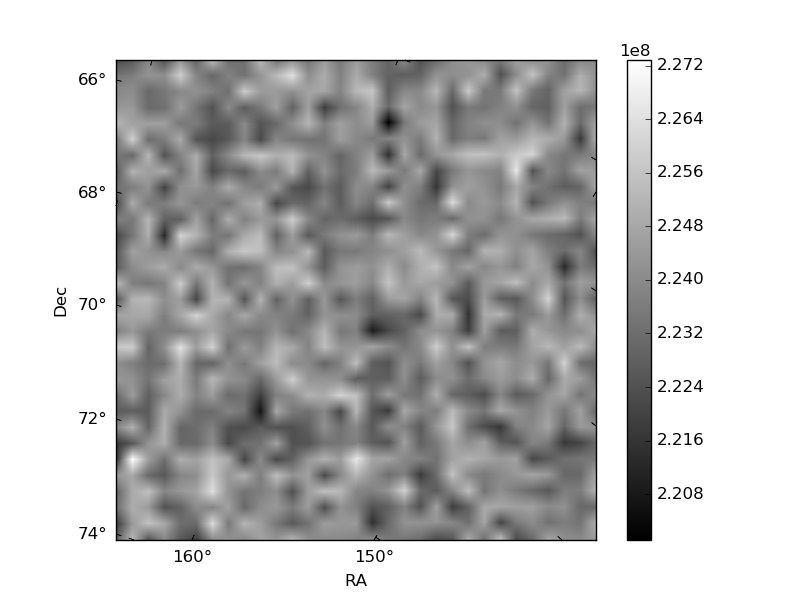
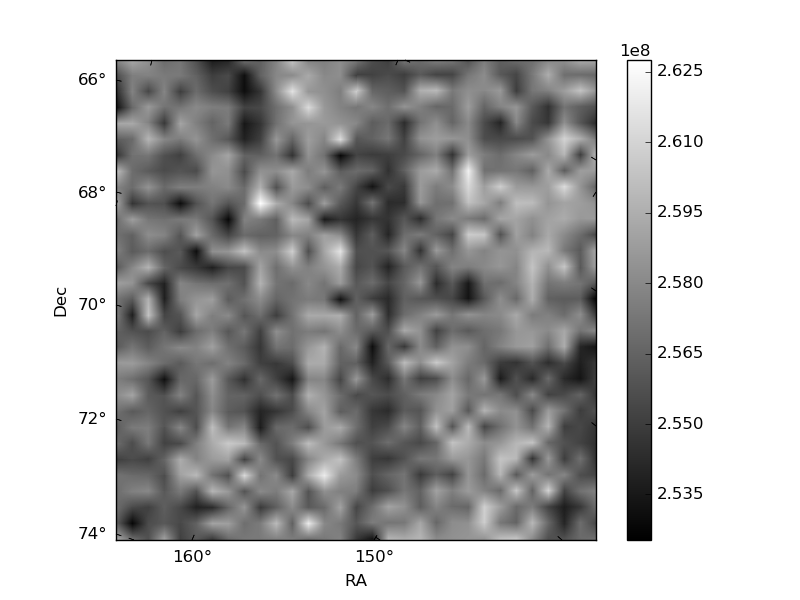
Histogram calculated using DETX and DETY for each event in the final _common_clean file
| Quadrant A | 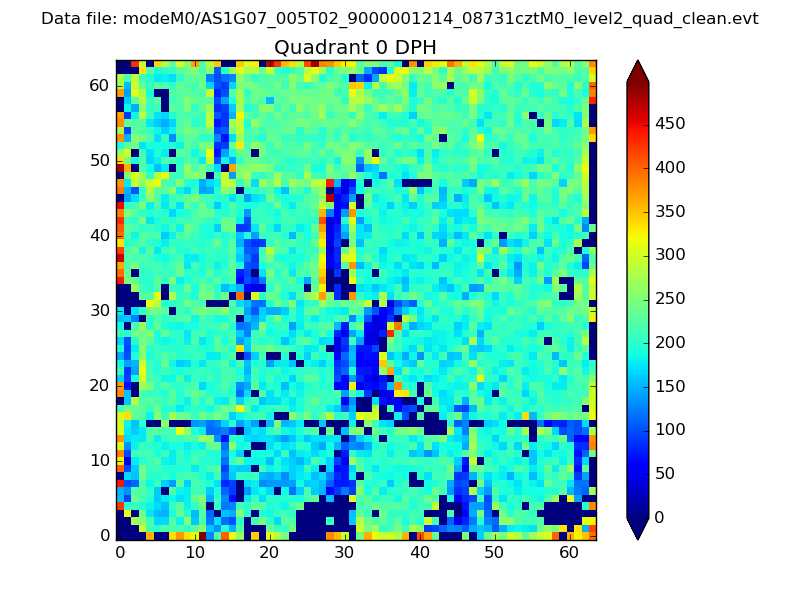 |
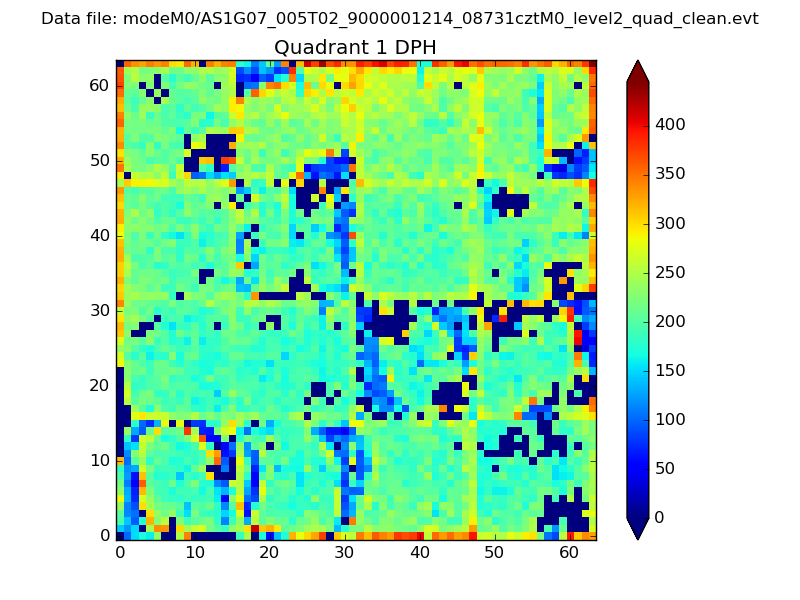 |
Quadrant B |
|---|---|---|---|
| Quadrant D | 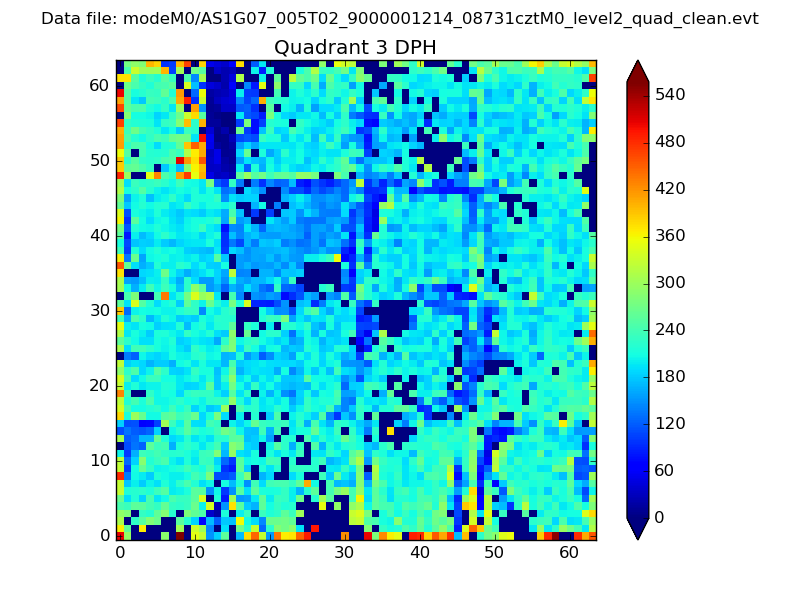 |
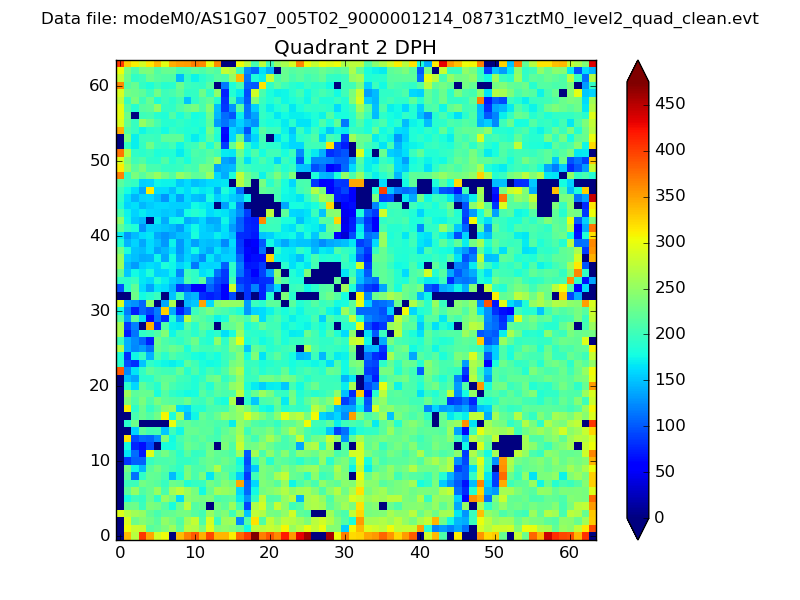 |
Quadrant C |
| Plot type | Count rate plots | Images |
|---|---|---|
| Comparison with Poisson distribution Blue bars denote a histogram of data divided into 1 sec bins. Red curve is a Poisson curve with rate = median count rate of data. |
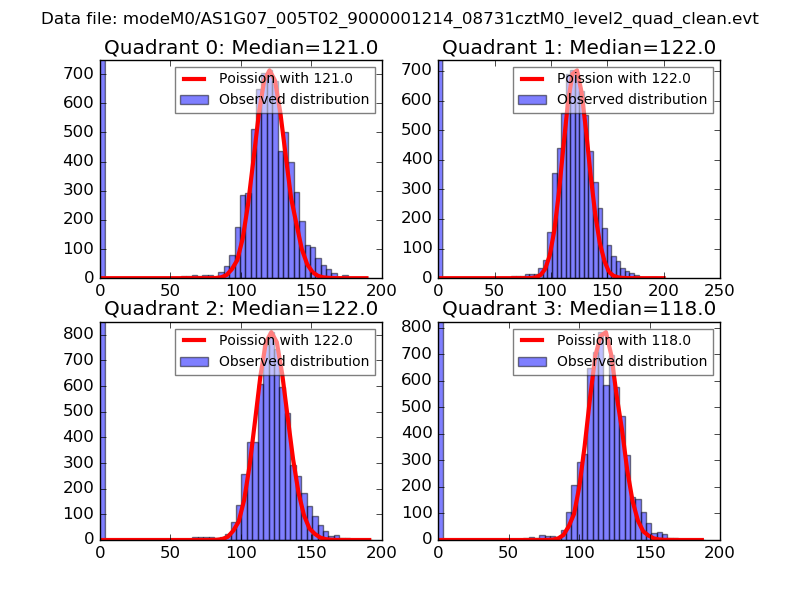 |
 |
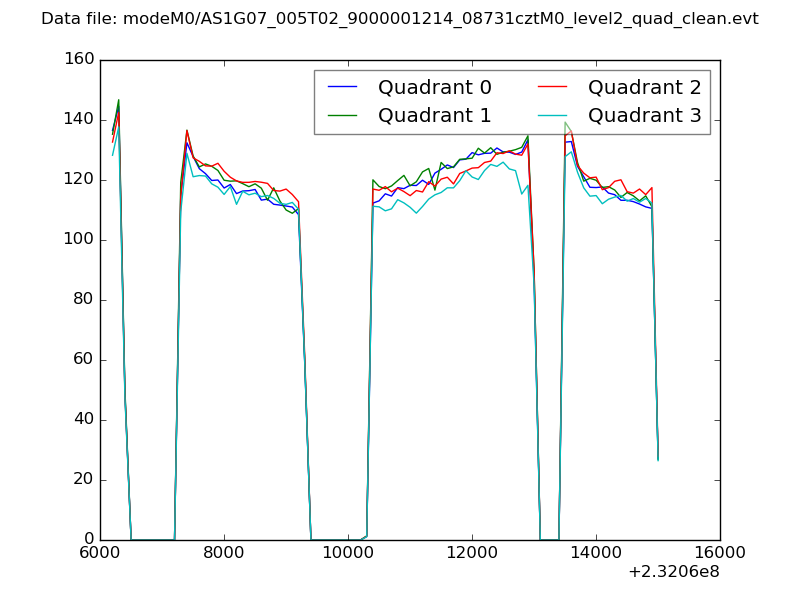
| Quadrant-wise count rates Data is divided into 100 sec bins |
 |
|
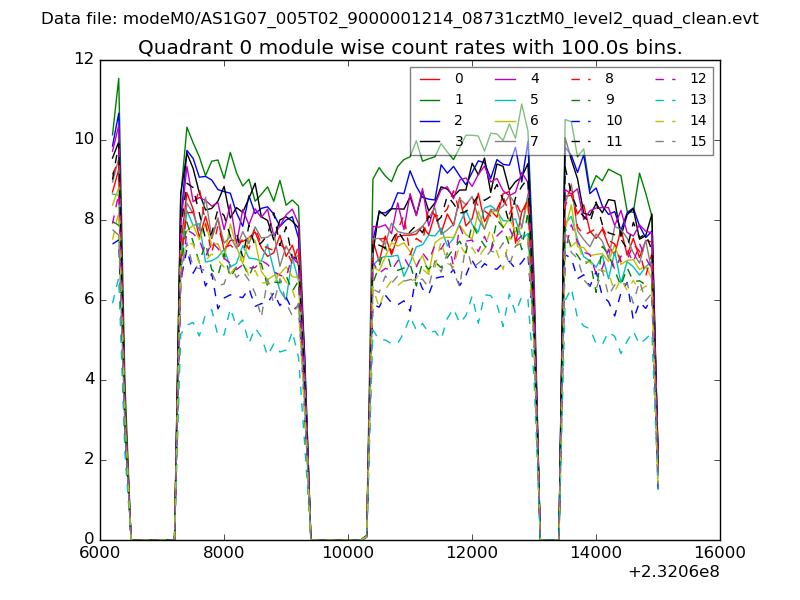
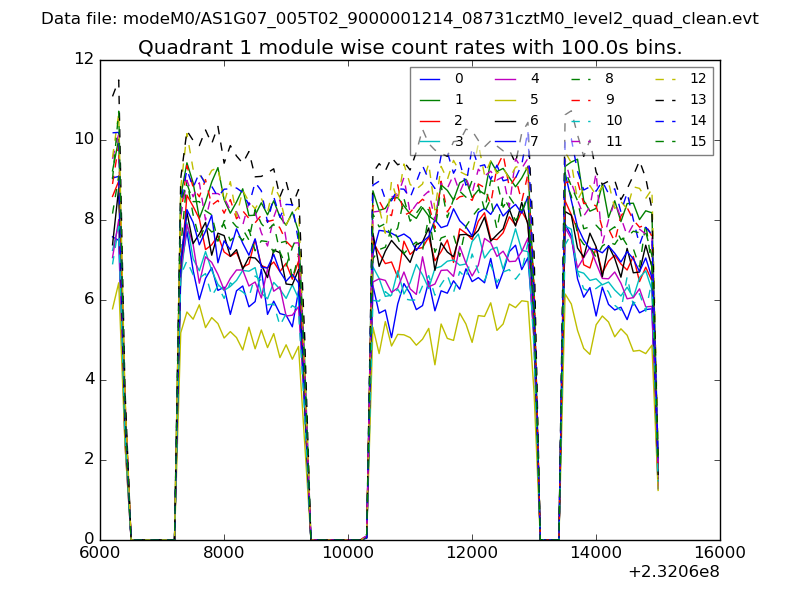
| Module-wise count rates for Quadrant A Data is divided into 100 sec bins |
 |
 |
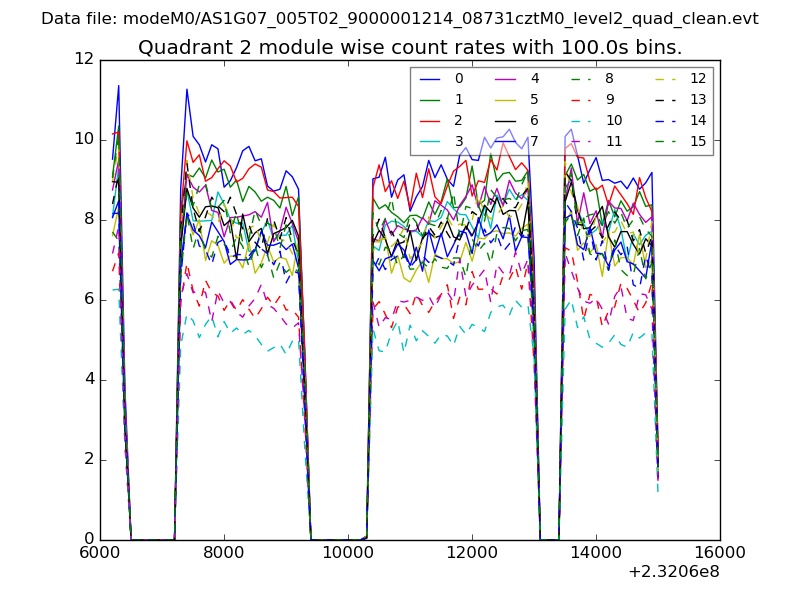
| Module-wise count rates for Quadrant B Data is divided into 100 sec bins |
 |
 |
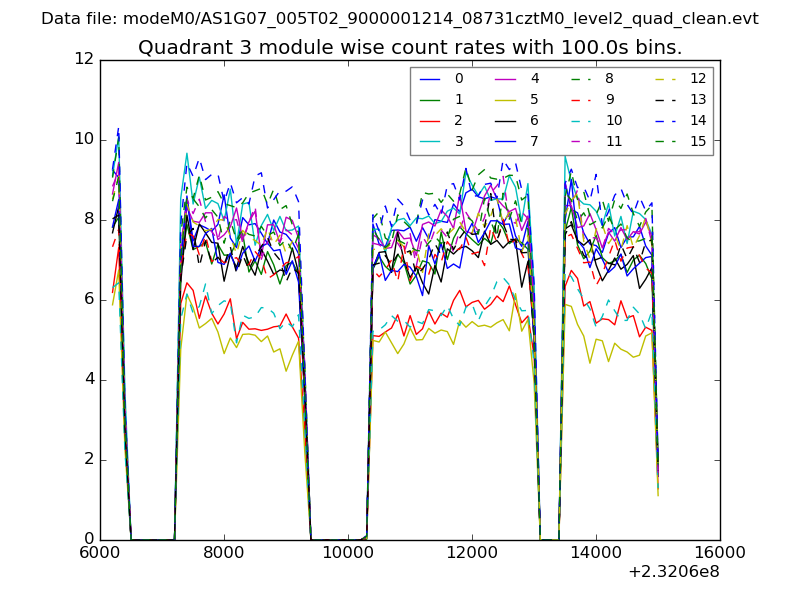
| Module-wise count rates for Quadrant C Data is divided into 100 sec bins |
 |
 |
| Module-wise count rates for Quadrant D Data is divided into 100 sec bins |
 |
 |
| Parameter | Plot |
|---|---|
| CZT HV Monitor | 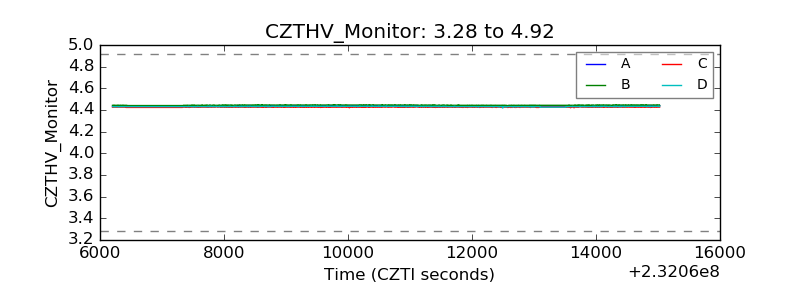 |
| D_VDD | 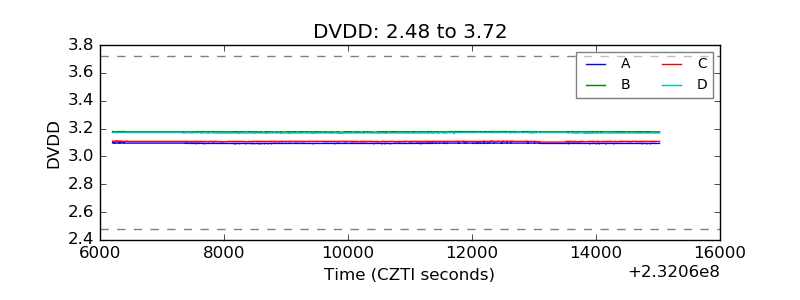 |
| Temperature 1 |  |
| Veto HV Monitor | 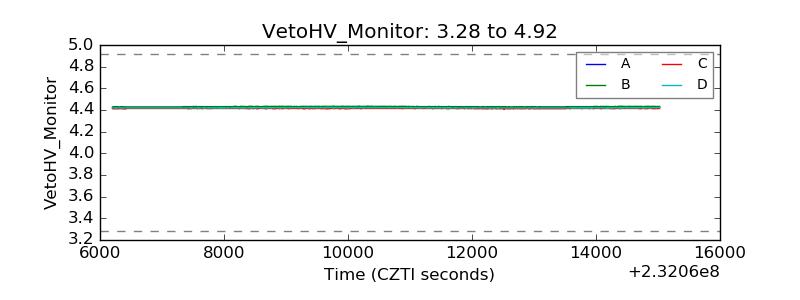 |
| Veto LLD | 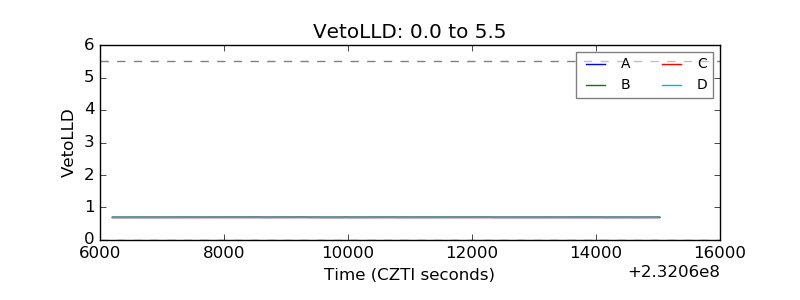 |
| Alpha Counter | 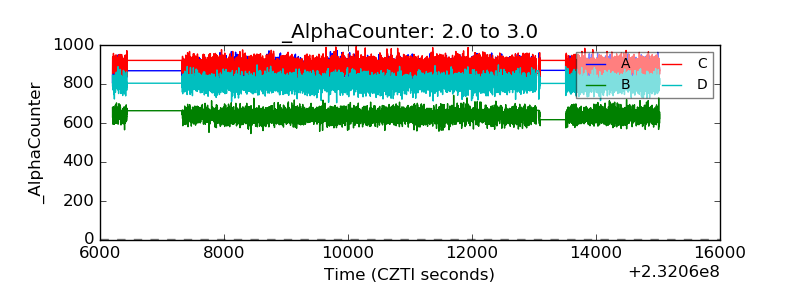 |
| _CPM_Rate | 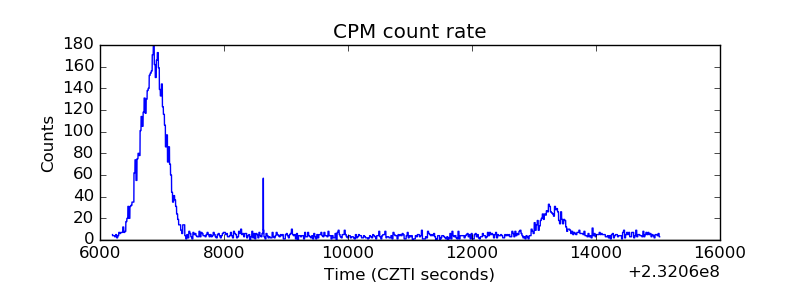 |
| CZT Counter | 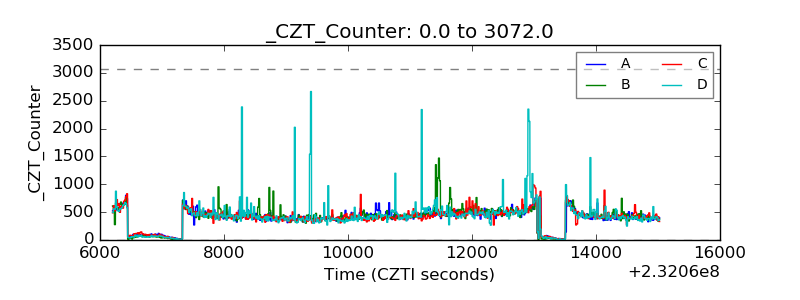 |
| +2.5 Volts monitor |  |
| +5 Volts monitor |  |
| _ROLL_ROT | 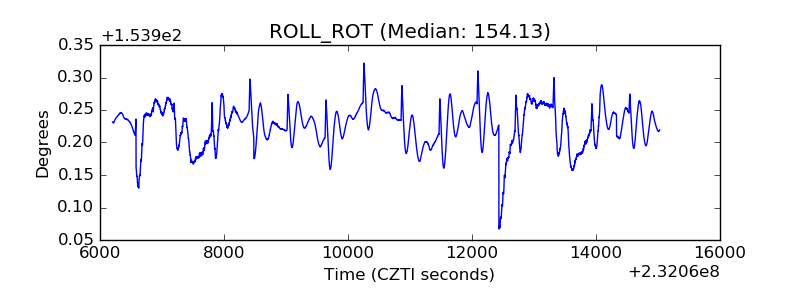 |
| _Roll_DEC | 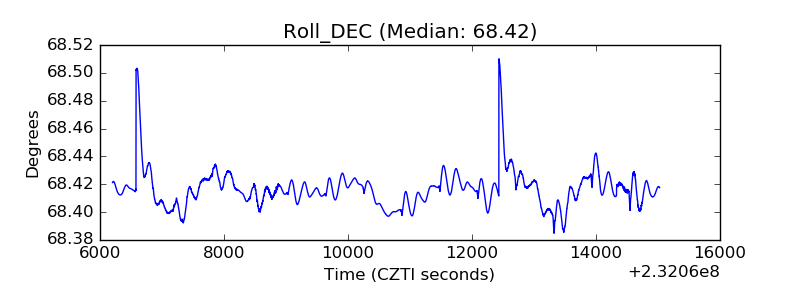 |
| _Roll_RA | 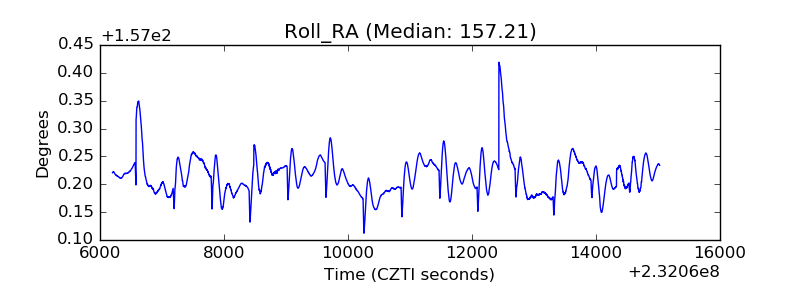 |
| Veto Counter | 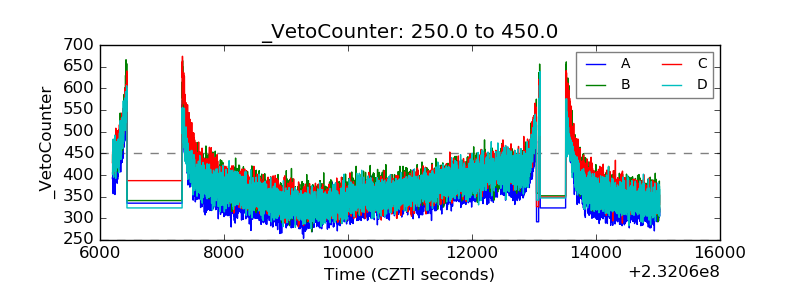 |