| Param | Original file | Final file |
|---|---|---|
| Filename | modeM0/AS1G07_005T02_9000001214_08732cztM0_level2.evt | modeM0/AS1G07_005T02_9000001214_08732cztM0_level2_quad_clean.evt |
| Size (bytes) | 544,371,840 | 132,992,640 |
| Size | 519.2 MB | 126.8 MB |
| Events in quadrant A | 3,906,699 | 858,796 |
| Events in quadrant B | 4,027,078 | 872,688 |
| Events in quadrant C | 3,874,304 | 865,417 |
| Events in quadrant D | 4,096,521 | 836,473 |
| Mode SS | |||
|---|---|---|---|
| Quadrant | BADHDUFLAG | Total packets | Discarded packets |
| A | 0 | 176 | 0 |
| B | 0 | 176 | 0 |
| C | 0 | 176 | 0 |
| D | 0 | 176 | 0 |
| Mode M9 | |||
|---|---|---|---|
| Quadrant | BADHDUFLAG | Total packets | Discarded packets |
| A | 0 | 5 | 0 |
| B | 0 | 5 | 0 |
| C | 0 | 5 | 0 |
| D | 0 | 5 | 0 |
| Mode M0 | |||
|---|---|---|---|
| Quadrant | BADHDUFLAG | Total packets | Discarded packets |
| A | 0 | 17755 | 4 |
| B | 0 | 17937 | 3 |
| C | 0 | 17747 | 3 |
| D | 0 | 18497 | 3 |
| Quadrant | Total seconds | Saturated seconds | Saturation percentage |
|---|---|---|---|
| A | 8559 | 111 | 1.296880% |
| B | 8559 | 146 | 1.705807% |
| C | 8559 | 77 | 0.899638% |
| D | 8559 | 91 | 1.063208% |
Noise dominated data is calculated using 1-second bins in cleaned event files. If a bin has >2000 counts, and if more than 50% of those come from <1% of pixels, then it is considered to be noise-dominated and hence unusable.
| Quadrant | # 1 sec bins | Bins with >0 counts | Bins with >2000 counts | High rate bins dominated by noise | Noise dominated (total time) | Noise dominated (detector-on time) | Marked lightcurve |
|---|---|---|---|---|---|---|---|
| A | 9054 | 8562 | 3 | 3 | 0.03% | 0.04% | 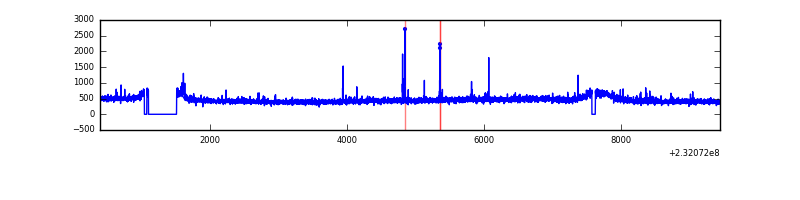 |
| B | 9054 | 8562 | 2 | 2 | 0.02% | 0.02% | 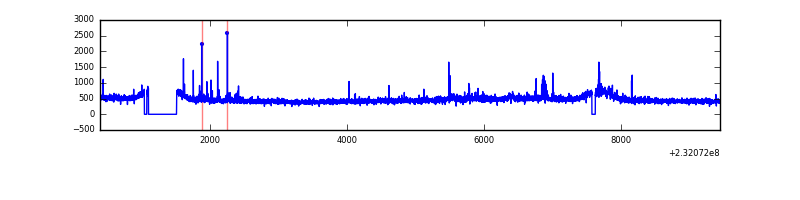 |
| C | 9054 | 8562 | 2 | 2 | 0.02% | 0.02% | 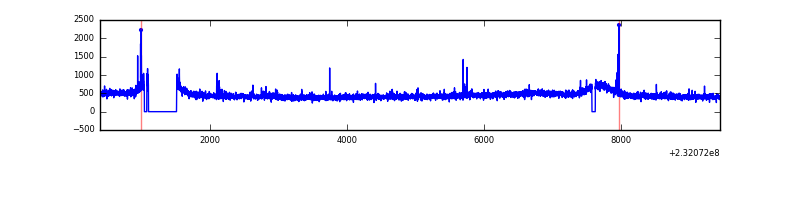 |
| D | 9054 | 8562 | 42 | 42 | 0.46% | 0.49% | 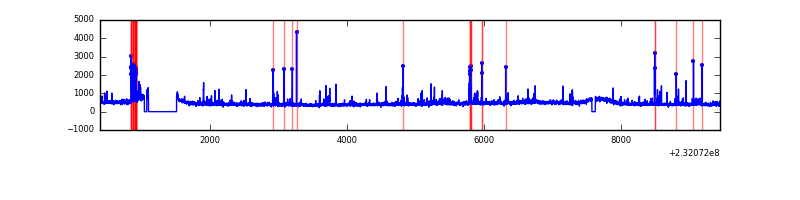 |
Top three noisy pixels from each quadrant. If the there are fewer than three noisy pixels in the level2.evt file, extra rows are filled as -1
| Pixel properties | Quadrant properties | ||||||
|---|---|---|---|---|---|---|---|
| Quadrant | DetID | PixID | Counts | Sigma | Mean | Median | Sigma |
| A | 13 | 251 | 81612 | 403.05 | 982 | 957 | 200.1 |
| A | 13 | 248 | 17590 | 83.12 | 982 | 957 | 200.1 |
| A | 15 | 174 | 16850 | 79.42 | 982 | 957 | 200.1 |
| B | 4 | 48 | 21801 | 109.98 | 999 | 972 | 189.4 |
| B | 0 | 197 | 20665 | 103.98 | 999 | 972 | 189.4 |
| B | 12 | 111 | 19564 | 98.17 | 999 | 972 | 189.4 |
| C | 1 | 3 | 32822 | 142.19 | 973 | 973 | 224.0 |
| C | 14 | 234 | 12439 | 51.19 | 973 | 973 | 224.0 |
| C | 1 | 16 | 11658 | 47.7 | 973 | 973 | 224.0 |
| D | 7 | 71 | 173570 | 676.89 | 957 | 933 | 255.0 |
| D | 1 | 52 | 72250 | 279.62 | 957 | 933 | 255.0 |
| D | 2 | 152 | 59516 | 229.7 | 957 | 933 | 255.0 |
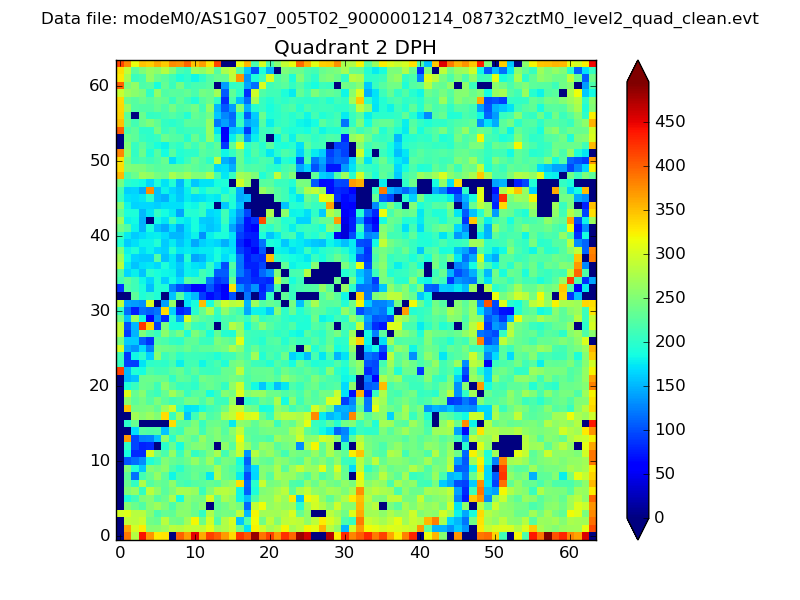
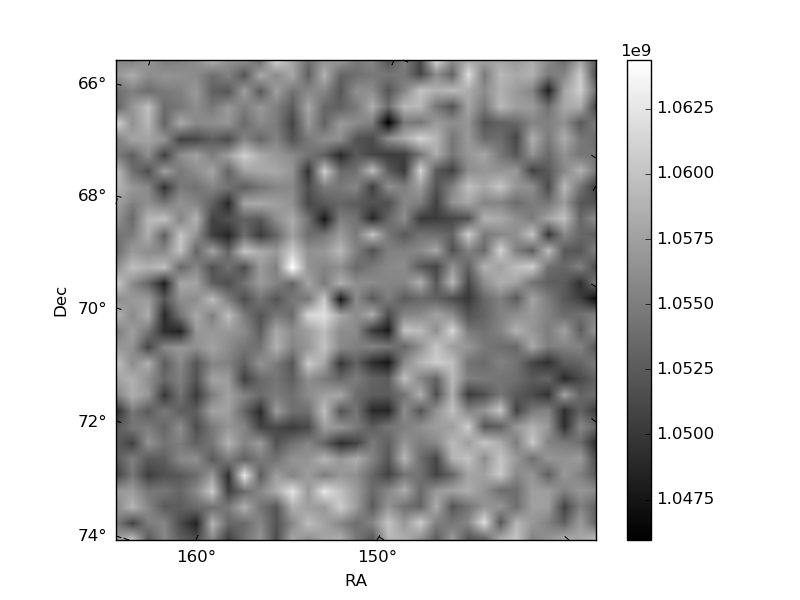
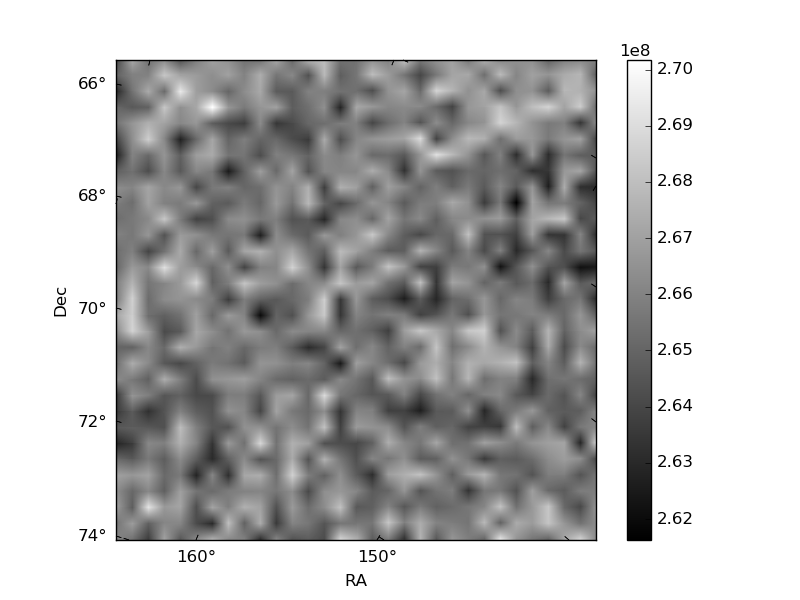
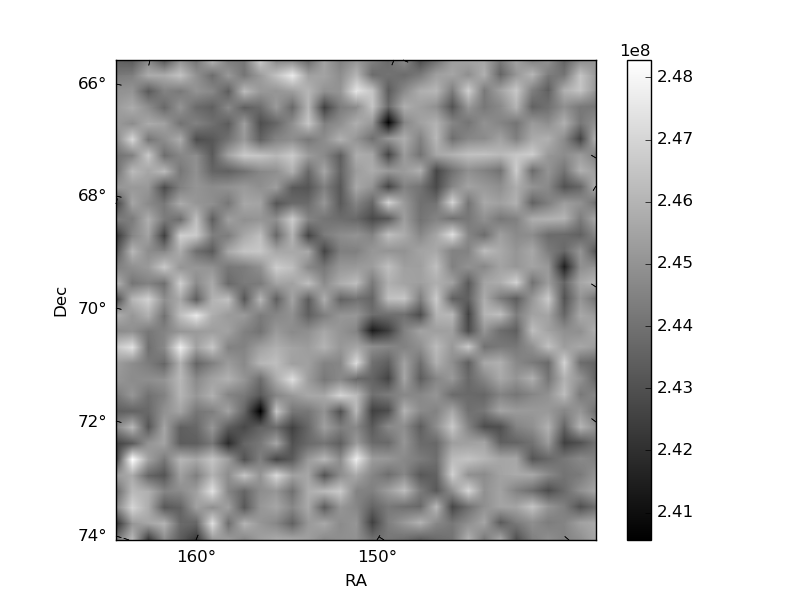
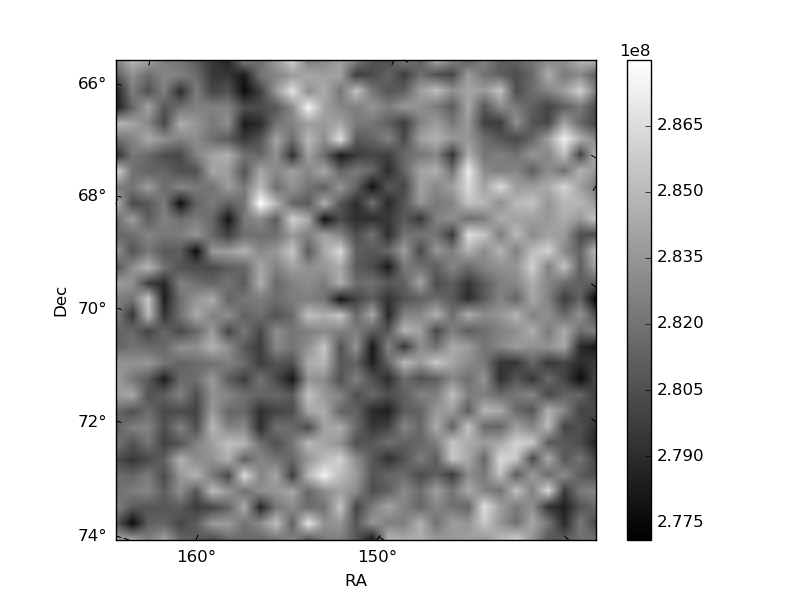
Histogram calculated using DETX and DETY for each event in the final _common_clean file
| Quadrant A | 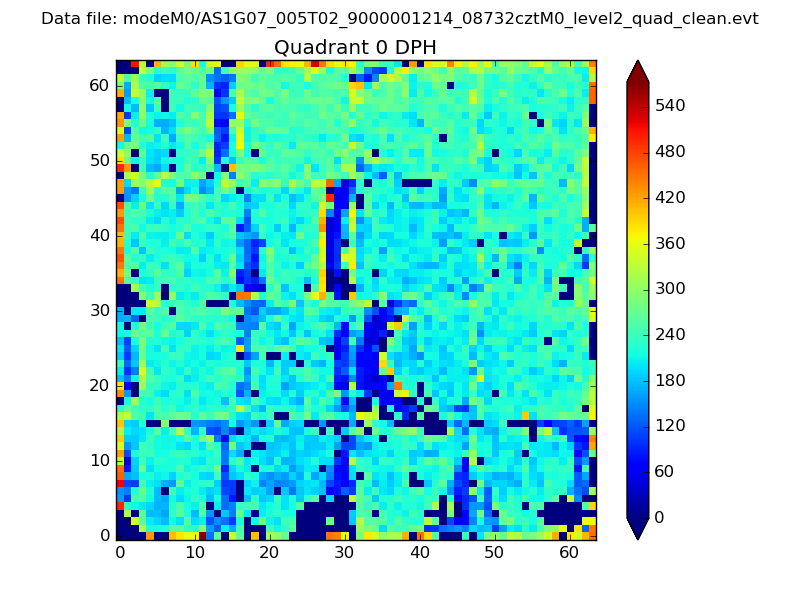 |
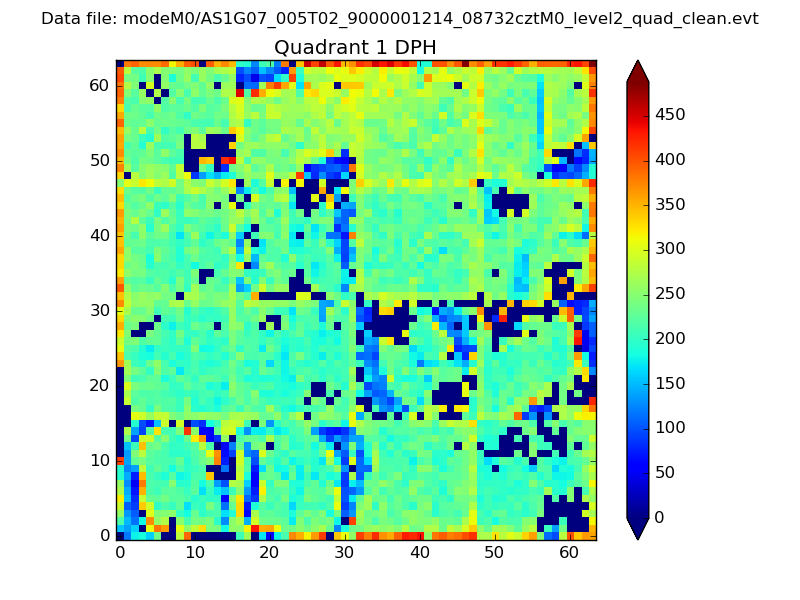 |
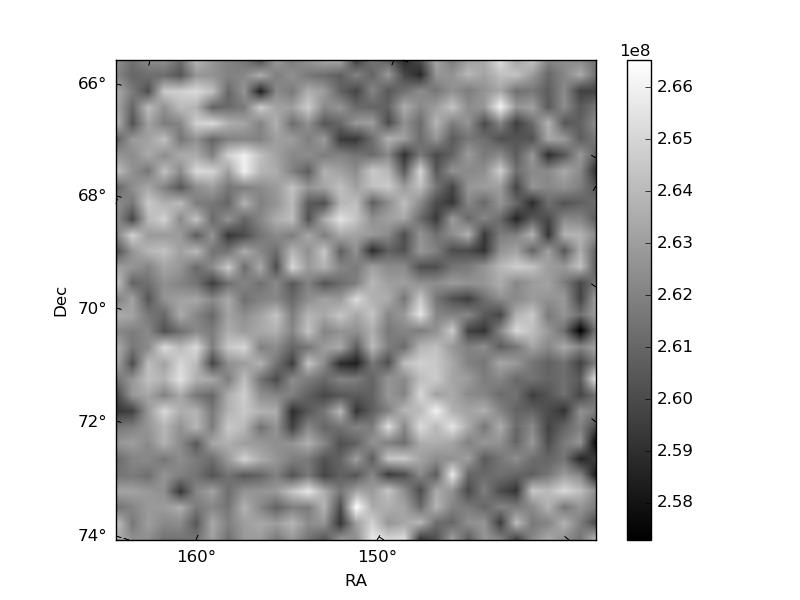
Quadrant B |
|---|---|---|---|
| Quadrant D | 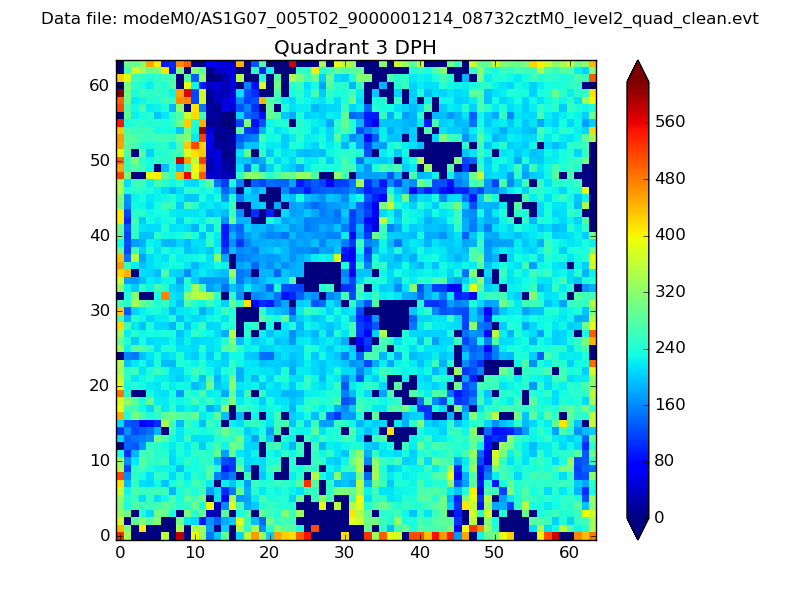 |
 |
Quadrant C |
| Plot type | Count rate plots | Images |
|---|---|---|
| Comparison with Poisson distribution Blue bars denote a histogram of data divided into 1 sec bins. Red curve is a Poisson curve with rate = median count rate of data. |
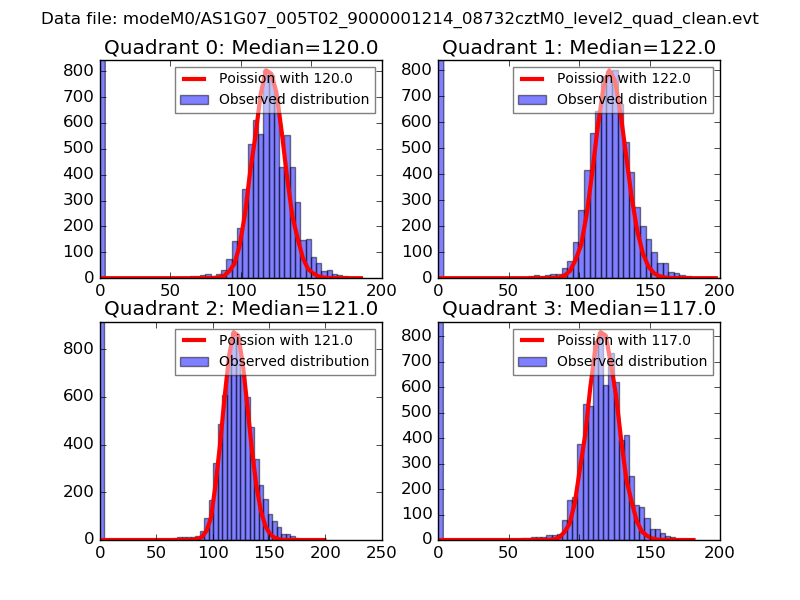 |
 |
| Quadrant-wise count rates Data is divided into 100 sec bins |
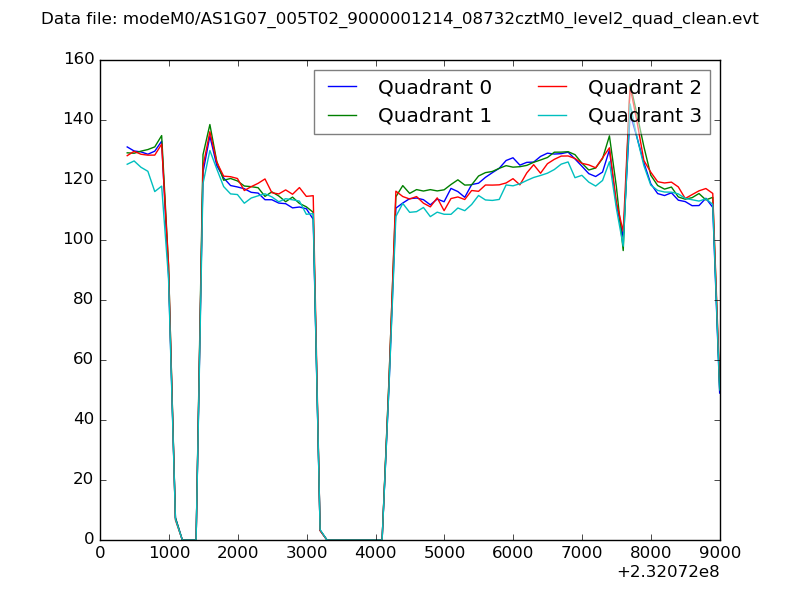 |
|
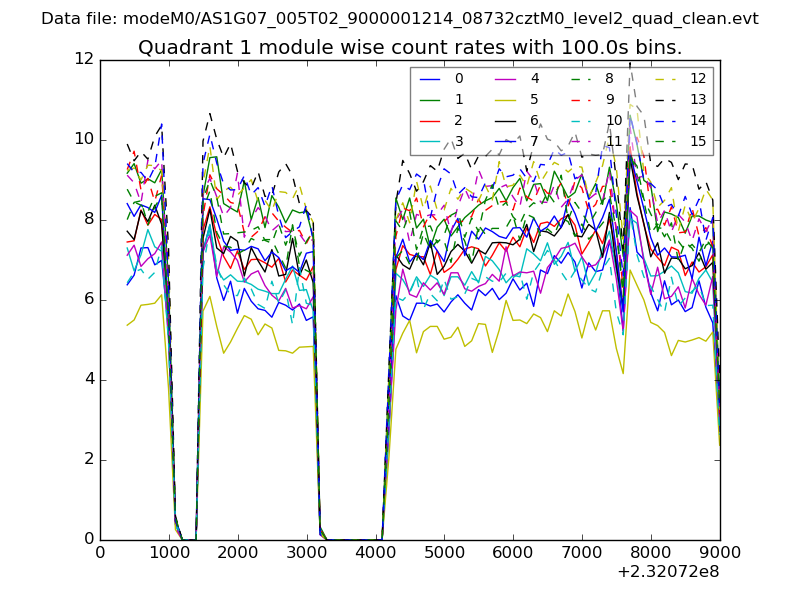
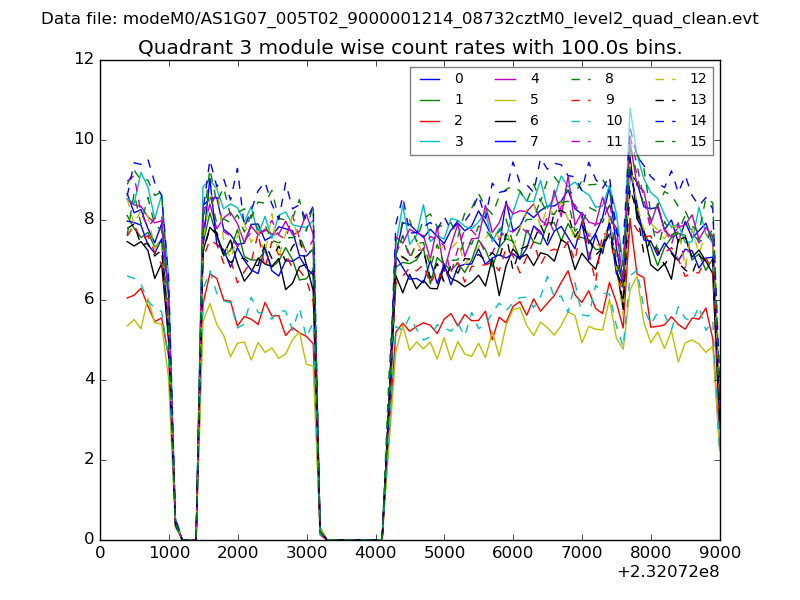
| Module-wise count rates for Quadrant A Data is divided into 100 sec bins |
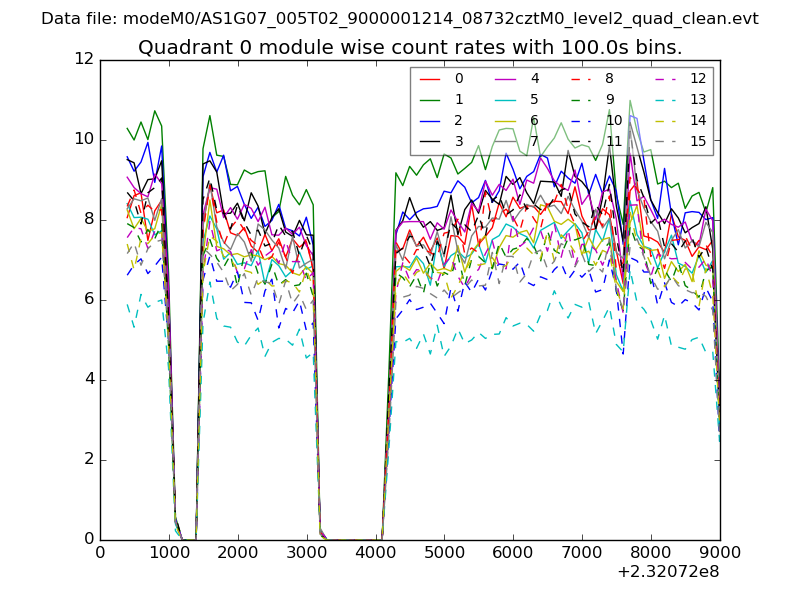 |
 |
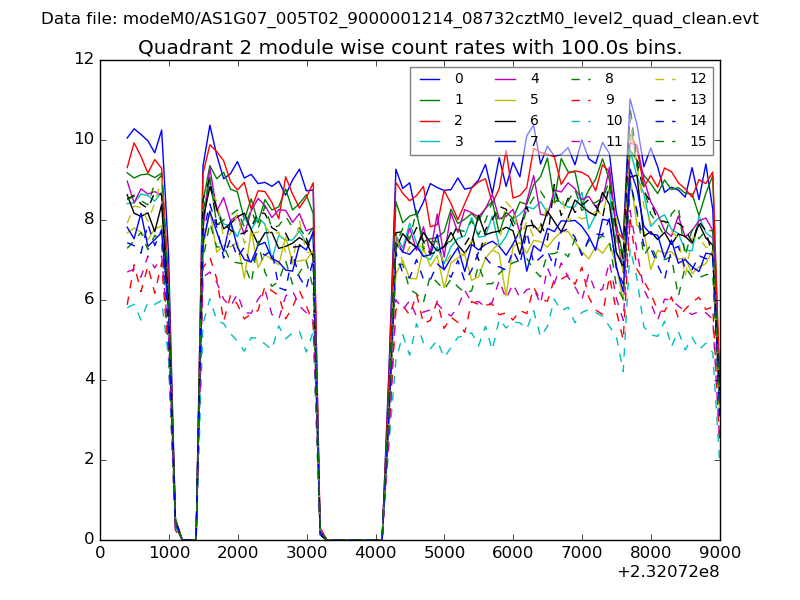
| Module-wise count rates for Quadrant B Data is divided into 100 sec bins |
 |
 |
| Module-wise count rates for Quadrant C Data is divided into 100 sec bins |
 |
 |
| Module-wise count rates for Quadrant D Data is divided into 100 sec bins |
 |
 |
| Parameter | Plot |
|---|---|
| CZT HV Monitor | 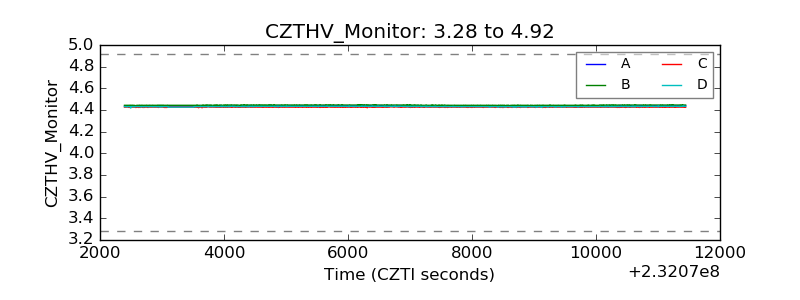 |
| D_VDD | 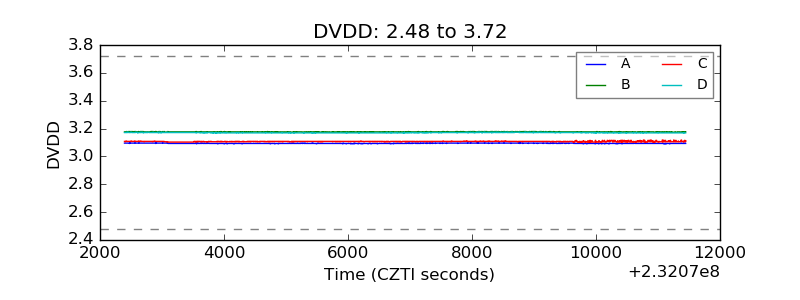 |
| Temperature 1 | 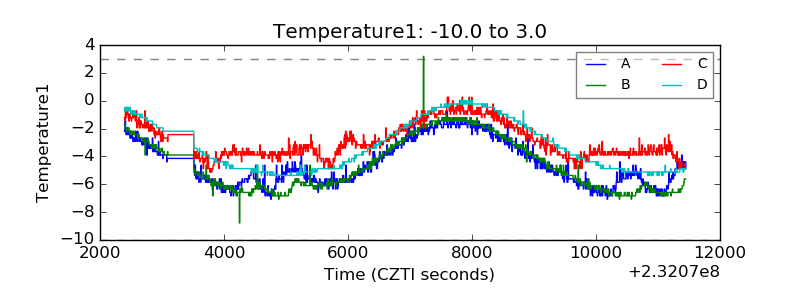 |
| Veto HV Monitor | 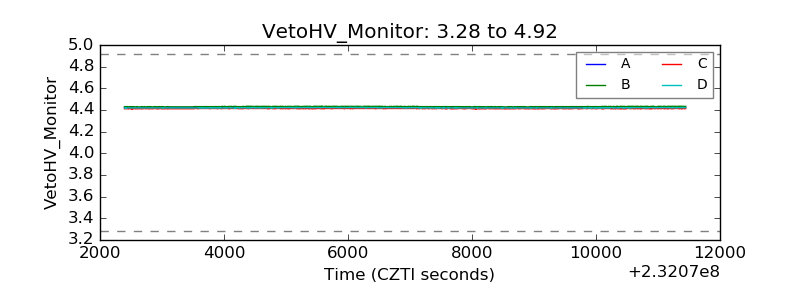 |
| Veto LLD | 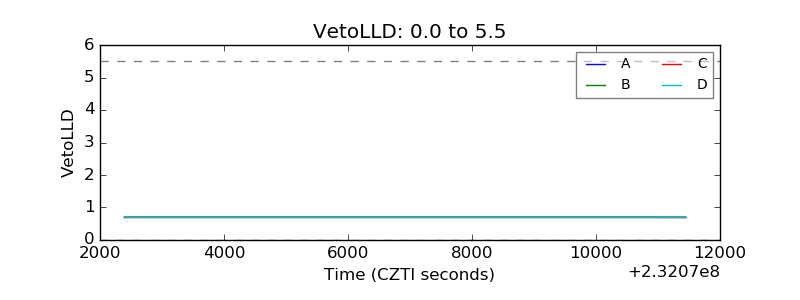 |
| Alpha Counter | 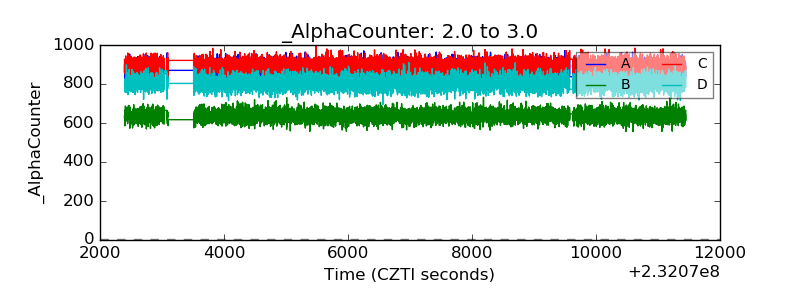 |
| _CPM_Rate | 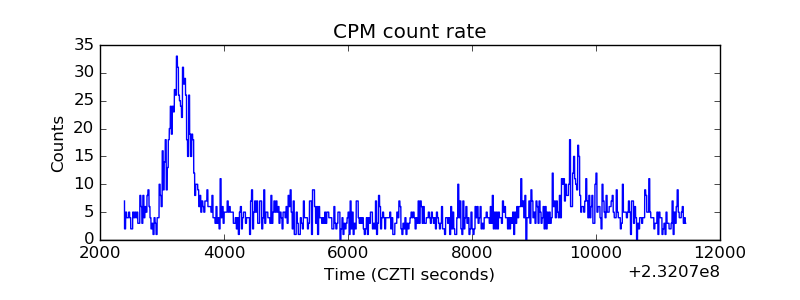 |
| CZT Counter | 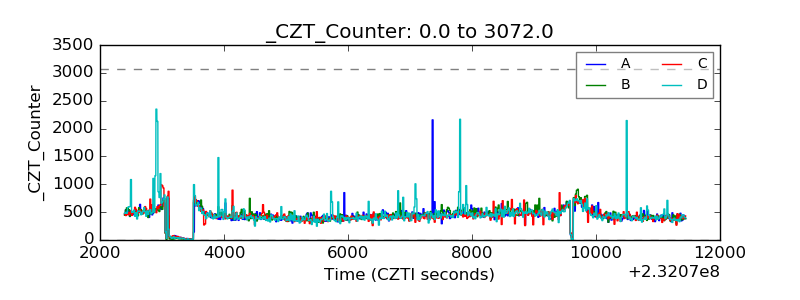 |
| +2.5 Volts monitor |  |
| +5 Volts monitor |  |
| _ROLL_ROT | 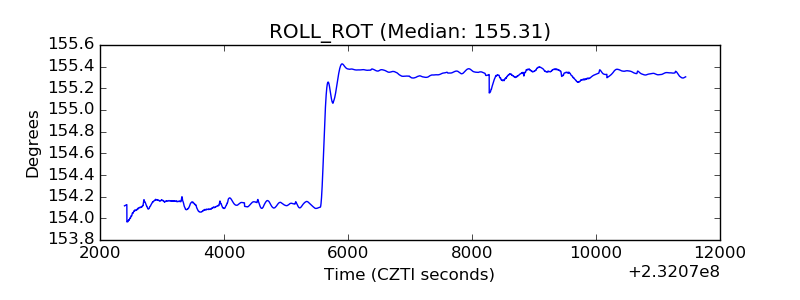 |
| _Roll_DEC | 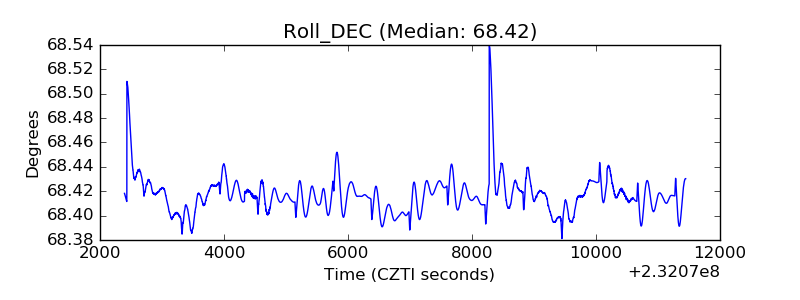 |
| _Roll_RA | 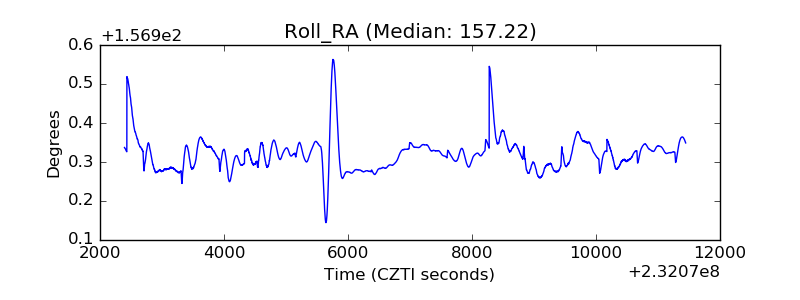 |
| Veto Counter | 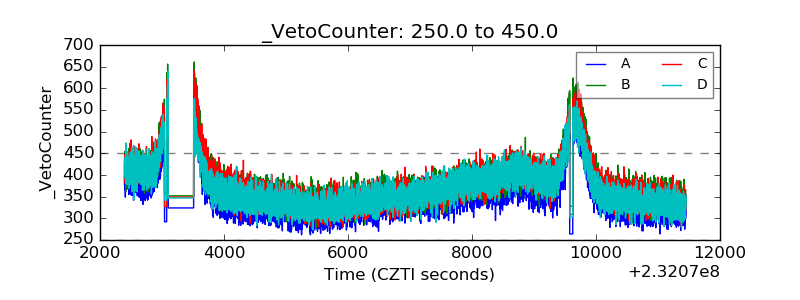 |