| Param | Original file | Final file |
|---|---|---|
| Filename | modeM0/AS1G07_005T02_9000001214_08737cztM0_level2.evt | modeM0/AS1G07_005T02_9000001214_08737cztM0_level2_quad_clean.evt |
| Size (bytes) | 1,219,282,560 | 287,112,960 |
| Size | 1.1 GB | 273.8 MB |
| Events in quadrant A | 8,621,672 | 1,877,360 |
| Events in quadrant B | 8,731,177 | 1,899,845 |
| Events in quadrant C | 9,604,649 | 1,846,318 |
| Events in quadrant D | 8,726,102 | 1,807,794 |
| Mode SS | |||
|---|---|---|---|
| Quadrant | BADHDUFLAG | Total packets | Discarded packets |
| A | 0 | 374 | 0 |
| B | 0 | 374 | 0 |
| C | 0 | 374 | 0 |
| D | 0 | 374 | 0 |
| Mode M9 | |||
|---|---|---|---|
| Quadrant | BADHDUFLAG | Total packets | Discarded packets |
| A | 0 | 28 | 0 |
| B | 0 | 28 | 0 |
| C | 0 | 28 | 0 |
| D | 0 | 28 | 0 |
| Mode M0 | |||
|---|---|---|---|
| Quadrant | BADHDUFLAG | Total packets | Discarded packets |
| A | 0 | 38035 | 5 |
| B | 0 | 38276 | 4 |
| C | 0 | 41522 | 4 |
| D | 0 | 38888 | 4 |
| Quadrant | Total seconds | Saturated seconds | Saturation percentage |
|---|---|---|---|
| A | 18365 | 220 | 1.197931% |
| B | 18365 | 227 | 1.236047% |
| C | 18365 | 451 | 2.455758% |
| D | 18365 | 228 | 1.241492% |
Noise dominated data is calculated using 1-second bins in cleaned event files. If a bin has >2000 counts, and if more than 50% of those come from <1% of pixels, then it is considered to be noise-dominated and hence unusable.
| Quadrant | # 1 sec bins | Bins with >0 counts | Bins with >2000 counts | High rate bins dominated by noise | Noise dominated (total time) | Noise dominated (detector-on time) | Marked lightcurve |
|---|---|---|---|---|---|---|---|
| A | 21180 | 18366 | 18 | 18 | 0.08% | 0.10% | 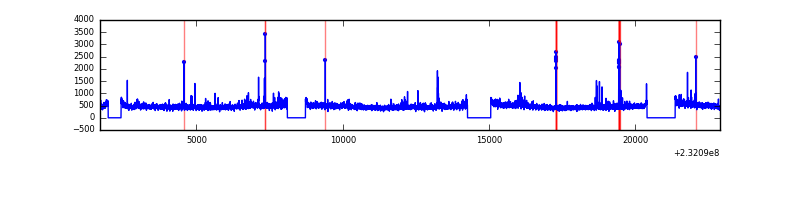 |
| B | 21180 | 18366 | 39 | 39 | 0.18% | 0.21% | 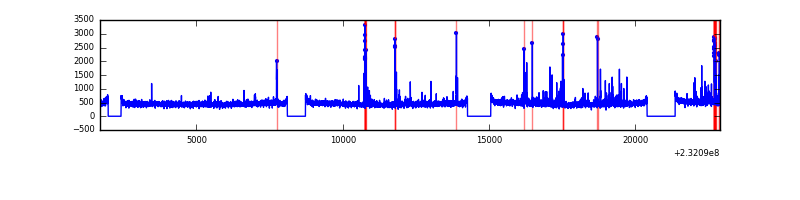 |
| C | 21180 | 18367 | 282 | 282 | 1.33% | 1.54% | 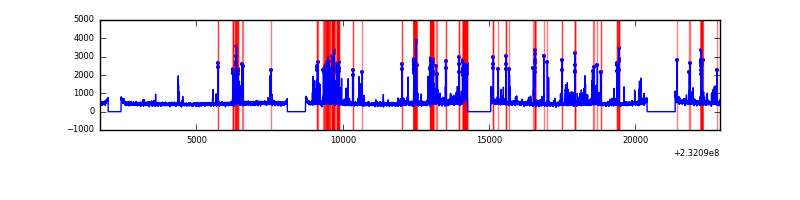 |
| D | 21180 | 18367 | 85 | 85 | 0.40% | 0.46% | 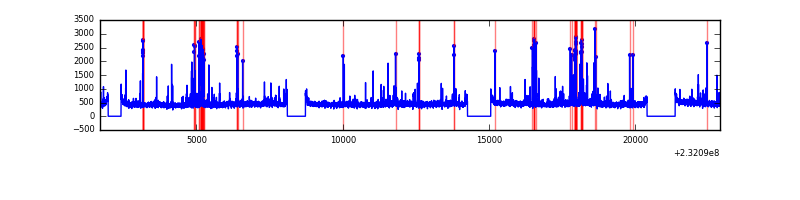 |
Top three noisy pixels from each quadrant. If the there are fewer than three noisy pixels in the level2.evt file, extra rows are filled as -1
| Pixel properties | Quadrant properties | ||||||
|---|---|---|---|---|---|---|---|
| Quadrant | DetID | PixID | Counts | Sigma | Mean | Median | Sigma |
| A | 13 | 251 | 395519 | 920.94 | 2108 | 2058 | 427.2 |
| A | 15 | 174 | 76550 | 174.36 | 2108 | 2058 | 427.2 |
| A | 5 | 16 | 35302 | 77.81 | 2108 | 2058 | 427.2 |
| B | 10 | 16 | 225791 | 552.28 | 2121 | 2071 | 405.1 |
| B | 5 | 255 | 71485 | 171.36 | 2121 | 2071 | 405.1 |
| B | 0 | 214 | 60026 | 143.07 | 2121 | 2071 | 405.1 |
| C | 4 | 254 | 984942 | 2099.3 | 2033 | 2038 | 468.2 |
| C | 1 | 16 | 541171 | 1151.49 | 2033 | 2038 | 468.2 |
| C | 14 | 234 | 98936 | 206.96 | 2033 | 2038 | 468.2 |
| D | 7 | 71 | 291386 | 532.57 | 2029 | 1982 | 543.4 |
| D | 11 | 129 | 208921 | 380.81 | 2029 | 1982 | 543.4 |
| D | 13 | 122 | 160970 | 292.57 | 2029 | 1982 | 543.4 |
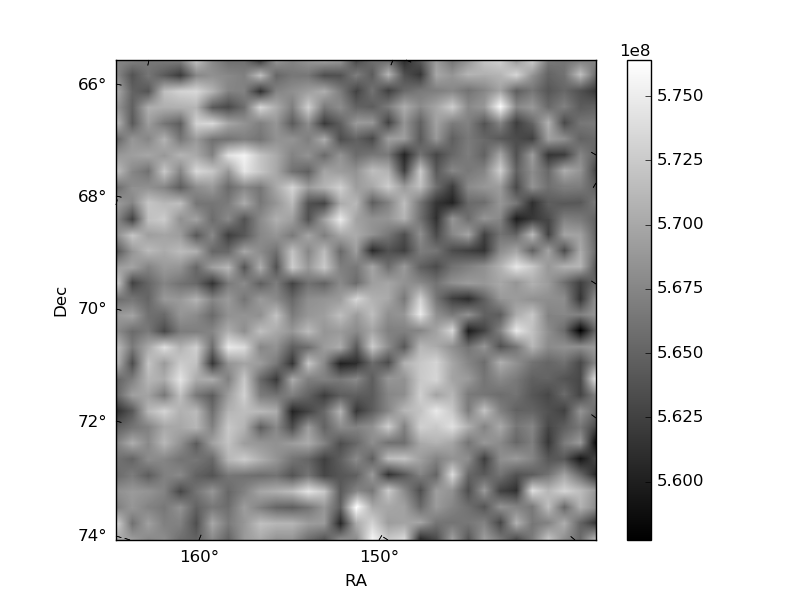
Histogram calculated using DETX and DETY for each event in the final _common_clean file
| Quadrant A | 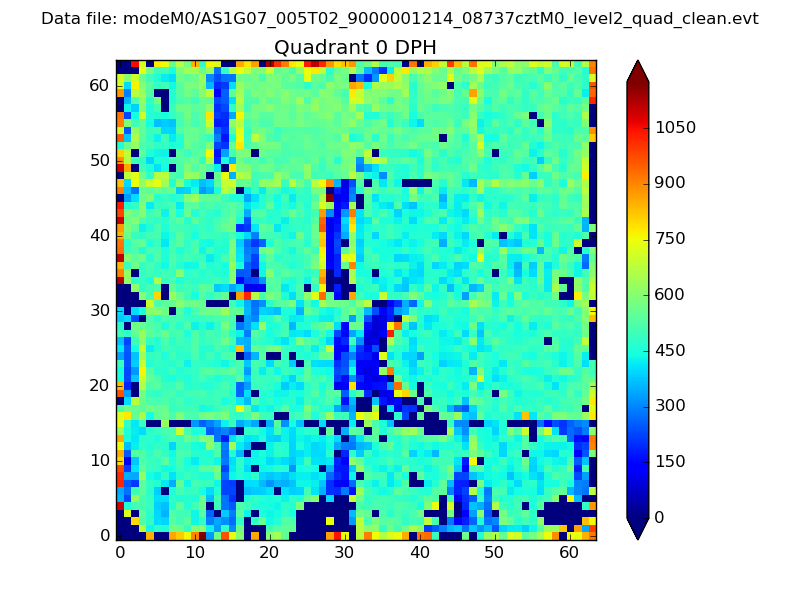 |
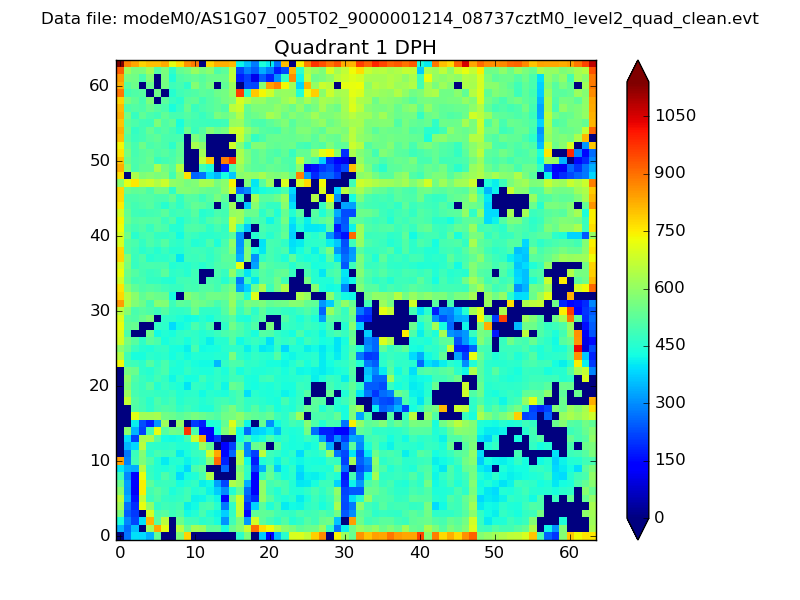 |
Quadrant B |
|---|---|---|---|
| Quadrant D | 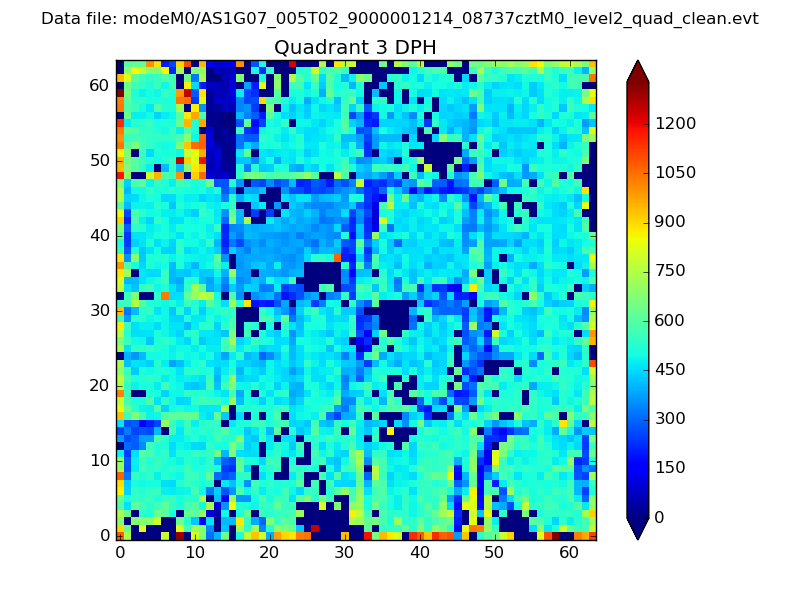 |
 |
Quadrant C |
| Plot type | Count rate plots | Images |
|---|---|---|
| Comparison with Poisson distribution Blue bars denote a histogram of data divided into 1 sec bins. Red curve is a Poisson curve with rate = median count rate of data. |
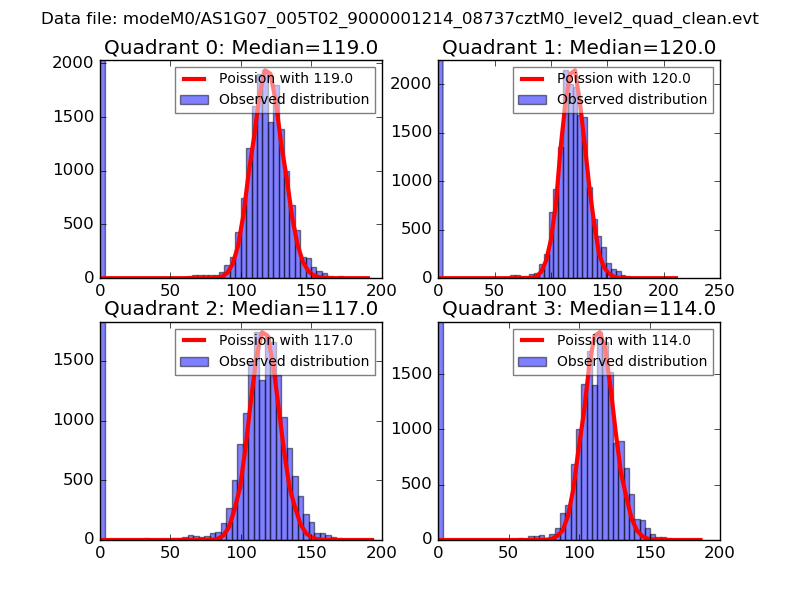 |
 |
| Quadrant-wise count rates Data is divided into 100 sec bins |
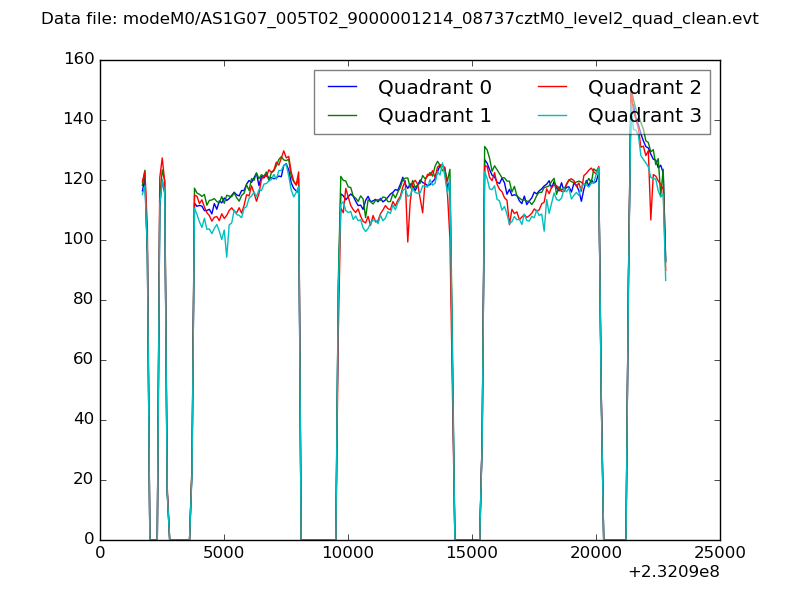 |
|
| Module-wise count rates for Quadrant A Data is divided into 100 sec bins |
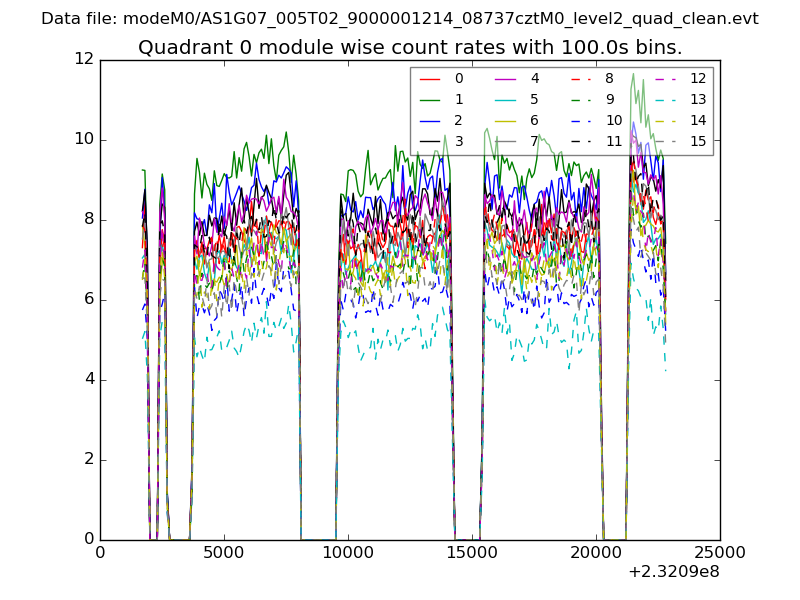 |
 |
| Module-wise count rates for Quadrant B Data is divided into 100 sec bins |
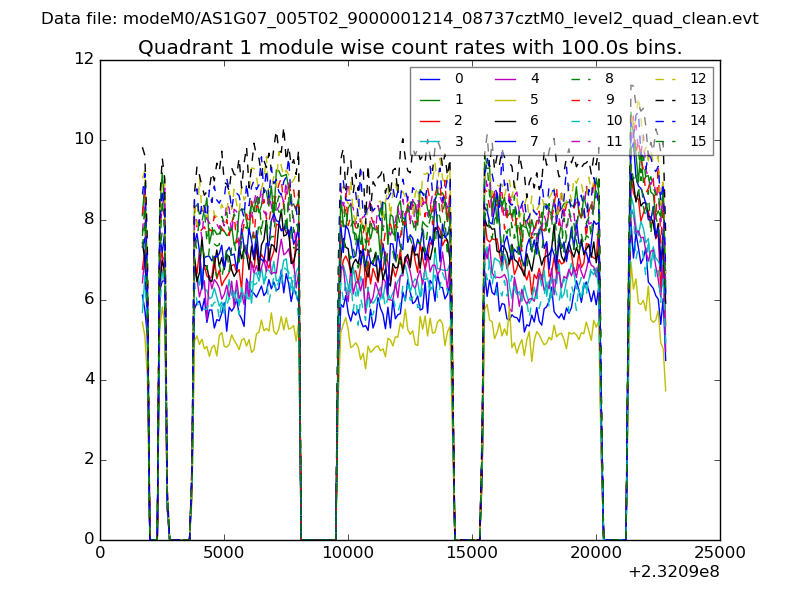 |
 |
| Module-wise count rates for Quadrant C Data is divided into 100 sec bins |
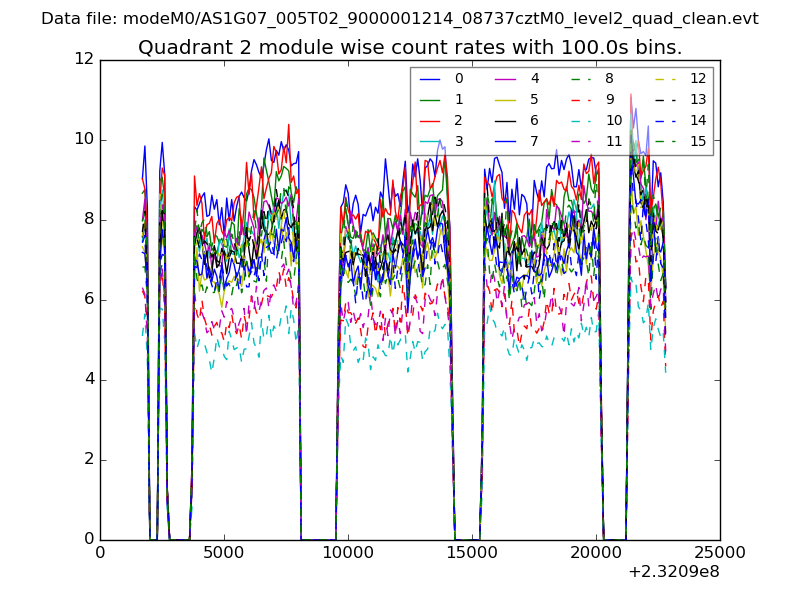 |
 |
| Module-wise count rates for Quadrant D Data is divided into 100 sec bins |
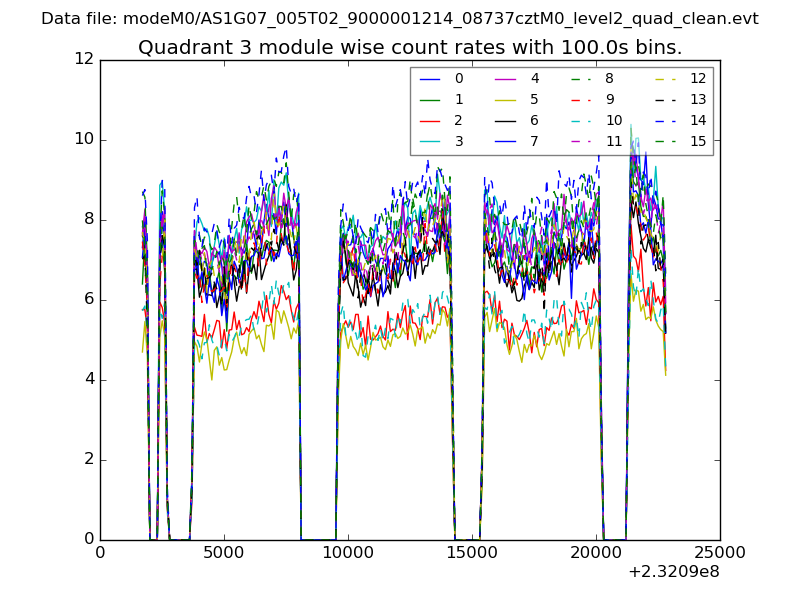 |
 |
| Parameter | Plot |
|---|---|
| CZT HV Monitor | 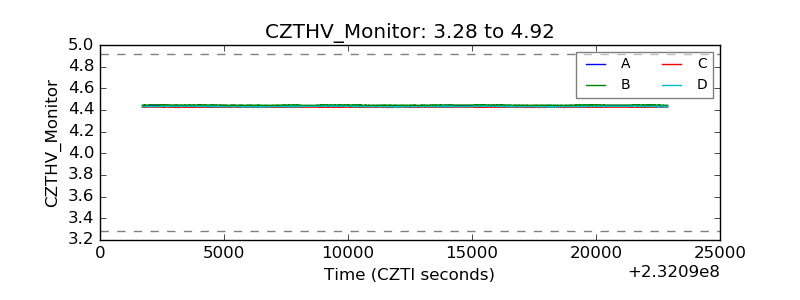 |
| D_VDD | 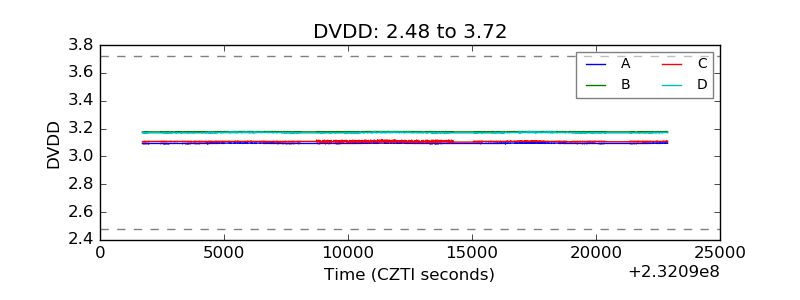 |
| Temperature 1 | 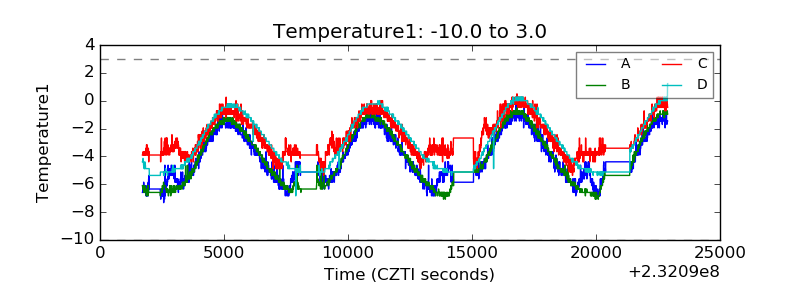 |
| Veto HV Monitor | 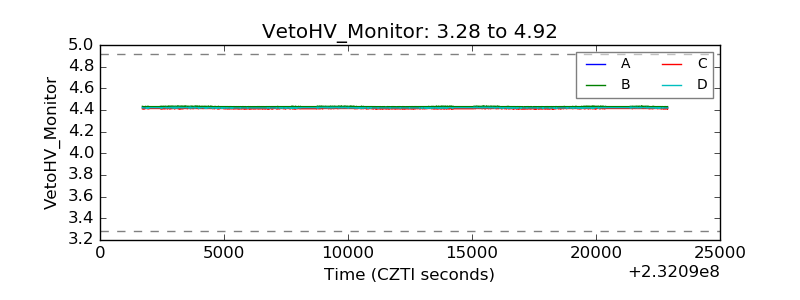 |
| Veto LLD | 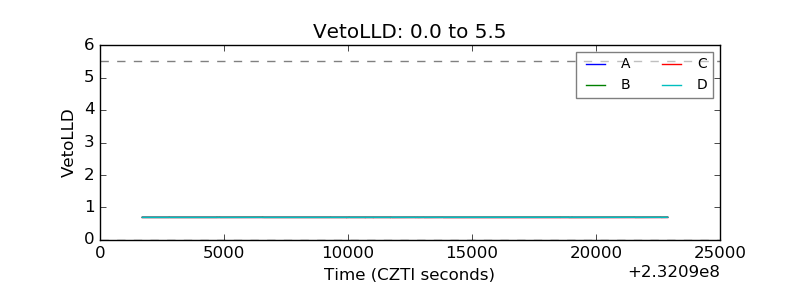 |
| Alpha Counter | 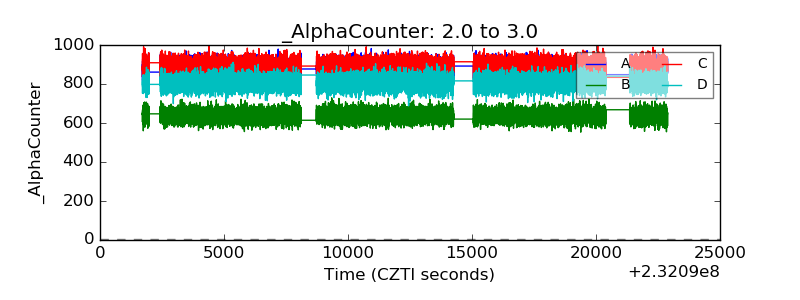 |
| _CPM_Rate | 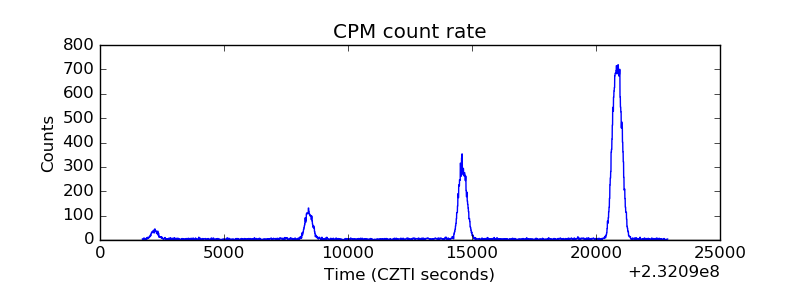 |
| CZT Counter |  |
| +2.5 Volts monitor |  |
| +5 Volts monitor |  |
| _ROLL_ROT | 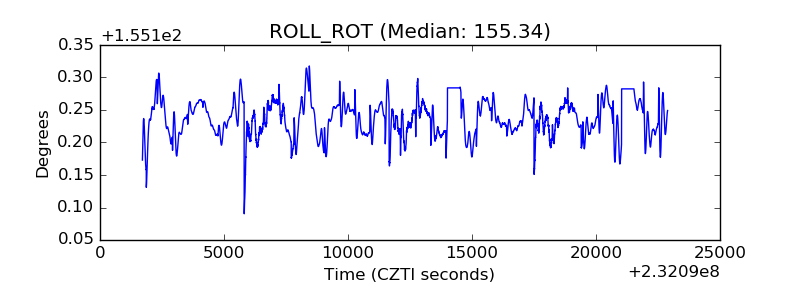 |
| _Roll_DEC | 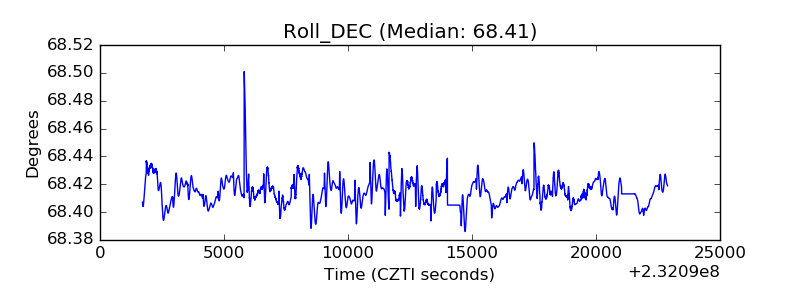 |
| _Roll_RA |  |
| Veto Counter | 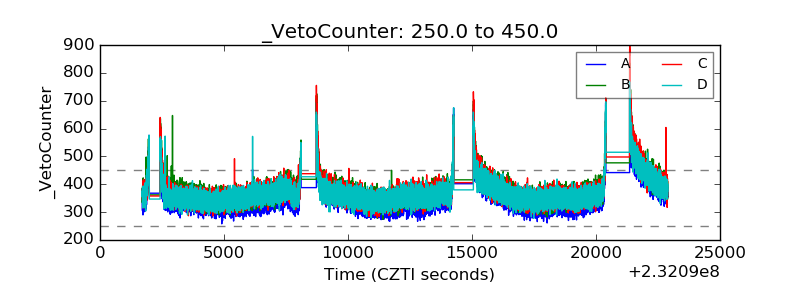 |