| Param | Original file | Final file |
|---|---|---|
| Filename | modeM0/AS1G07_005T02_9000001214_08739cztM0_level2.evt | modeM0/AS1G07_005T02_9000001214_08739cztM0_level2_quad_clean.evt |
| Size (bytes) | 206,714,880 | 55,722,240 |
| Size | 197.1 MB | 53.1 MB |
| Events in quadrant A | 1,399,273 | 376,235 |
| Events in quadrant B | 1,520,997 | 375,487 |
| Events in quadrant C | 1,471,634 | 364,466 |
| Events in quadrant D | 1,660,679 | 355,424 |
| Mode SS | |||
|---|---|---|---|
| Quadrant | BADHDUFLAG | Total packets | Discarded packets |
| A | 0 | 60 | 0 |
| B | 0 | 60 | 0 |
| C | 0 | 60 | 0 |
| D | 0 | 60 | 0 |
| Mode M0 | |||
|---|---|---|---|
| Quadrant | BADHDUFLAG | Total packets | Discarded packets |
| A | 0 | 6199 | 0 |
| B | 0 | 6502 | 0 |
| C | 0 | 6500 | 0 |
| D | 0 | 7002 | 0 |
| Quadrant | Total seconds | Saturated seconds | Saturation percentage |
|---|---|---|---|
| A | 3027 | 6 | 0.198216% |
| B | 3027 | 24 | 0.792864% |
| C | 3027 | 27 | 0.891972% |
| D | 3027 | 9 | 0.297324% |
Noise dominated data is calculated using 1-second bins in cleaned event files. If a bin has >2000 counts, and if more than 50% of those come from <1% of pixels, then it is considered to be noise-dominated and hence unusable.
| Quadrant | # 1 sec bins | Bins with >0 counts | Bins with >2000 counts | High rate bins dominated by noise | Noise dominated (total time) | Noise dominated (detector-on time) | Marked lightcurve |
|---|---|---|---|---|---|---|---|
| A | 3027 | 3027 | 1 | 1 | 0.03% | 0.03% | 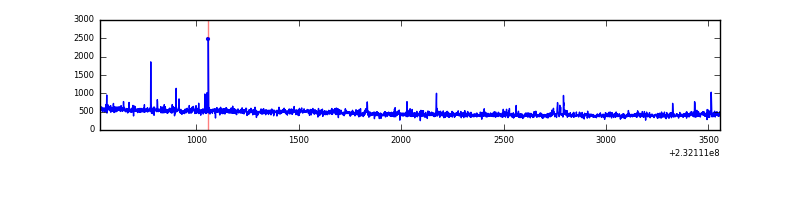 |
| B | 3027 | 3027 | 20 | 20 | 0.66% | 0.66% | 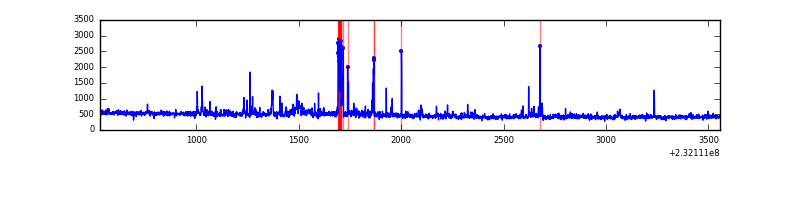 |
| C | 3027 | 3027 | 24 | 24 | 0.79% | 0.79% | 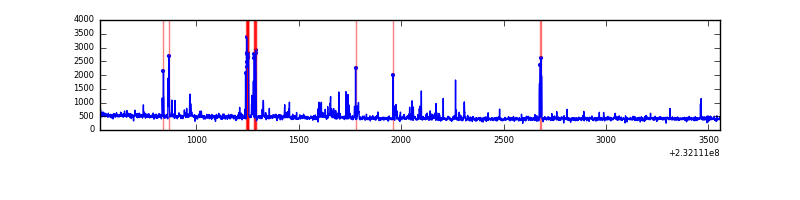 |
| D | 3027 | 3027 | 7 | 7 | 0.23% | 0.23% | 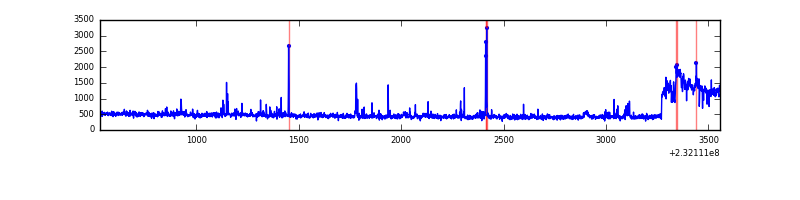 |
Top three noisy pixels from each quadrant. If the there are fewer than three noisy pixels in the level2.evt file, extra rows are filled as -1
| Pixel properties | Quadrant properties | ||||||
|---|---|---|---|---|---|---|---|
| Quadrant | DetID | PixID | Counts | Sigma | Mean | Median | Sigma |
| A | 13 | 251 | 44411 | 608.51 | 348 | 340 | 72.4 |
| A | 5 | 16 | 9191 | 122.21 | 348 | 340 | 72.4 |
| A | 15 | 174 | 4178 | 52.99 | 348 | 340 | 72.4 |
| B | 10 | 16 | 87787 | 1312.89 | 344 | 336 | 66.6 |
| B | 0 | 214 | 32881 | 488.6 | 344 | 336 | 66.6 |
| B | 4 | 173 | 25009 | 370.41 | 344 | 336 | 66.6 |
| C | 4 | 254 | 155757 | 1998.34 | 334 | 335 | 77.8 |
| C | 1 | 16 | 12251 | 153.21 | 334 | 335 | 77.8 |
| C | 13 | 61 | 2558 | 28.58 | 334 | 335 | 77.8 |
| D | 7 | 71 | 305282 | 3419.17 | 336 | 328 | 89.2 |
| D | 2 | 152 | 16338 | 179.51 | 336 | 328 | 89.2 |
| D | 11 | 129 | 15673 | 172.05 | 336 | 328 | 89.2 |
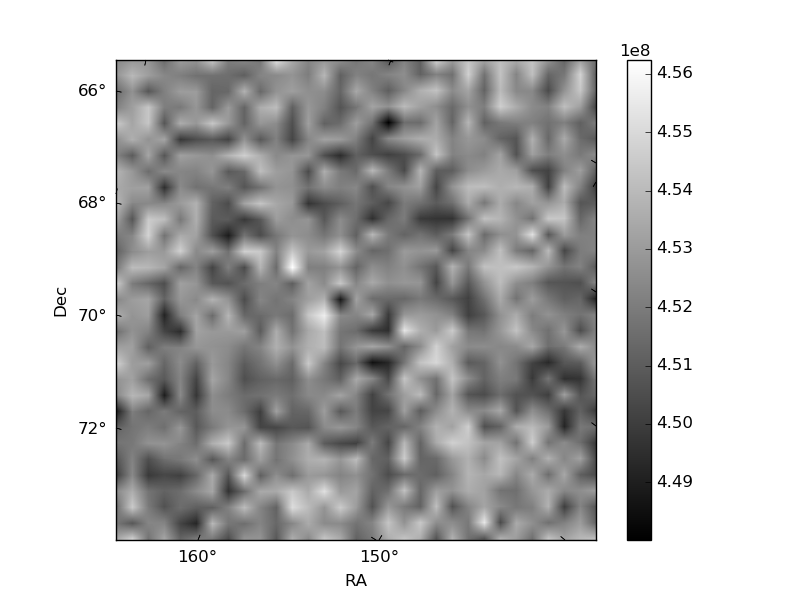
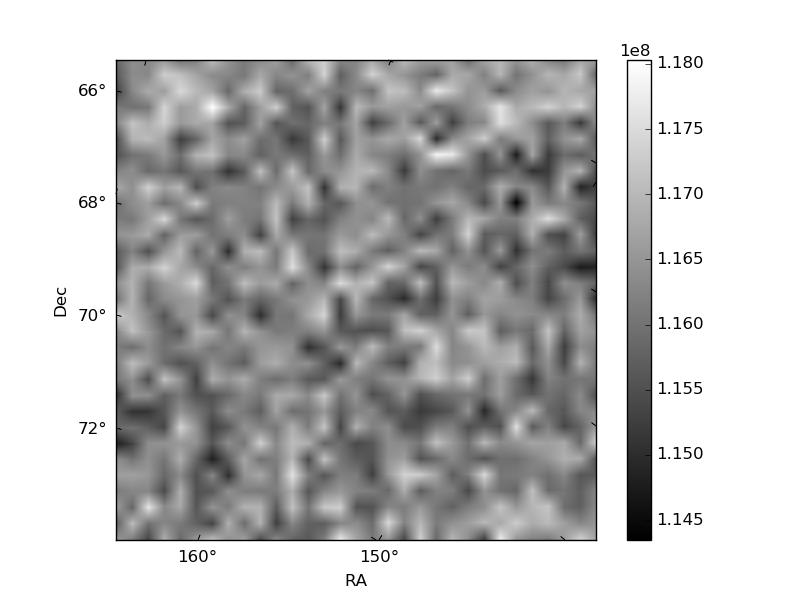
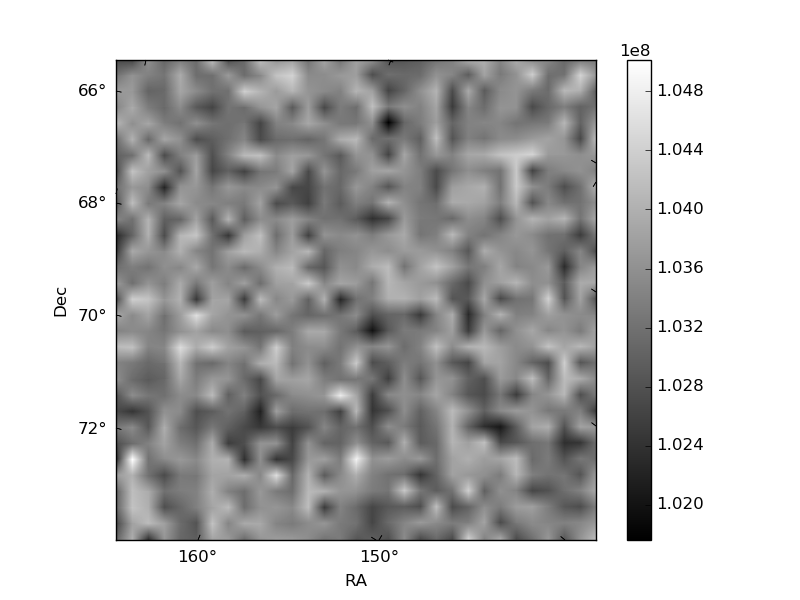
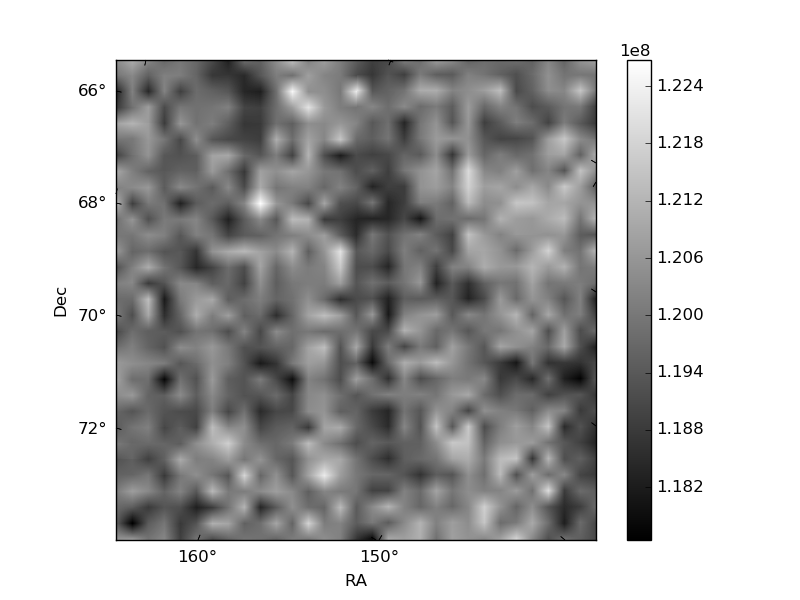
Histogram calculated using DETX and DETY for each event in the final _common_clean file
| Quadrant A | 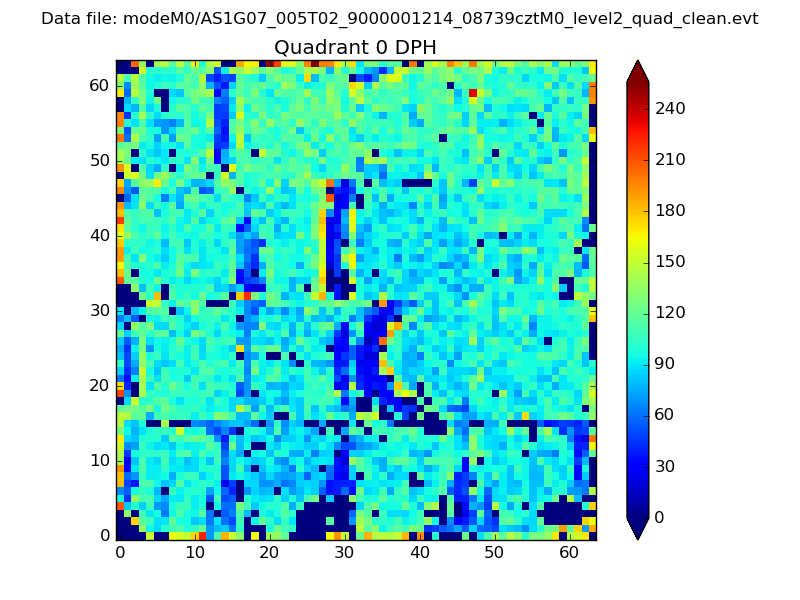 |
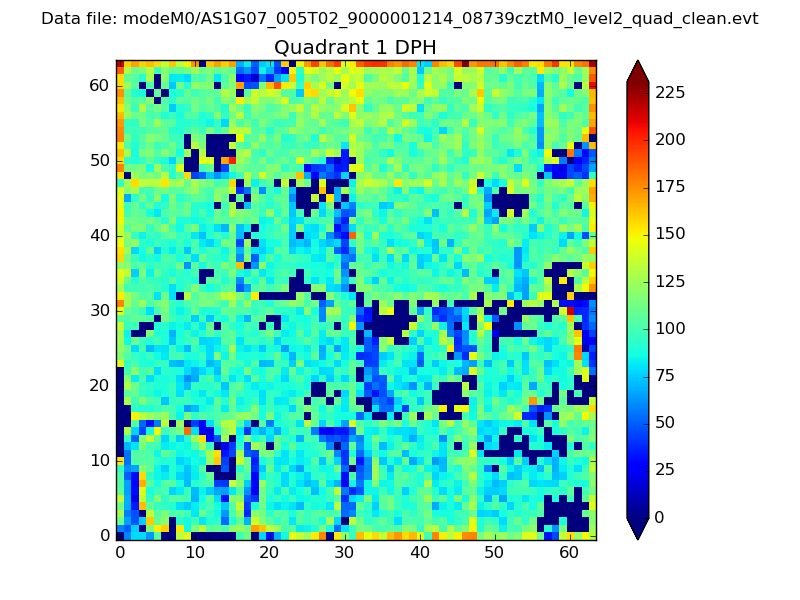 |
Quadrant B |
|---|---|---|---|
| Quadrant D | 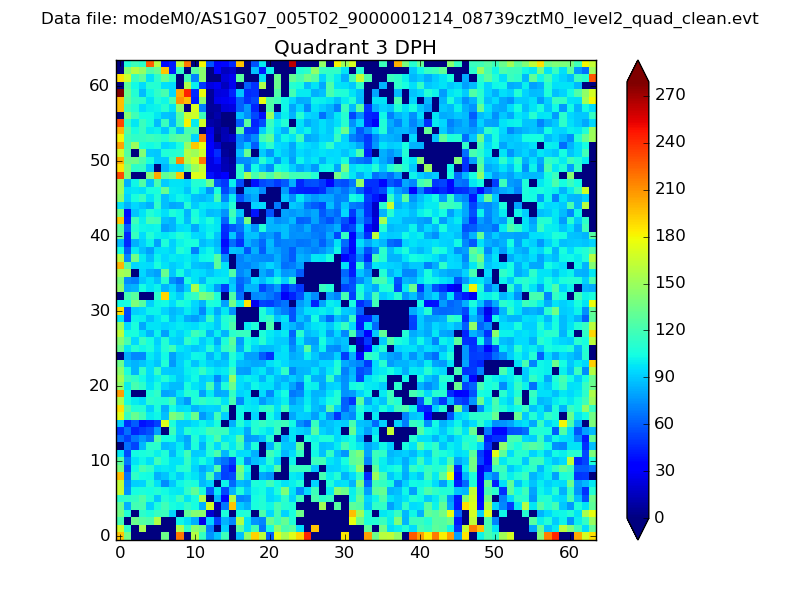 |
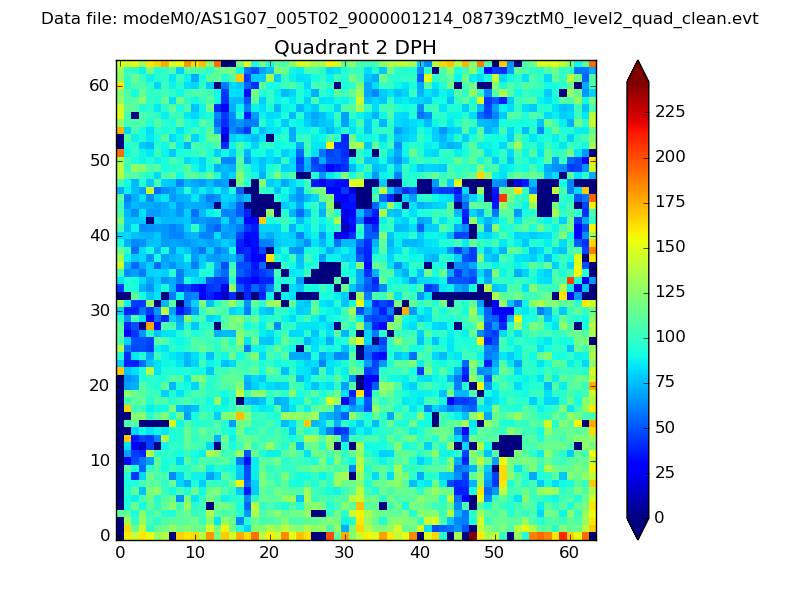 |
Quadrant C |
| Plot type | Count rate plots | Images |
|---|---|---|
| Comparison with Poisson distribution Blue bars denote a histogram of data divided into 1 sec bins. Red curve is a Poisson curve with rate = median count rate of data. |
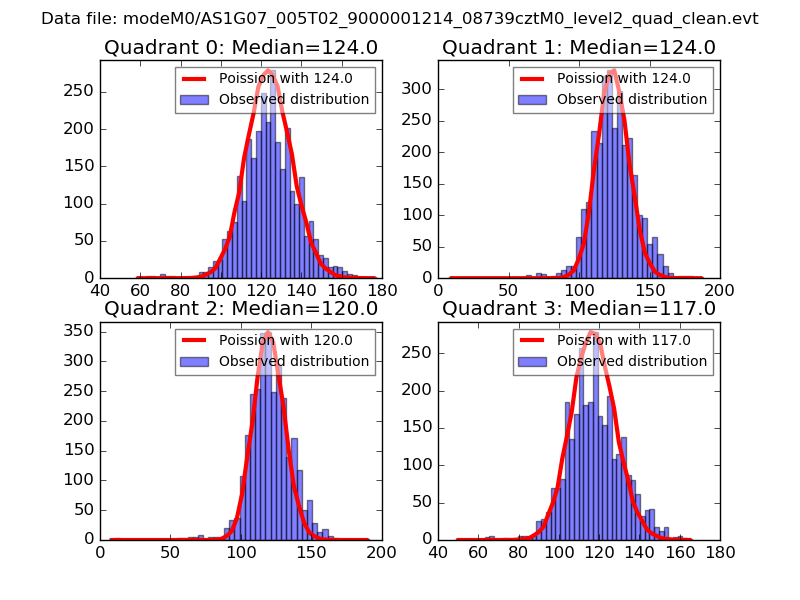 |
 |
| Quadrant-wise count rates Data is divided into 100 sec bins |
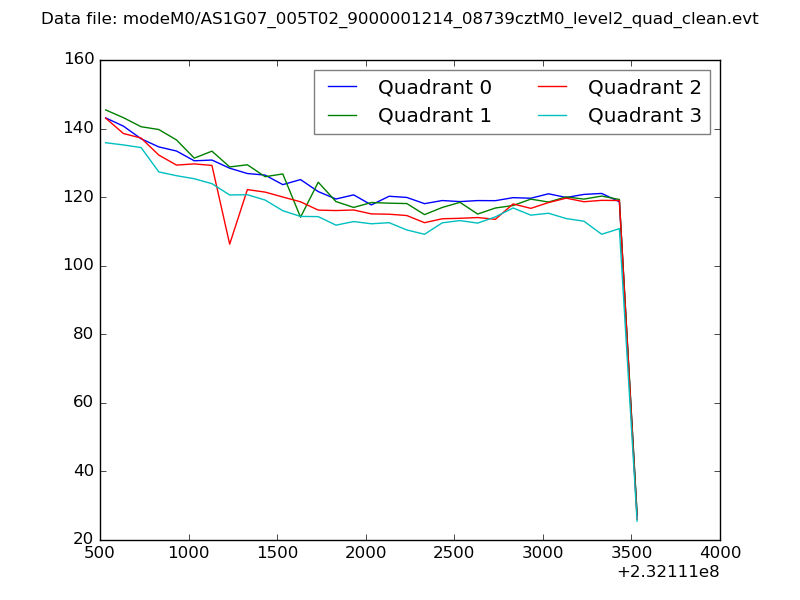 |
|
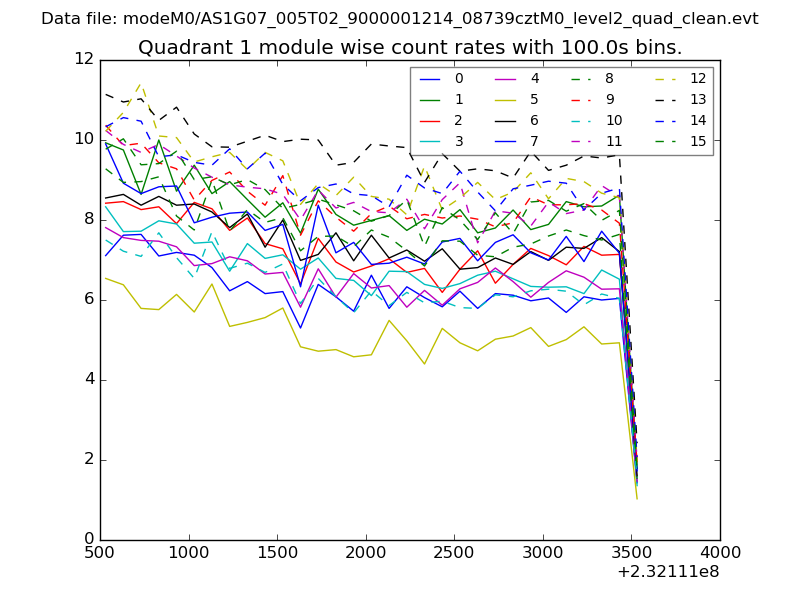
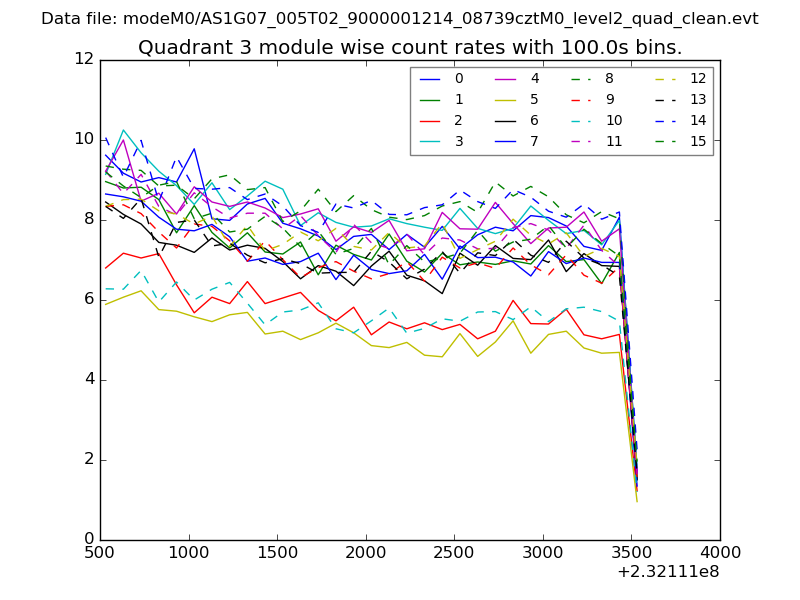
| Module-wise count rates for Quadrant A Data is divided into 100 sec bins |
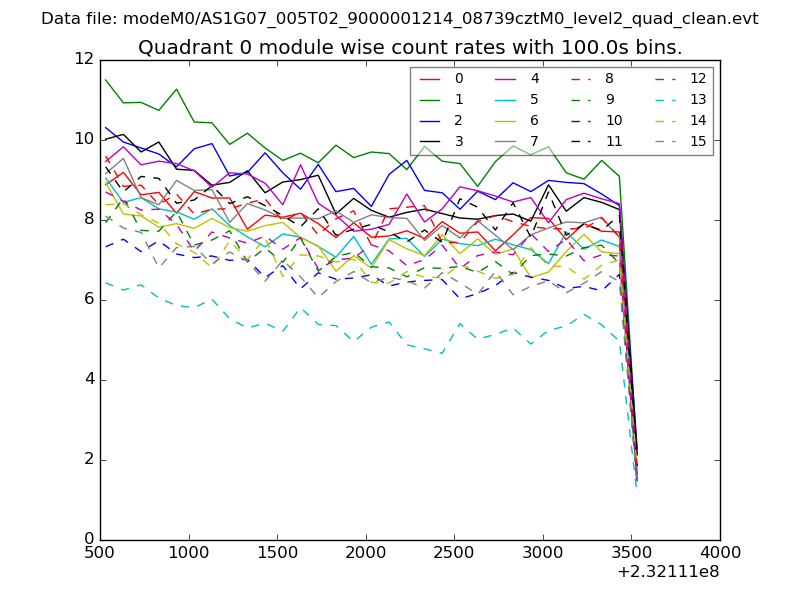 |
 |
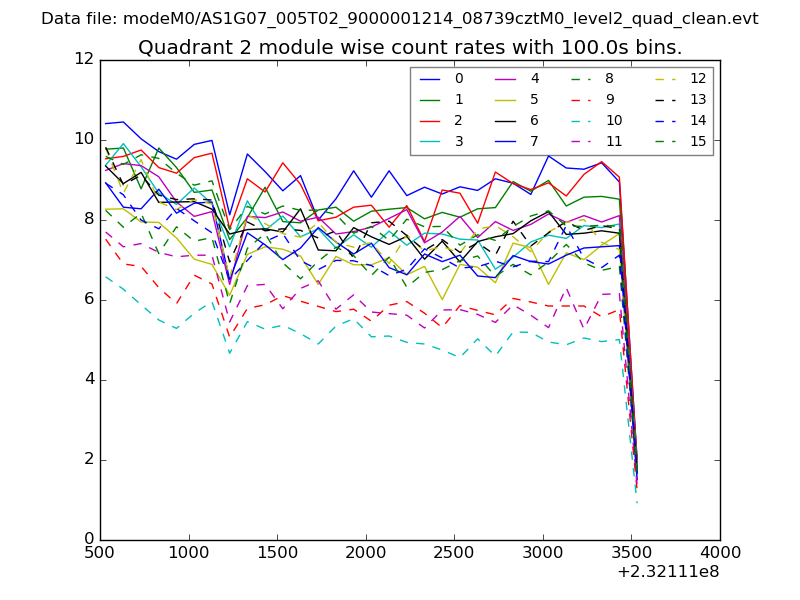
| Module-wise count rates for Quadrant B Data is divided into 100 sec bins |
 |
 |
| Module-wise count rates for Quadrant C Data is divided into 100 sec bins |
 |
 |
| Module-wise count rates for Quadrant D Data is divided into 100 sec bins |
 |
 |
| Parameter | Plot |
|---|---|
| CZT HV Monitor | 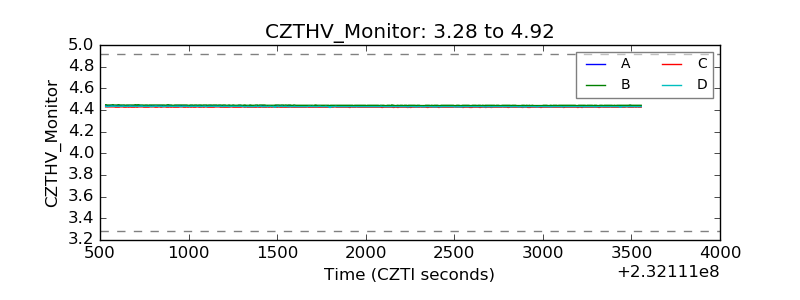 |
| D_VDD | 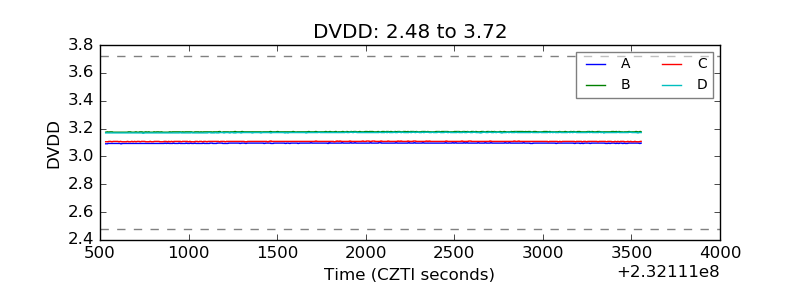 |
| Temperature 1 | 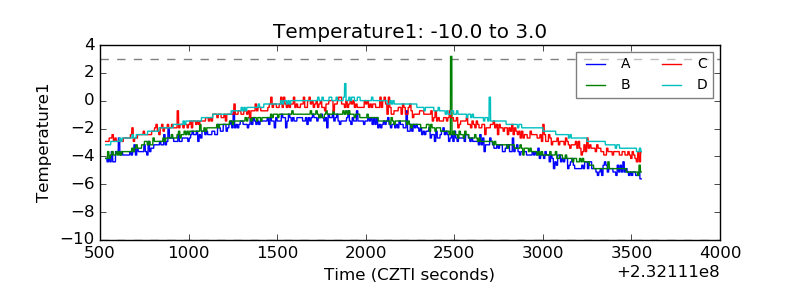 |
| Veto HV Monitor | 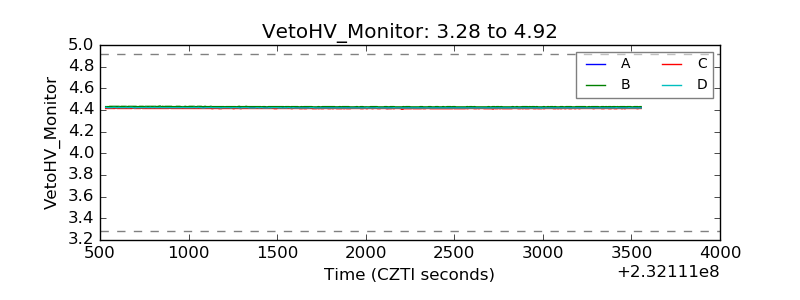 |
| Veto LLD | 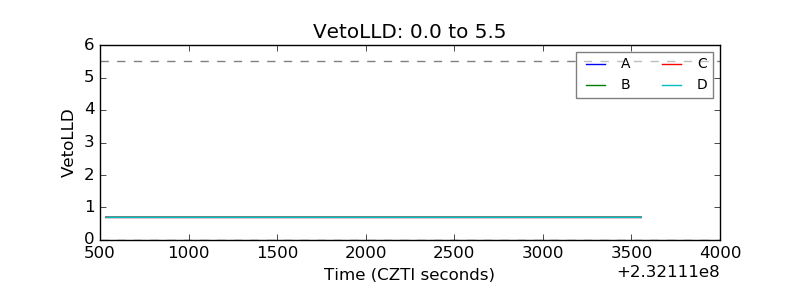 |
| Alpha Counter | 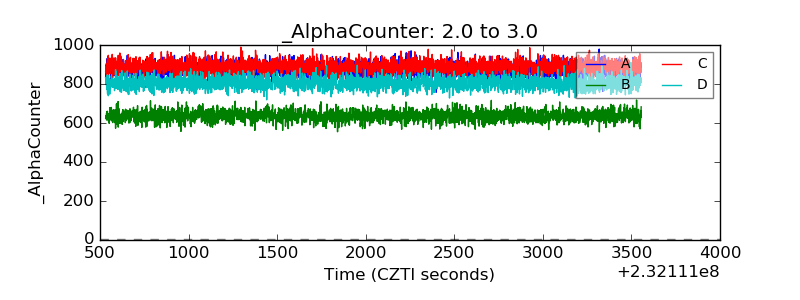 |
| _CPM_Rate | 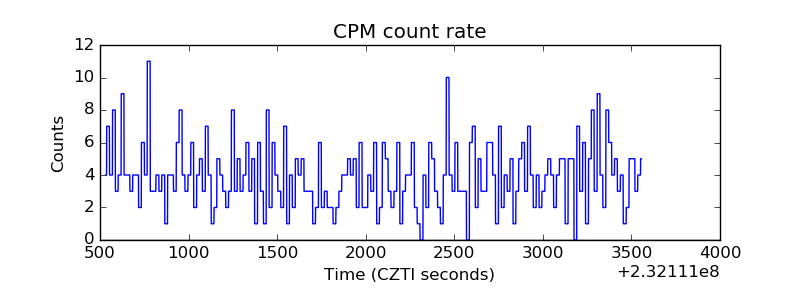 |
| CZT Counter | 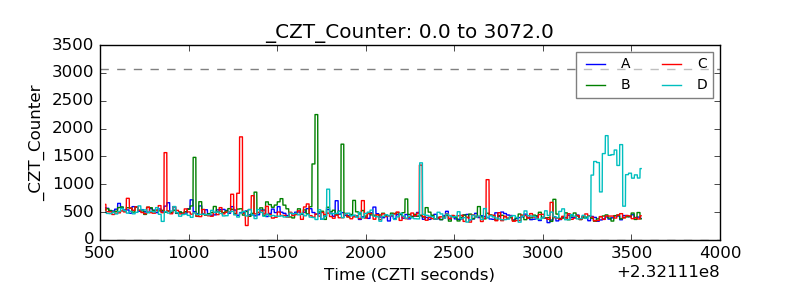 |
| +2.5 Volts monitor |  |
| +5 Volts monitor |  |
| _ROLL_ROT | 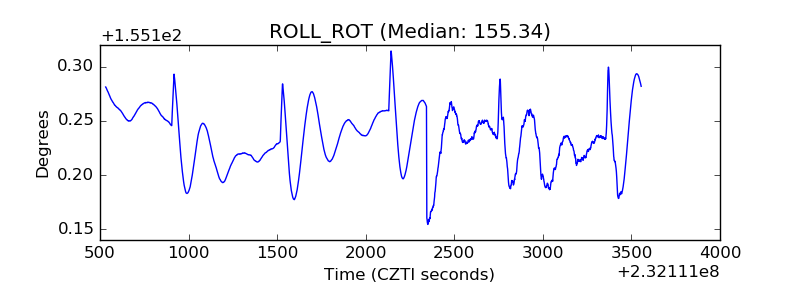 |
| _Roll_DEC | 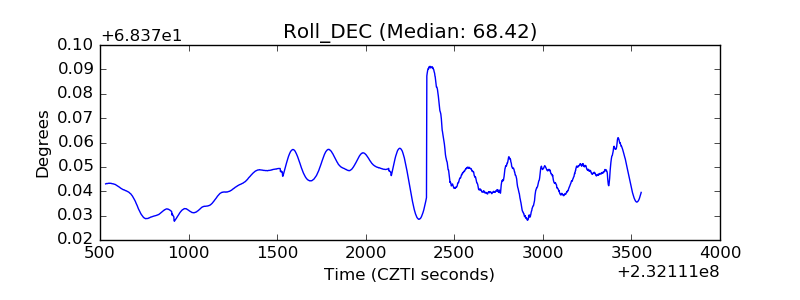 |
| _Roll_RA | 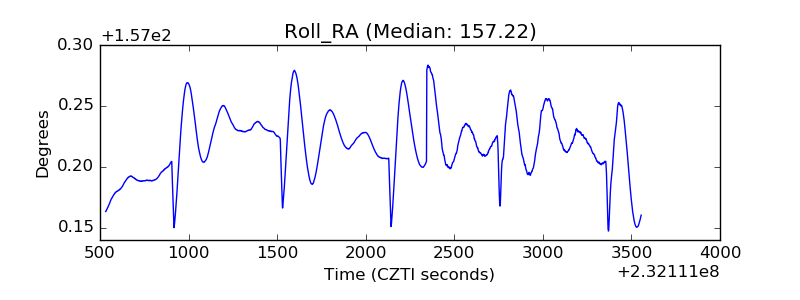 |
| Veto Counter | 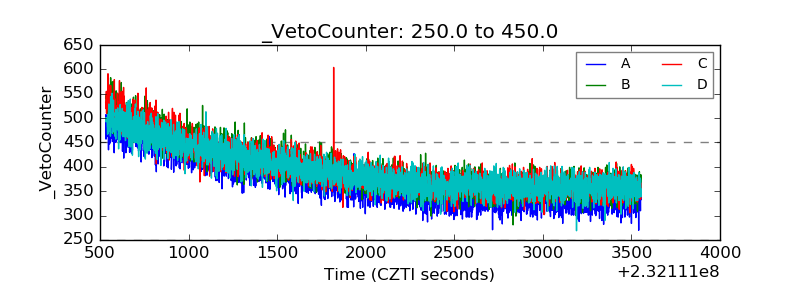 |