| Param | Original file | Final file |
|---|---|---|
| Filename | modeM0/AS1G07_013T02_9000001216cztM0_level2.fits | modeM0/AS1G07_013T02_9000001216cztM0_level2_quad_clean.evt |
| Size (bytes) | 554,837,760 | 593,766,720 |
| Size | 529.1 MB | 566.3 MB |
| Events in quadrant A | 3,316,302 | 3,594,110 |
| Events in quadrant B | 3,206,486 | 3,602,485 |
| Events in quadrant C | 3,309,772 | 3,480,444 |
| Events in quadrant D | 2,853,554 | 3,188,982 |
| Mode SS | |||
|---|---|---|---|
| Quadrant | BADHDUFLAG | Total packets | Discarded packets |
| A | 0 | 1224 | 0 |
| B | 0 | 1224 | 0 |
| C | 0 | 1224 | 0 |
| D | 0 | 1224 | 0 |
| Mode M0 | |||
|---|---|---|---|
| Quadrant | BADHDUFLAG | Total packets | Discarded packets |
| A | 0 | 127373 | 0 |
| B | 0 | 129551 | 0 |
| C | 0 | 126100 | 0 |
| D | 0 | 135583 | 0 |
| Mode M9 | |||
|---|---|---|---|
| Quadrant | BADHDUFLAG | Total packets | Discarded packets |
| A | 0 | 92 | 0 |
| B | 0 | 92 | 0 |
| C | 0 | 92 | 0 |
| D | 0 | 92 | 0 |
| Quadrant | Total seconds | Saturated seconds | Saturation percentage |
|---|---|---|---|
| A | 60020 | 694 | 1.156281% |
| B | 60018 | 1137 | 1.894432% |
| C | 60018 | 608 | 1.013029% |
| D | 60017 | 1094 | 1.822817% |
Noise dominated data is calculated using 1-second bins in cleaned event files. If a bin has >2000 counts, and if more than 50% of those come from <1% of pixels, then it is considered to be noise-dominated and hence unusable.
| Quadrant | # 1 sec bins | Bins with >0 counts | Bins with >2000 counts | High rate bins dominated by noise | Noise dominated (total time) | Noise dominated (detector-on time) | Marked lightcurve |
|---|---|---|---|---|---|---|---|
| A | 69230 | 60013 | 0 | 0 | 0.00% | 0.00% |  |
| B | 69230 | 60011 | 0 | 0 | 0.00% | 0.00% |  |
| C | 69230 | 60012 | 0 | 0 | 0.00% | 0.00% |  |
| D | 69230 | 60014 | 0 | 0 | 0.00% | 0.00% | 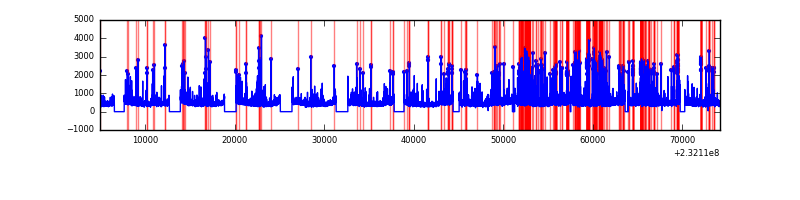 |
Top three noisy pixels from each quadrant. If the there are fewer than three noisy pixels in the level2.evt file, extra rows are filled as -1
| Pixel properties | Quadrant properties | ||||||
|---|---|---|---|---|---|---|---|
| Quadrant | DetID | PixID | Counts | Sigma | Mean | Median | Sigma |
| A | 0 | 29 | 3336 | 11.63 | 863 | 807 | 217.5 |
| A | 7 | 110 | 2751 | 8.94 | 863 | 807 | 217.5 |
| A | 0 | 30 | 2601 | 8.25 | 863 | 807 | 217.5 |
| B | 2 | 9 | 2680 | 11.36 | 847 | 810 | 164.6 |
| B | 12 | 226 | 2198 | 8.43 | 847 | 810 | 164.6 |
| B | 14 | 254 | 2160 | 8.2 | 847 | 810 | 164.6 |
| C | 1 | 80 | 2495 | 7.36 | 874 | 814 | 228.4 |
| C | 1 | 81 | 2428 | 7.07 | 874 | 814 | 228.4 |
| C | 12 | 241 | 2414 | 7.01 | 874 | 814 | 228.4 |
| D | 6 | 231 | 2099 | 6.21 | 813 | 740 | 219.0 |
| D | 10 | 189 | 2071 | 6.08 | 813 | 740 | 219.0 |
| D | 3 | 14 | 2055 | 6.01 | 813 | 740 | 219.0 |
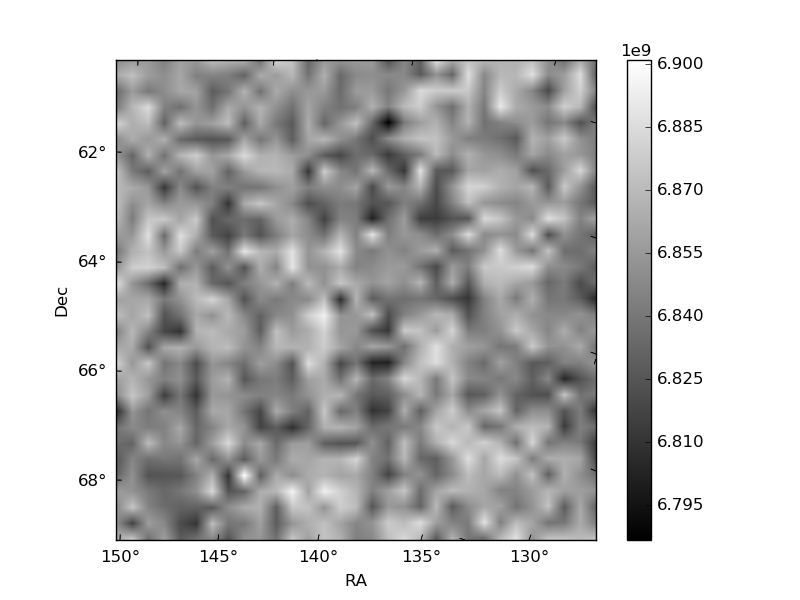
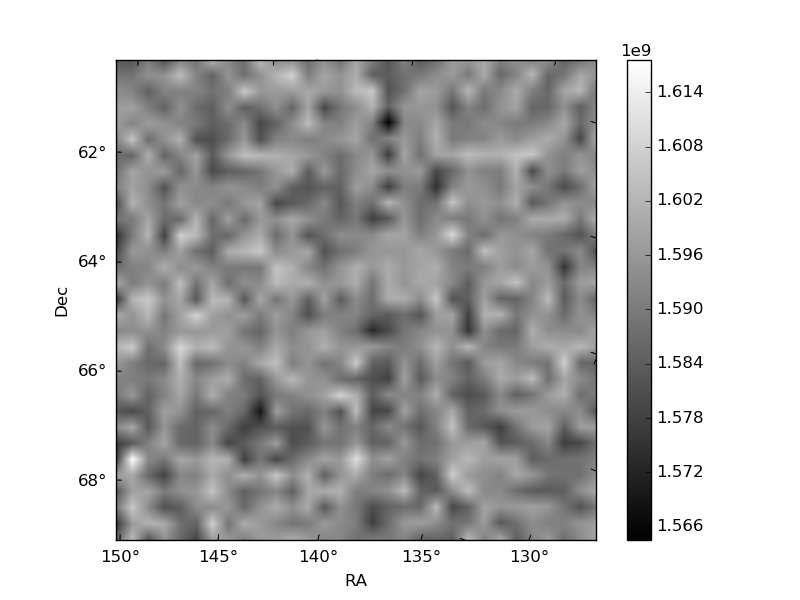
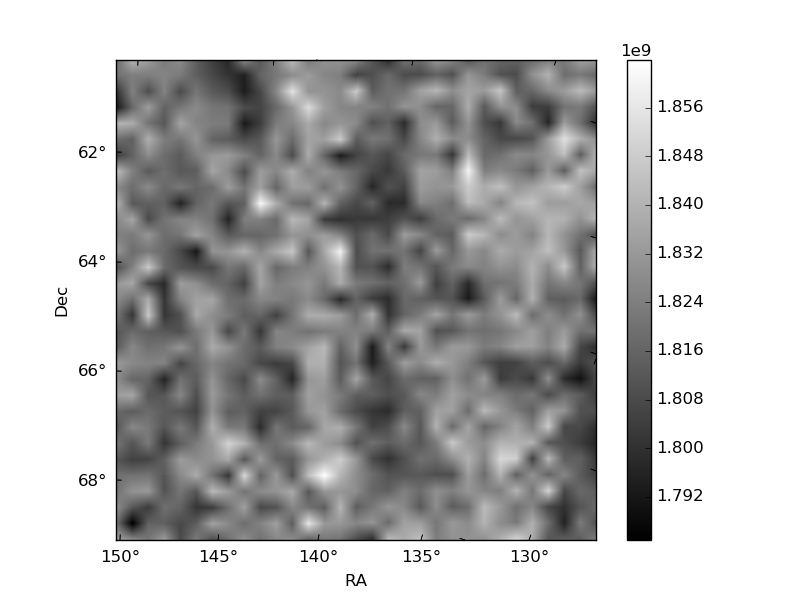
Histogram calculated using DETX and DETY for each event in the final _common_clean file
| Quadrant A | 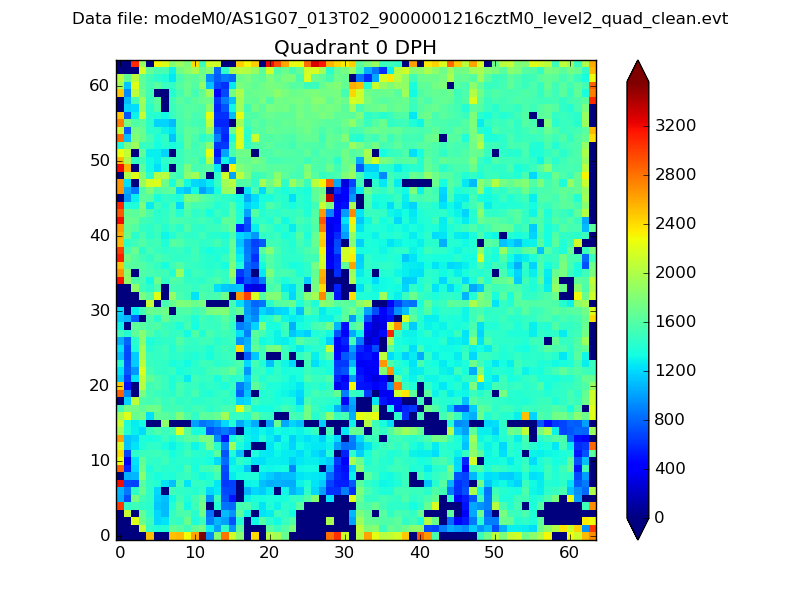 |
 |
Quadrant B |
|---|---|---|---|
| Quadrant D | 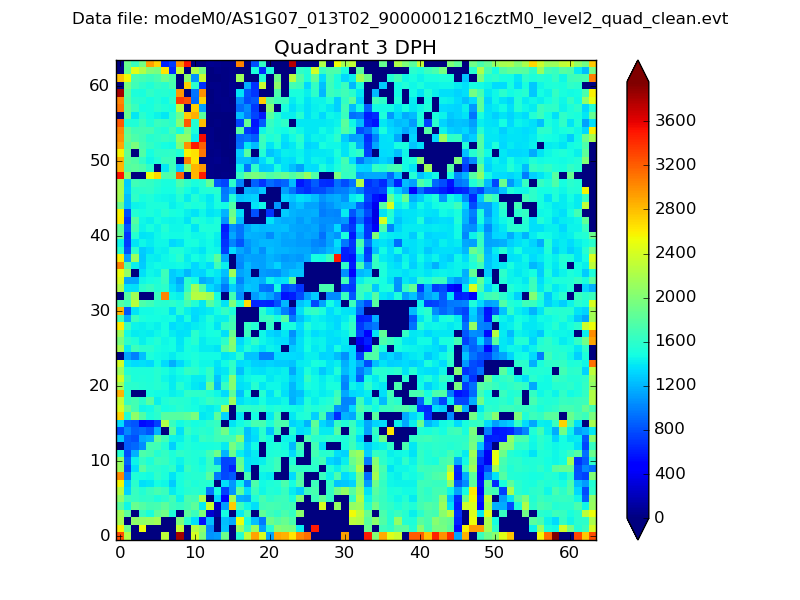 |
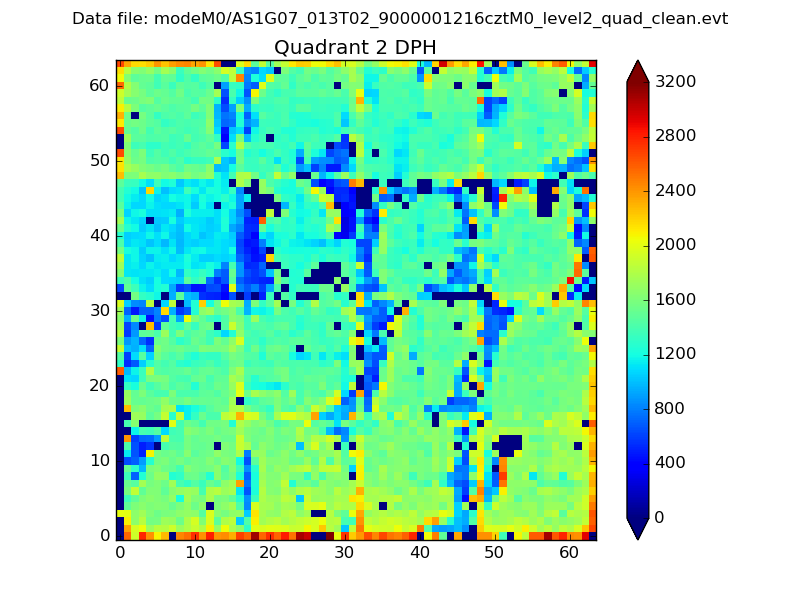 |
Quadrant C |
| Plot type | Count rate plots | Images |
|---|---|---|
| Comparison with Poisson distribution Blue bars denote a histogram of data divided into 1 sec bins. Red curve is a Poisson curve with rate = median count rate of data. |
 |
 |
| Quadrant-wise count rates Data is divided into 100 sec bins |
 |
|
| Module-wise count rates for Quadrant A Data is divided into 100 sec bins |
 |
 |
| Module-wise count rates for Quadrant B Data is divided into 100 sec bins |
 |
 |
| Module-wise count rates for Quadrant C Data is divided into 100 sec bins |
 |
 |
| Module-wise count rates for Quadrant D Data is divided into 100 sec bins |
 |
 |
| Parameter | Plot |
|---|---|
| CZT HV Monitor |  |
| D_VDD | 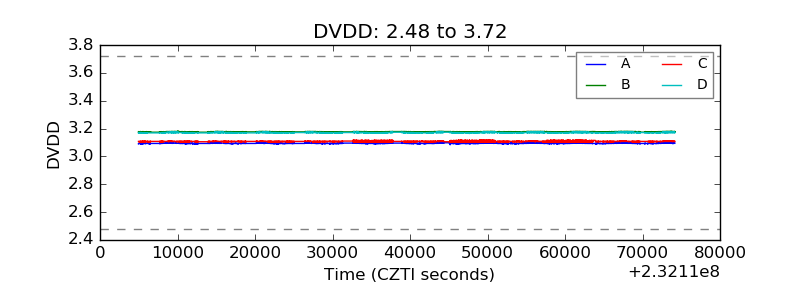 |
| Temperature 1 |  |
| Veto HV Monitor |  |
| Veto LLD |  |
| Alpha Counter | 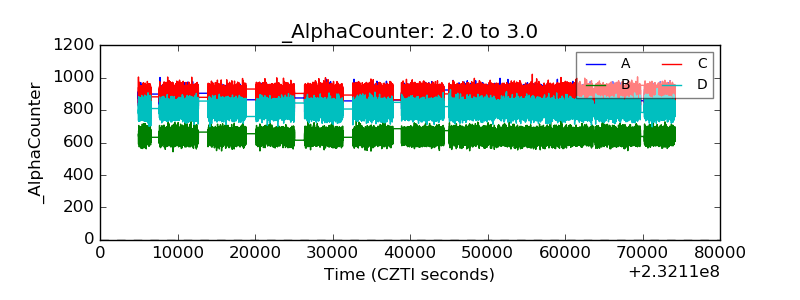 |
| _CPM_Rate |  |
| CZT Counter | 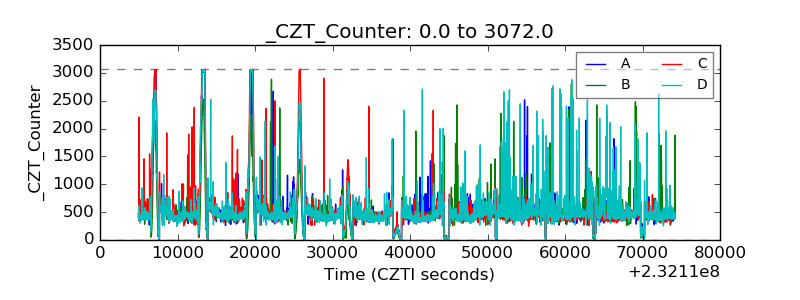 |
| +2.5 Volts monitor |  |
| +5 Volts monitor | 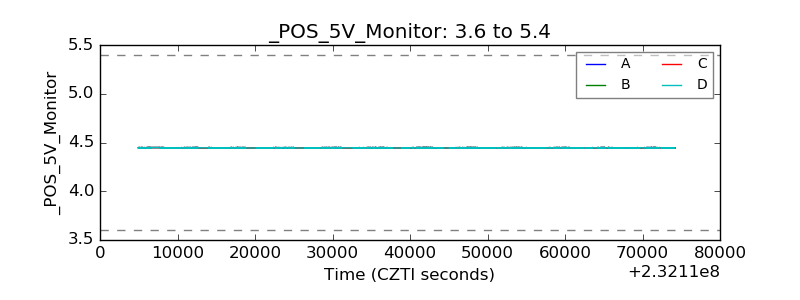 |
| _ROLL_ROT | 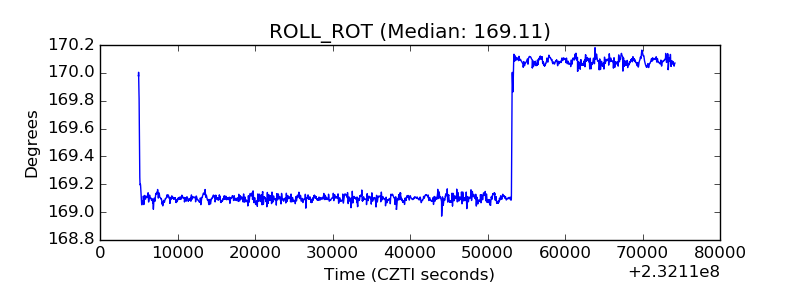 |
| _Roll_DEC | 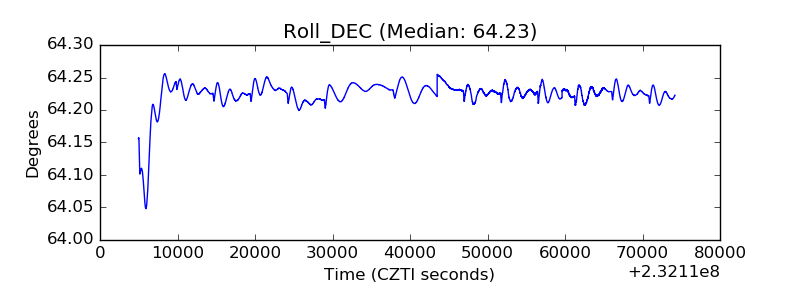 |
| _Roll_RA | 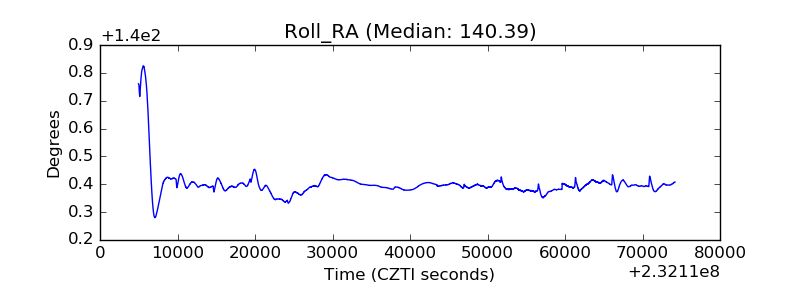 |
| Veto Counter |  |