| Param | Original file | Final file |
|---|---|---|
| Filename | modeM0/AS1G07_013T02_9000001216_08739cztM0_level2.evt | modeM0/AS1G07_013T02_9000001216_08739cztM0_level2_quad_clean.evt |
| Size (bytes) | 217,514,880 | 47,396,160 |
| Size | 207.4 MB | 45.2 MB |
| Events in quadrant A | 1,604,433 | 305,787 |
| Events in quadrant B | 1,562,042 | 311,095 |
| Events in quadrant C | 1,679,406 | 301,865 |
| Events in quadrant D | 1,527,140 | 293,888 |
| Mode SS | |||
|---|---|---|---|
| Quadrant | BADHDUFLAG | Total packets | Discarded packets |
| A | 0 | 64 | 0 |
| B | 0 | 64 | 0 |
| C | 0 | 64 | 0 |
| D | 0 | 64 | 0 |
| Mode M0 | |||
|---|---|---|---|
| Quadrant | BADHDUFLAG | Total packets | Discarded packets |
| A | 0 | 6844 | 2 |
| B | 0 | 6675 | 1 |
| C | 0 | 7018 | 1 |
| D | 0 | 6735 | 1 |
| Mode M9 | |||
|---|---|---|---|
| Quadrant | BADHDUFLAG | Total packets | Discarded packets |
| A | 0 | 11 | 0 |
| B | 0 | 11 | 0 |
| C | 0 | 11 | 0 |
| D | 0 | 11 | 0 |
| Quadrant | Total seconds | Saturated seconds | Saturation percentage |
|---|---|---|---|
| A | 3127 | 65 | 2.078670% |
| B | 3127 | 51 | 1.630956% |
| C | 3127 | 66 | 2.110649% |
| D | 3127 | 62 | 1.982731% |
Noise dominated data is calculated using 1-second bins in cleaned event files. If a bin has >2000 counts, and if more than 50% of those come from <1% of pixels, then it is considered to be noise-dominated and hence unusable.
| Quadrant | # 1 sec bins | Bins with >0 counts | Bins with >2000 counts | High rate bins dominated by noise | Noise dominated (total time) | Noise dominated (detector-on time) | Marked lightcurve |
|---|---|---|---|---|---|---|---|
| A | 4232 | 3127 | 5 | 5 | 0.12% | 0.16% | 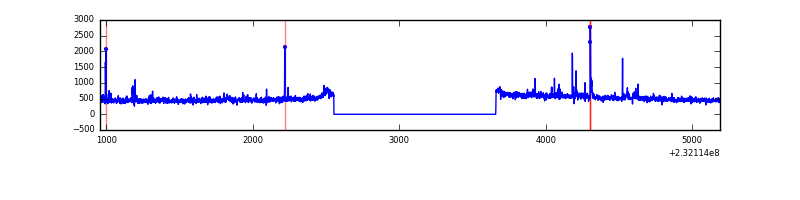 |
| B | 4232 | 3127 | 0 | 0 | 0.00% | 0.00% | 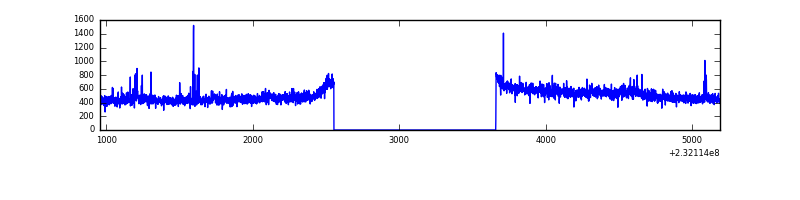 |
| C | 4232 | 3127 | 21 | 21 | 0.50% | 0.67% | 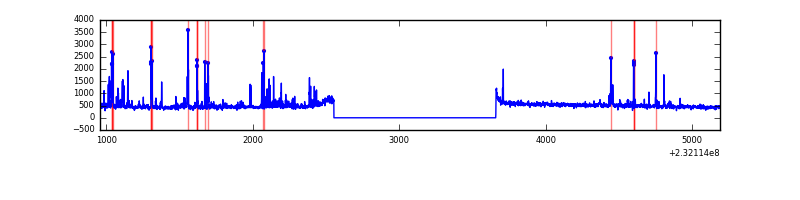 |
| D | 4232 | 3127 | 4 | 4 | 0.09% | 0.13% | 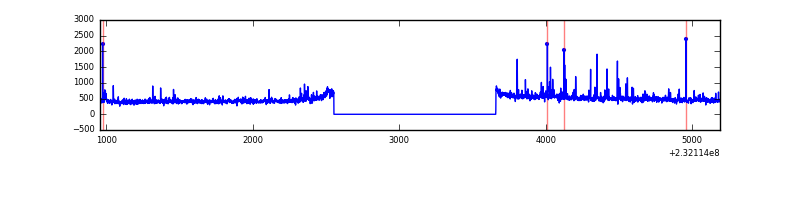 |
Top three noisy pixels from each quadrant. If the there are fewer than three noisy pixels in the level2.evt file, extra rows are filled as -1
| Pixel properties | Quadrant properties | ||||||
|---|---|---|---|---|---|---|---|
| Quadrant | DetID | PixID | Counts | Sigma | Mean | Median | Sigma |
| A | 13 | 251 | 97165 | 1219.74 | 386 | 378 | 79.4 |
| A | 15 | 174 | 16548 | 203.78 | 386 | 378 | 79.4 |
| A | 5 | 16 | 5678 | 66.79 | 386 | 378 | 79.4 |
| B | 0 | 214 | 15575 | 202.36 | 388 | 380 | 75.1 |
| B | 0 | 219 | 9277 | 118.49 | 388 | 380 | 75.1 |
| B | 4 | 48 | 7702 | 97.51 | 388 | 380 | 75.1 |
| C | 4 | 254 | 120909 | 1375.91 | 375 | 377 | 87.6 |
| C | 1 | 16 | 53777 | 609.58 | 375 | 377 | 87.6 |
| C | 14 | 234 | 31145 | 351.23 | 375 | 377 | 87.6 |
| D | 2 | 152 | 34870 | 344.13 | 372 | 363 | 100.3 |
| D | 7 | 71 | 27255 | 268.19 | 372 | 363 | 100.3 |
| D | 2 | 14 | 20604 | 201.86 | 372 | 363 | 100.3 |
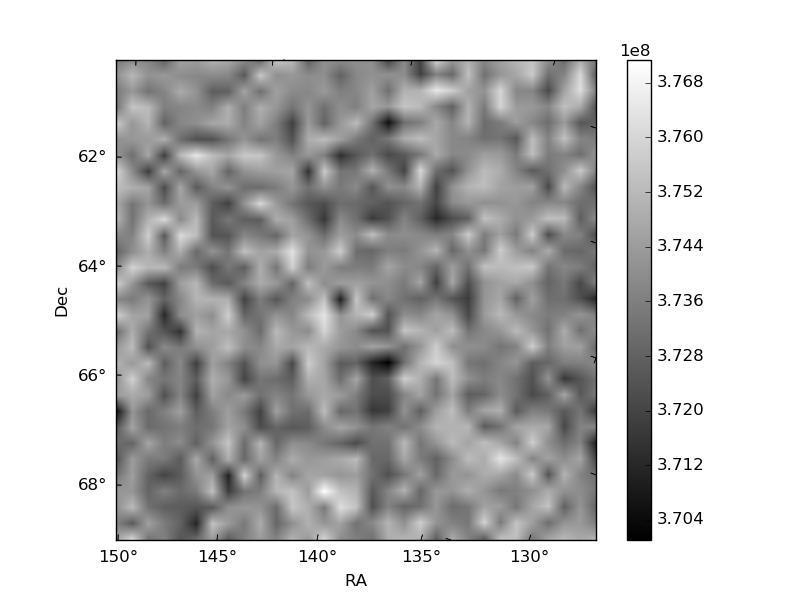
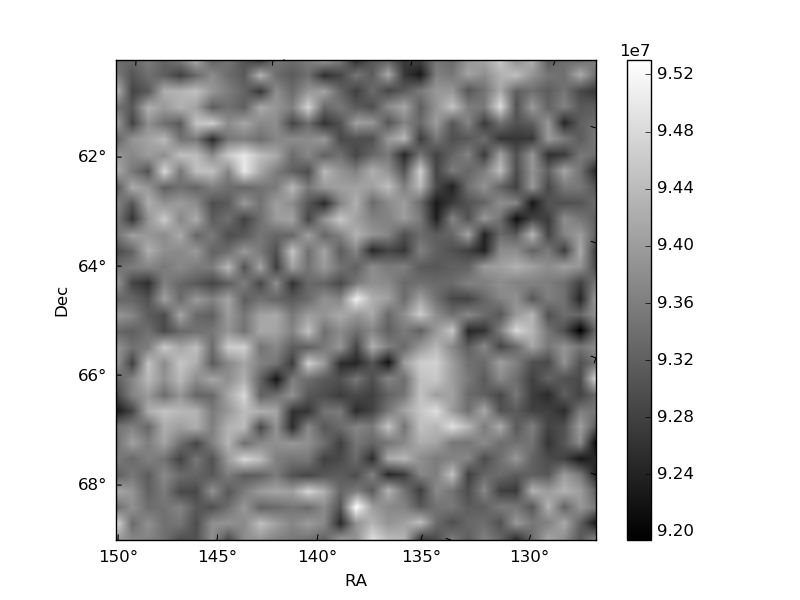
Histogram calculated using DETX and DETY for each event in the final _common_clean file
| Quadrant A | 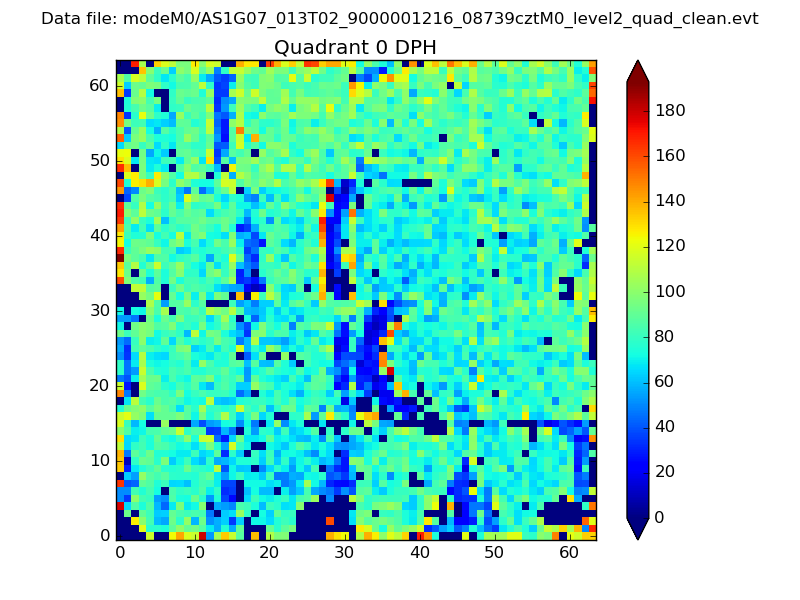 |
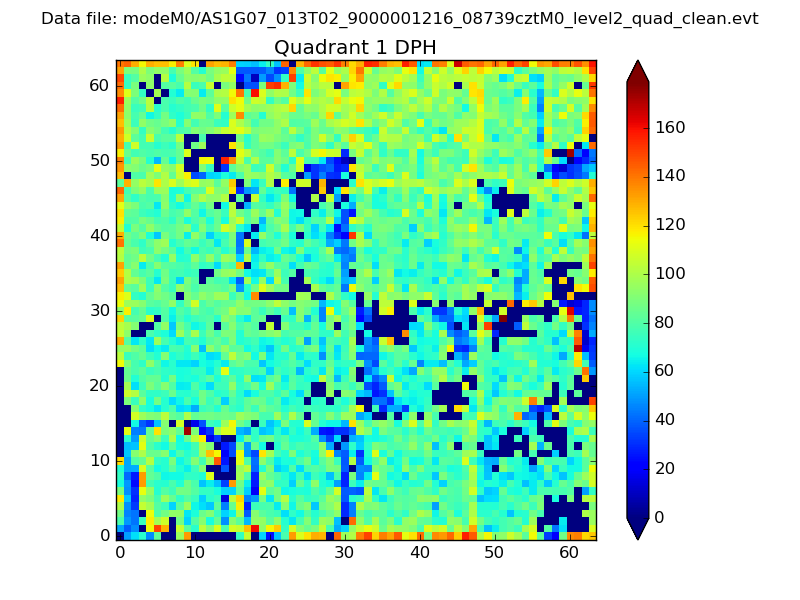 |
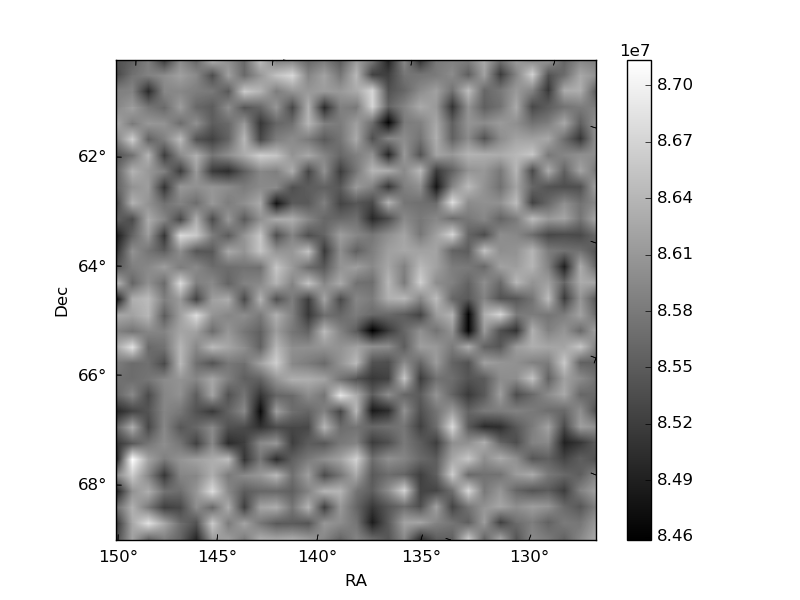
Quadrant B |
|---|---|---|---|
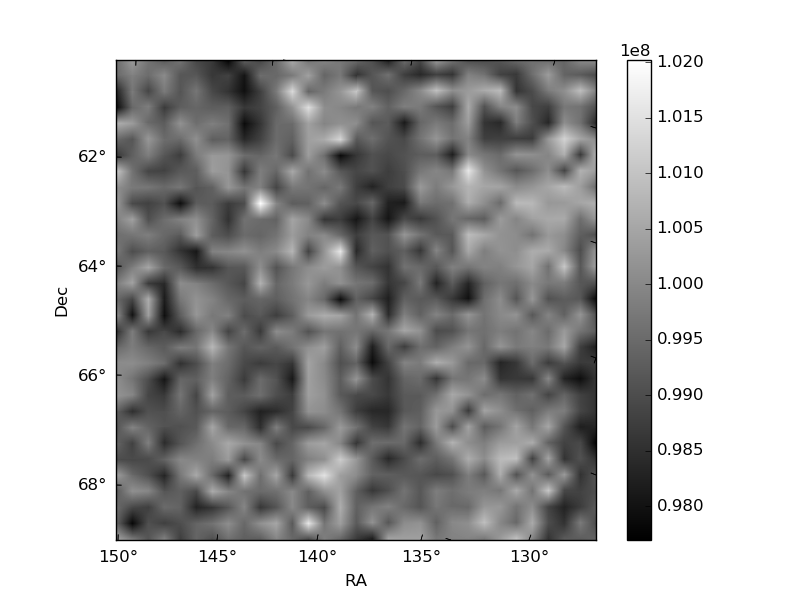
| Quadrant D | 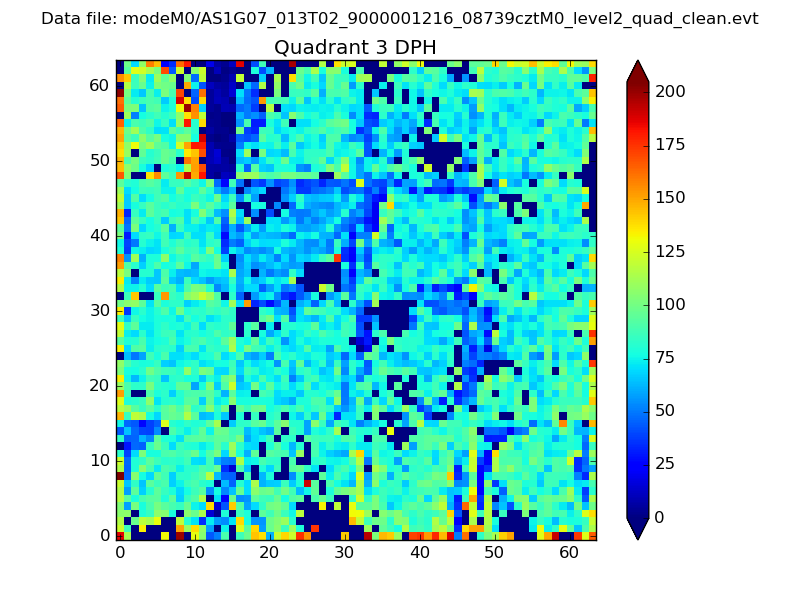 |
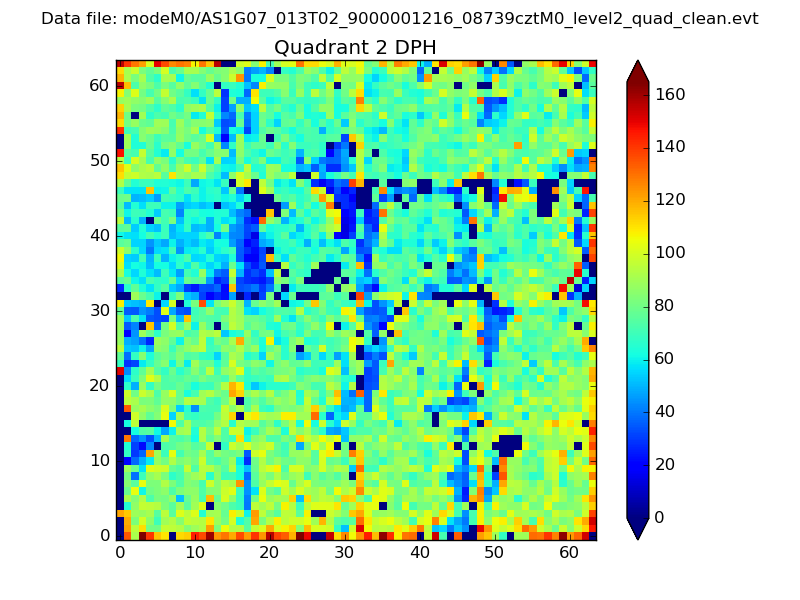 |
Quadrant C |
| Plot type | Count rate plots | Images |
|---|---|---|
| Comparison with Poisson distribution Blue bars denote a histogram of data divided into 1 sec bins. Red curve is a Poisson curve with rate = median count rate of data. |
 |
 |
| Quadrant-wise count rates Data is divided into 100 sec bins |
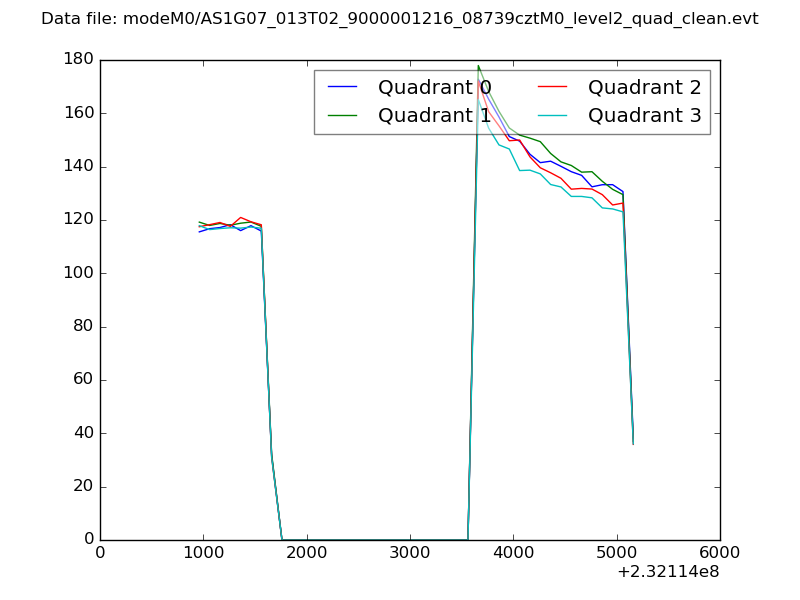 |
|
| Module-wise count rates for Quadrant A Data is divided into 100 sec bins |
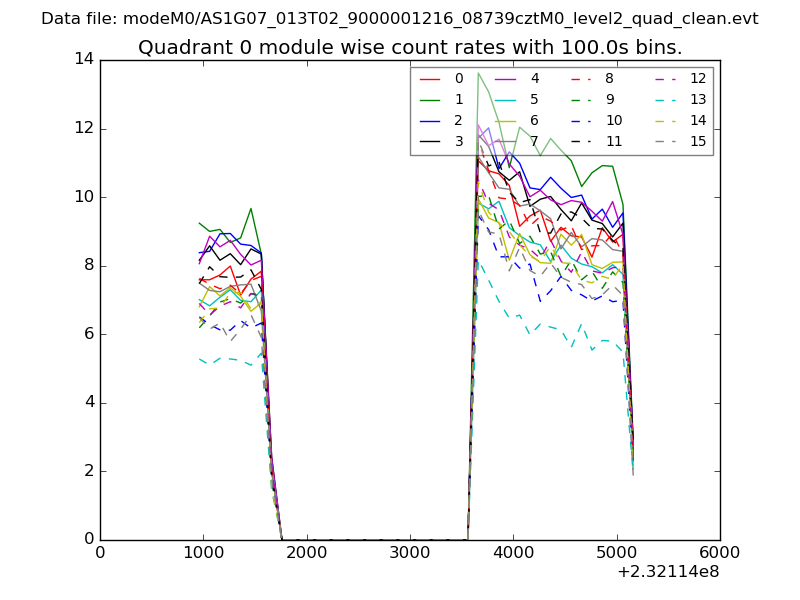 |
 |
| Module-wise count rates for Quadrant B Data is divided into 100 sec bins |
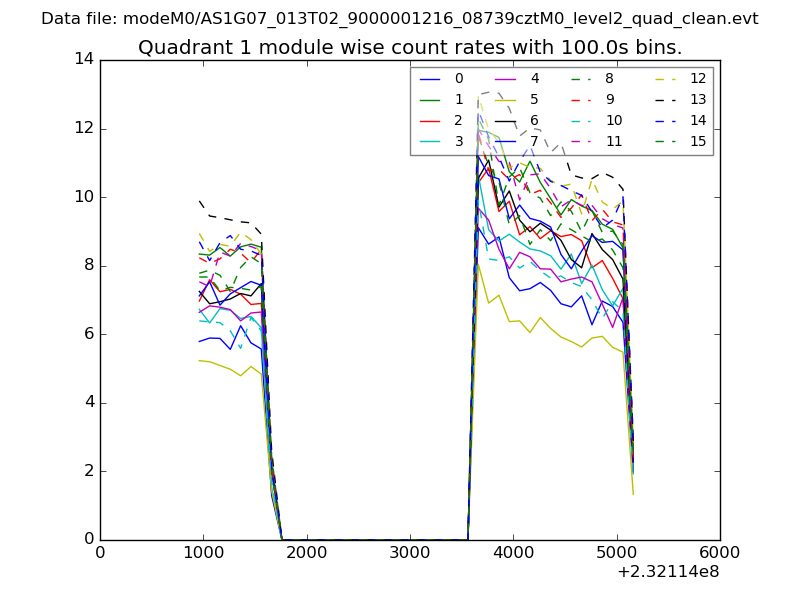 |
 |
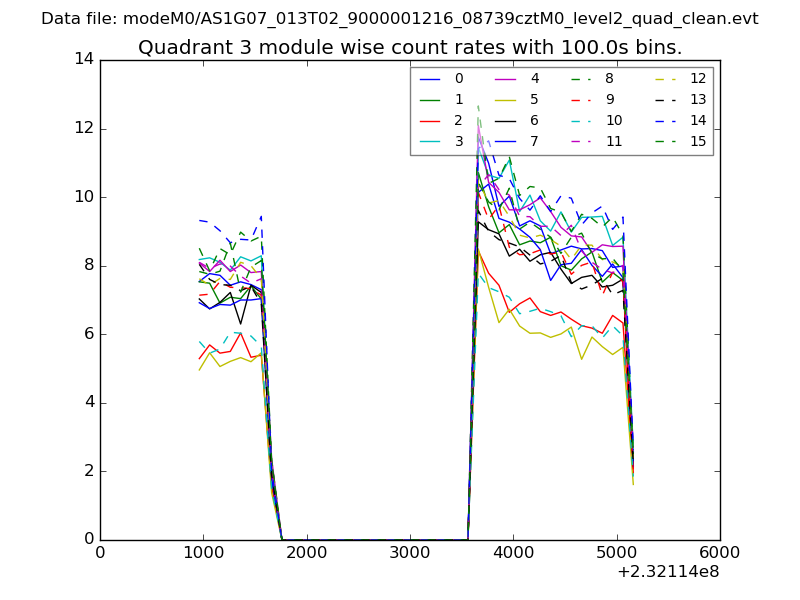
| Module-wise count rates for Quadrant C Data is divided into 100 sec bins |
 |
 |
| Module-wise count rates for Quadrant D Data is divided into 100 sec bins |
 |
 |
| Parameter | Plot |
|---|---|
| CZT HV Monitor | 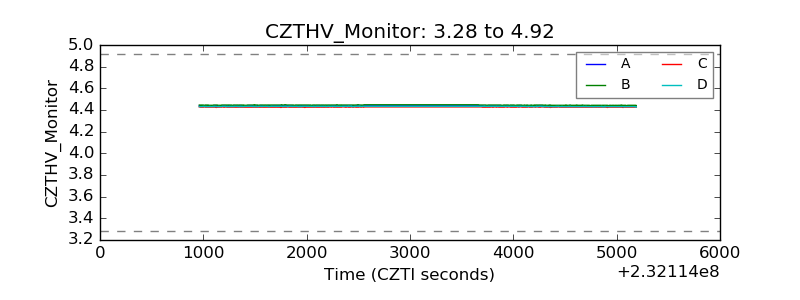 |
| D_VDD | 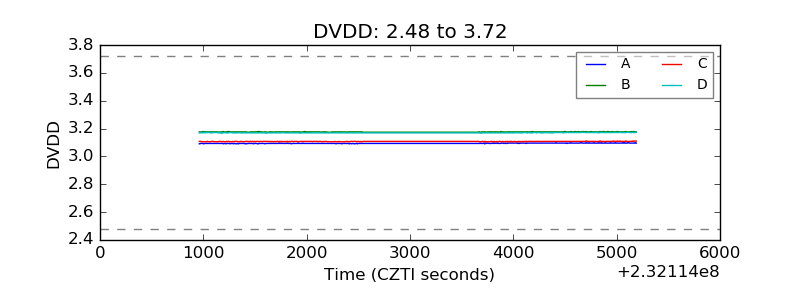 |
| Temperature 1 |  |
| Veto HV Monitor | 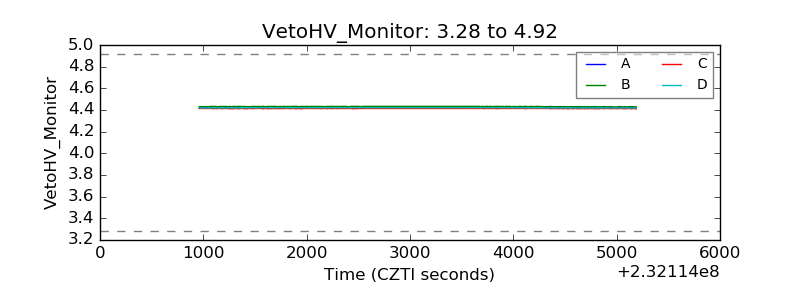 |
| Veto LLD | 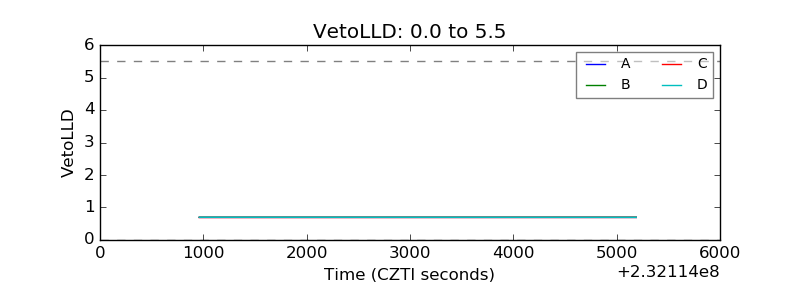 |
| Alpha Counter | 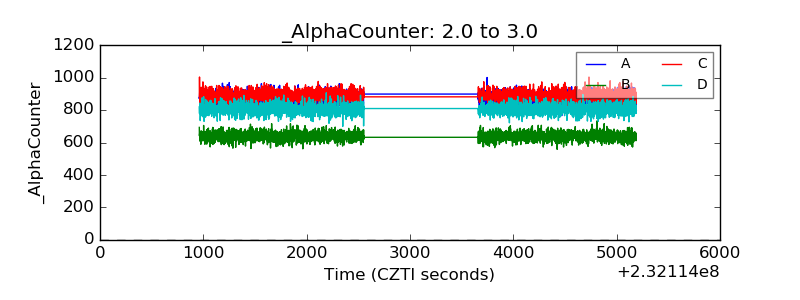 |
| _CPM_Rate | 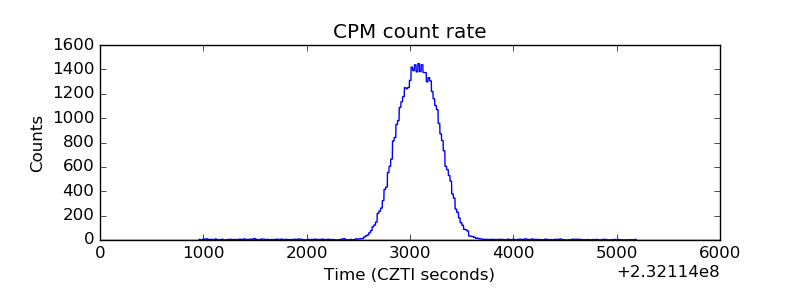 |
| CZT Counter | 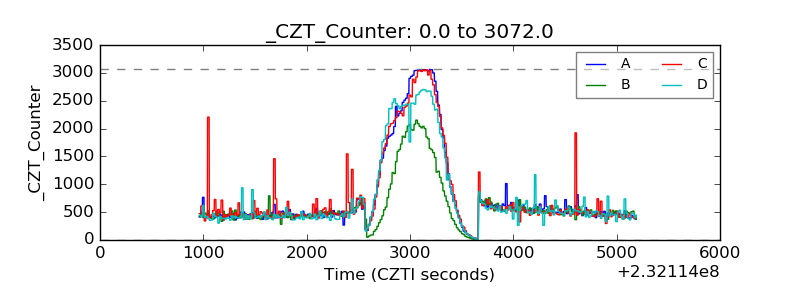 |
| +2.5 Volts monitor |  |
| +5 Volts monitor | 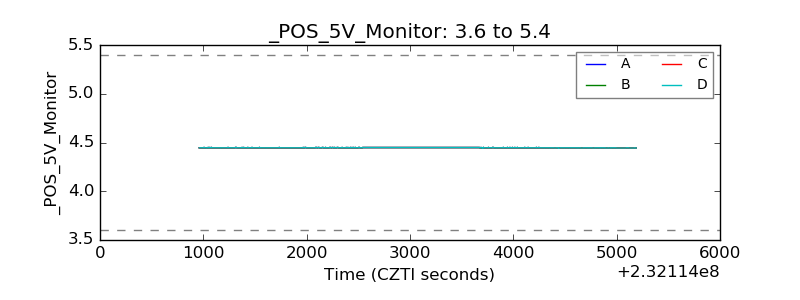 |
| _ROLL_ROT |  |
| _Roll_DEC | 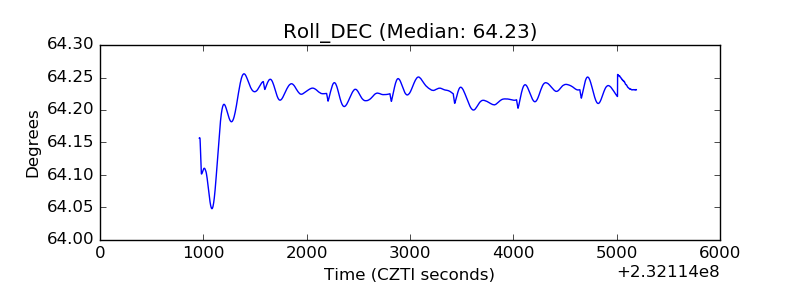 |
| _Roll_RA | 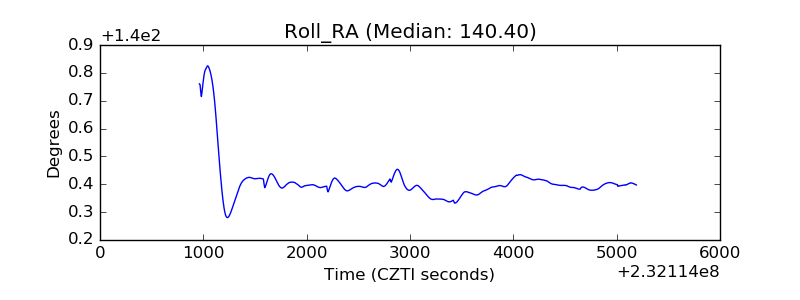 |
| Veto Counter |  |