| Param | Original file | Final file |
|---|---|---|
| Filename | modeM0/AS1G07_013T02_9000001216_08741cztM0_level2.evt | modeM0/AS1G07_013T02_9000001216_08741cztM0_level2_quad_clean.evt |
| Size (bytes) | 426,945,600 | 103,717,440 |
| Size | 407.2 MB | 98.9 MB |
| Events in quadrant A | 3,074,296 | 681,461 |
| Events in quadrant B | 3,038,815 | 694,502 |
| Events in quadrant C | 3,280,331 | 685,024 |
| Events in quadrant D | 3,120,893 | 653,241 |
| Mode SS | |||
|---|---|---|---|
| Quadrant | BADHDUFLAG | Total packets | Discarded packets |
| A | 0 | 124 | 0 |
| B | 0 | 124 | 0 |
| C | 0 | 124 | 0 |
| D | 0 | 124 | 0 |
| Mode M0 | |||
|---|---|---|---|
| Quadrant | BADHDUFLAG | Total packets | Discarded packets |
| A | 0 | 13152 | 3 |
| B | 0 | 13045 | 2 |
| C | 0 | 13742 | 2 |
| D | 0 | 13444 | 2 |
| Mode M9 | |||
|---|---|---|---|
| Quadrant | BADHDUFLAG | Total packets | Discarded packets |
| A | 0 | 13 | 0 |
| B | 0 | 13 | 0 |
| C | 0 | 13 | 0 |
| D | 0 | 13 | 0 |
| Quadrant | Total seconds | Saturated seconds | Saturation percentage |
|---|---|---|---|
| A | 6116 | 37 | 0.604971% |
| B | 6116 | 38 | 0.621321% |
| C | 6116 | 80 | 1.308044% |
| D | 6116 | 66 | 1.079137% |
Noise dominated data is calculated using 1-second bins in cleaned event files. If a bin has >2000 counts, and if more than 50% of those come from <1% of pixels, then it is considered to be noise-dominated and hence unusable.
| Quadrant | # 1 sec bins | Bins with >0 counts | Bins with >2000 counts | High rate bins dominated by noise | Noise dominated (total time) | Noise dominated (detector-on time) | Marked lightcurve |
|---|---|---|---|---|---|---|---|
| A | 7411 | 6116 | 1 | 1 | 0.01% | 0.02% | 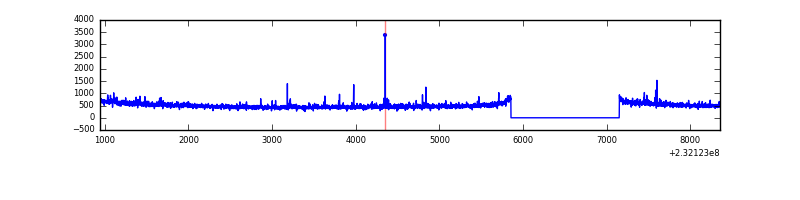 |
| B | 7411 | 6117 | 2 | 2 | 0.03% | 0.03% | 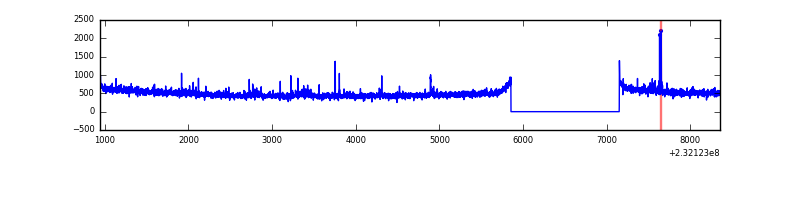 |
| C | 7411 | 6116 | 31 | 31 | 0.42% | 0.51% | 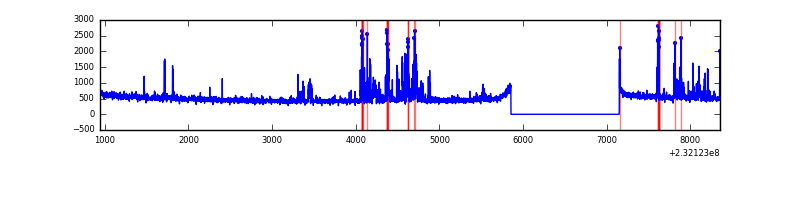 |
| D | 7411 | 6116 | 16 | 16 | 0.22% | 0.26% | 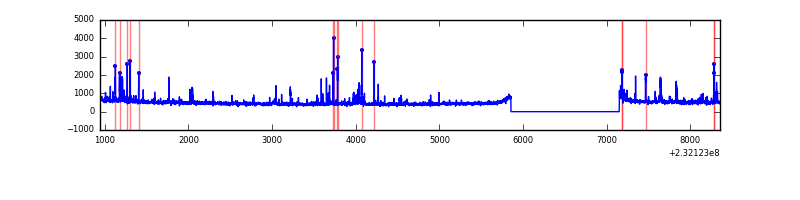 |
Top three noisy pixels from each quadrant. If the there are fewer than three noisy pixels in the level2.evt file, extra rows are filled as -1
| Pixel properties | Quadrant properties | ||||||
|---|---|---|---|---|---|---|---|
| Quadrant | DetID | PixID | Counts | Sigma | Mean | Median | Sigma |
| A | 13 | 251 | 103520 | 675.76 | 756 | 740 | 152.1 |
| A | 13 | 14 | 51042 | 330.72 | 756 | 740 | 152.1 |
| A | 5 | 16 | 7624 | 45.26 | 756 | 740 | 152.1 |
| B | 0 | 219 | 40006 | 279.54 | 760 | 741 | 140.5 |
| B | 0 | 230 | 13358 | 89.82 | 760 | 741 | 140.5 |
| B | 0 | 214 | 13307 | 89.46 | 760 | 741 | 140.5 |
| C | 4 | 254 | 352426 | 2080.87 | 744 | 749 | 169.0 |
| C | 14 | 234 | 10886 | 59.98 | 744 | 749 | 169.0 |
| C | 13 | 61 | 5888 | 30.41 | 744 | 749 | 169.0 |
| D | 2 | 152 | 83953 | 470.6 | 743 | 720 | 176.9 |
| D | 1 | 52 | 82034 | 459.75 | 743 | 720 | 176.9 |
| D | 7 | 71 | 51551 | 287.4 | 743 | 720 | 176.9 |
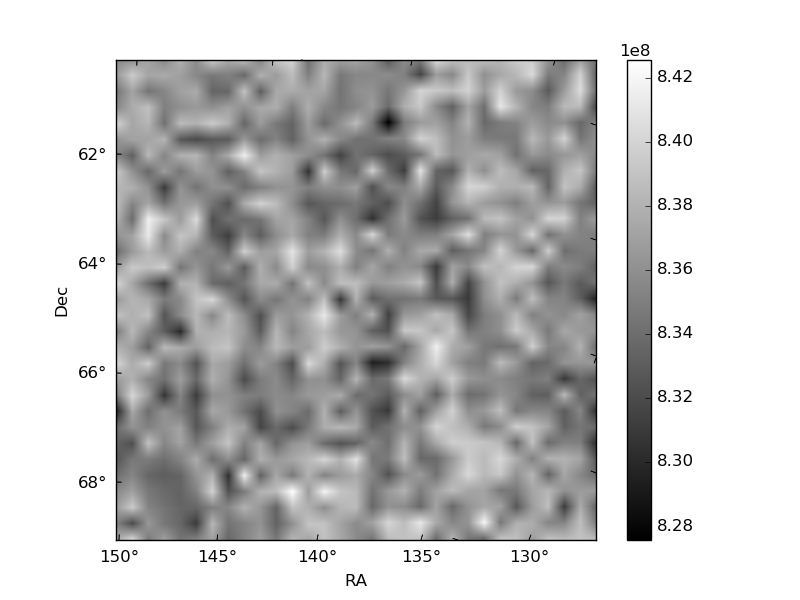
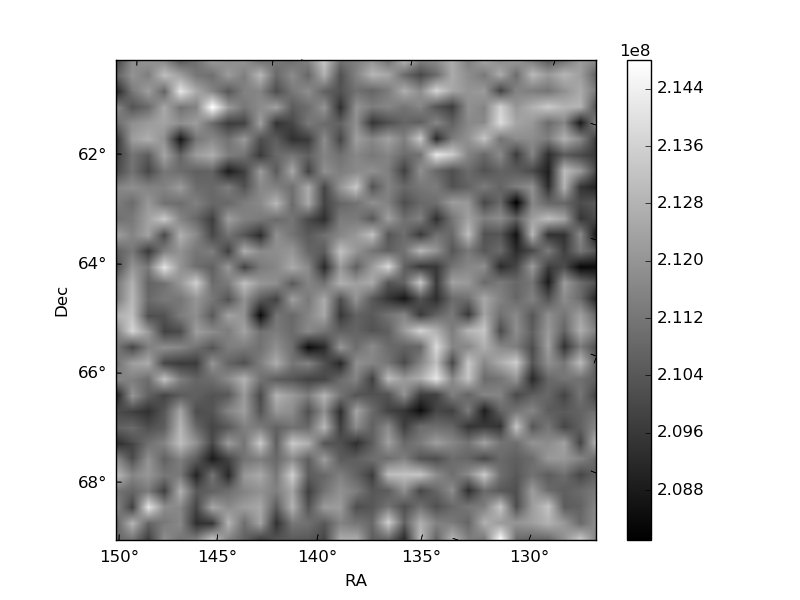
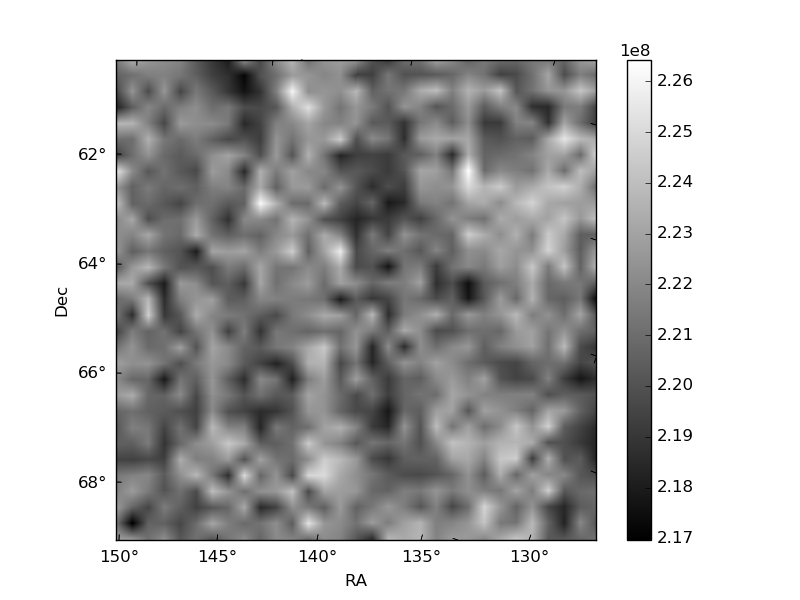
Histogram calculated using DETX and DETY for each event in the final _common_clean file
| Quadrant A | 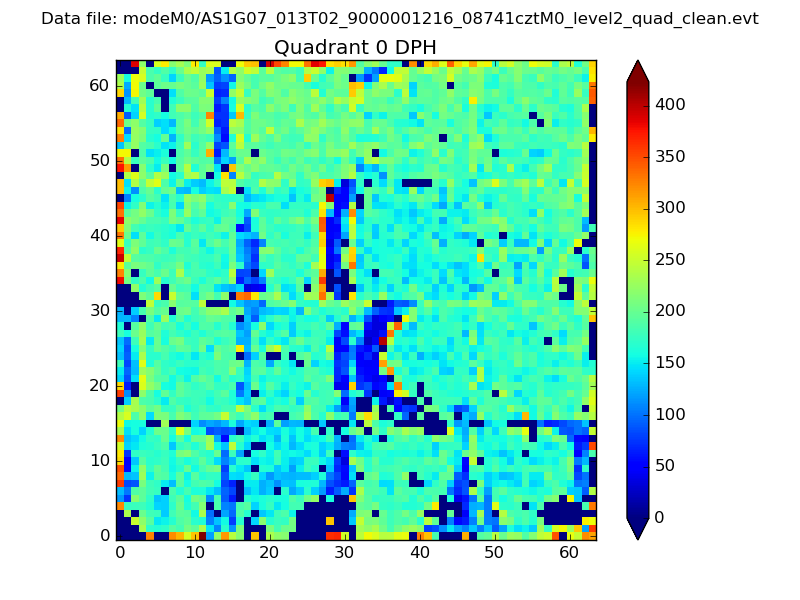 |
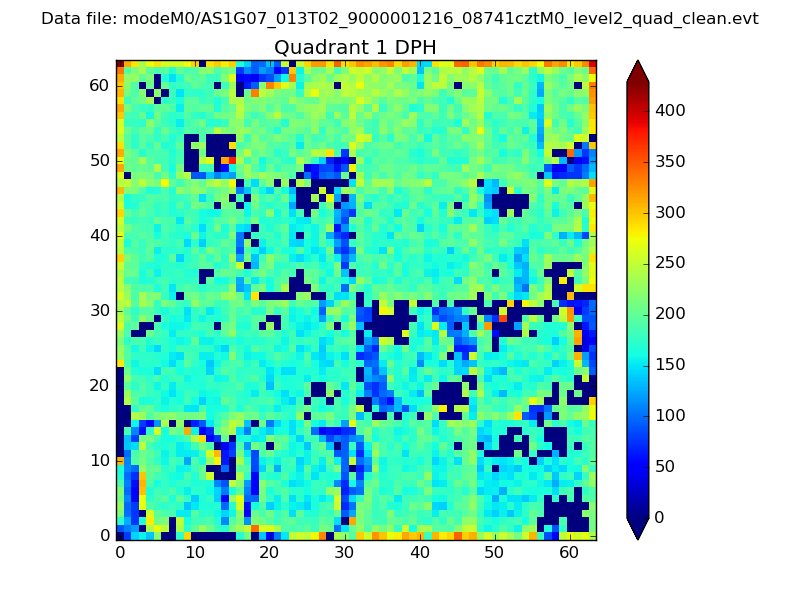 |
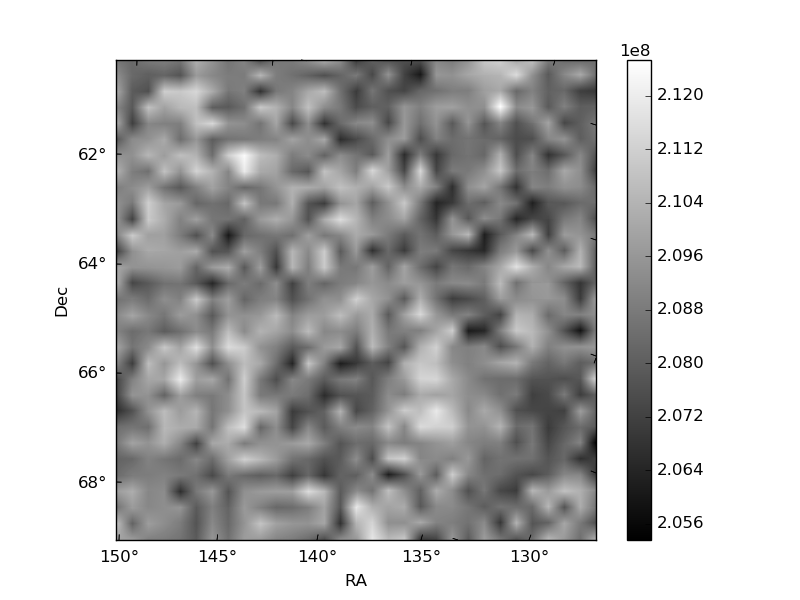
Quadrant B |
|---|---|---|---|
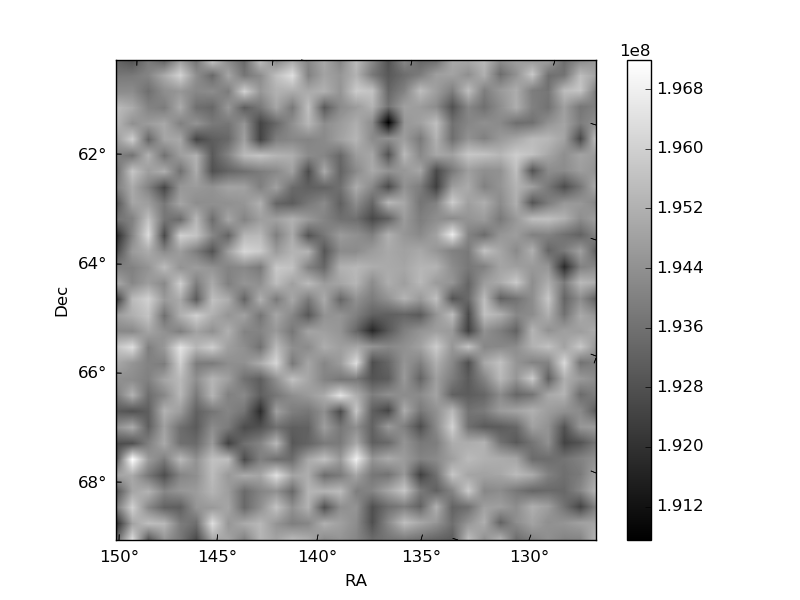
| Quadrant D | 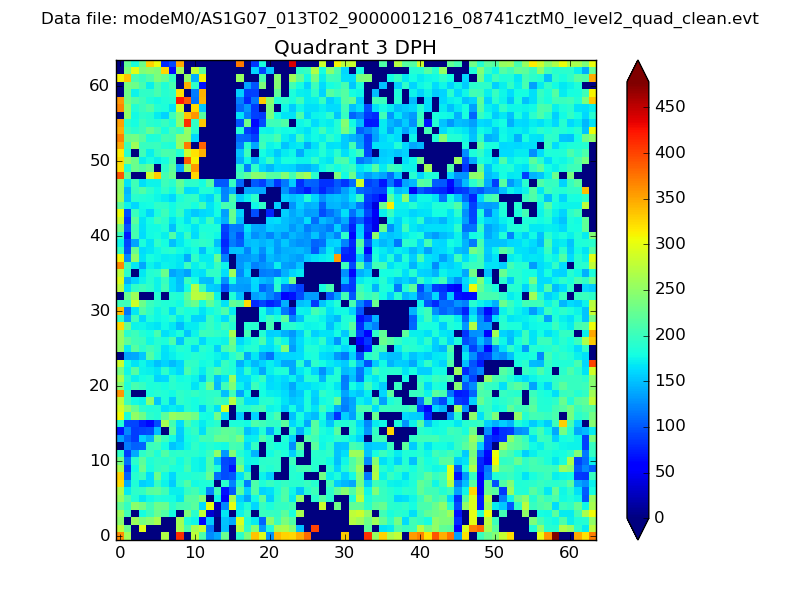 |
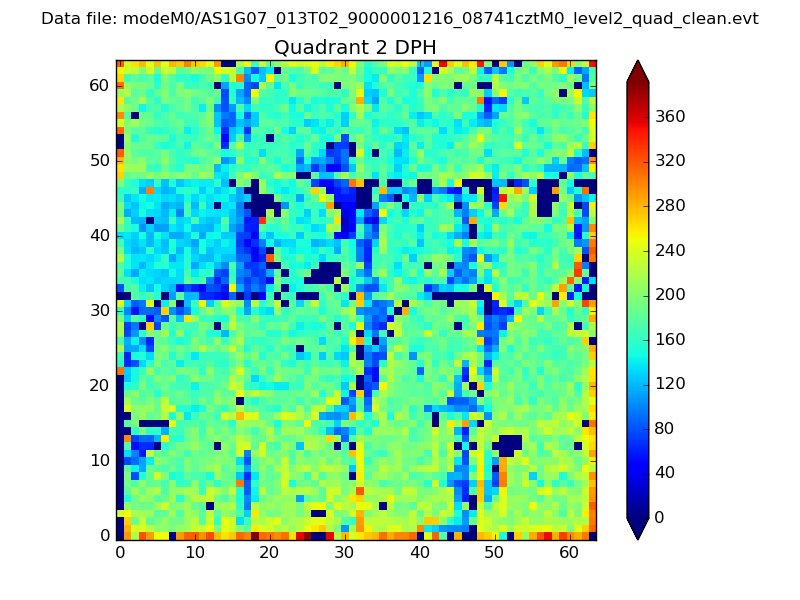 |
Quadrant C |
| Plot type | Count rate plots | Images |
|---|---|---|
| Comparison with Poisson distribution Blue bars denote a histogram of data divided into 1 sec bins. Red curve is a Poisson curve with rate = median count rate of data. |
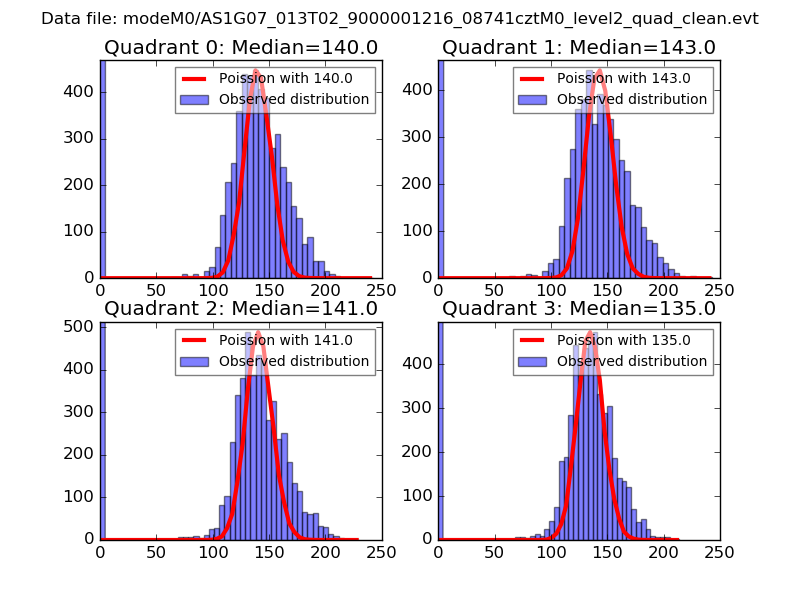 |
 |
| Quadrant-wise count rates Data is divided into 100 sec bins |
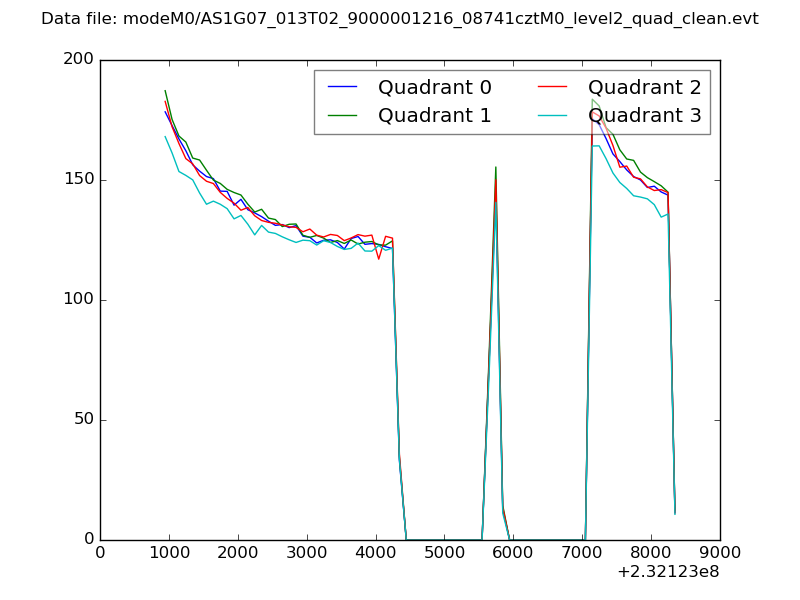 |
|
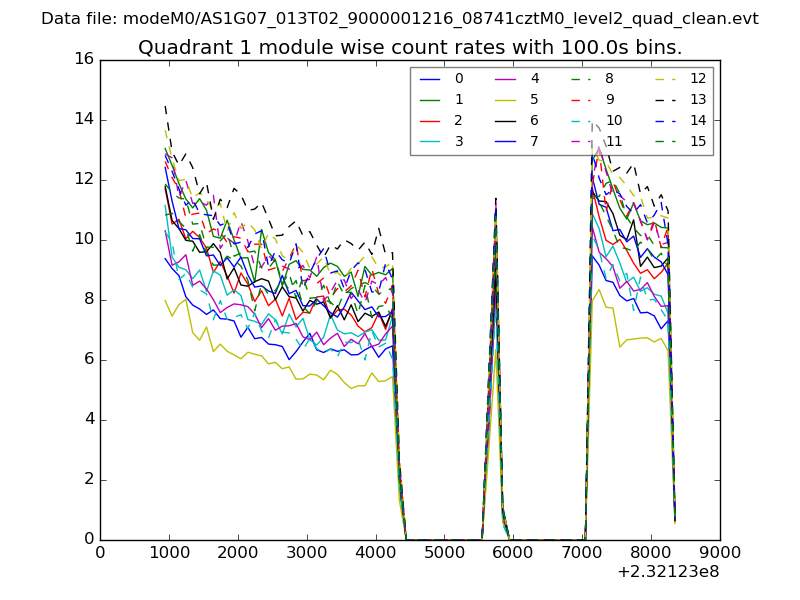
| Module-wise count rates for Quadrant A Data is divided into 100 sec bins |
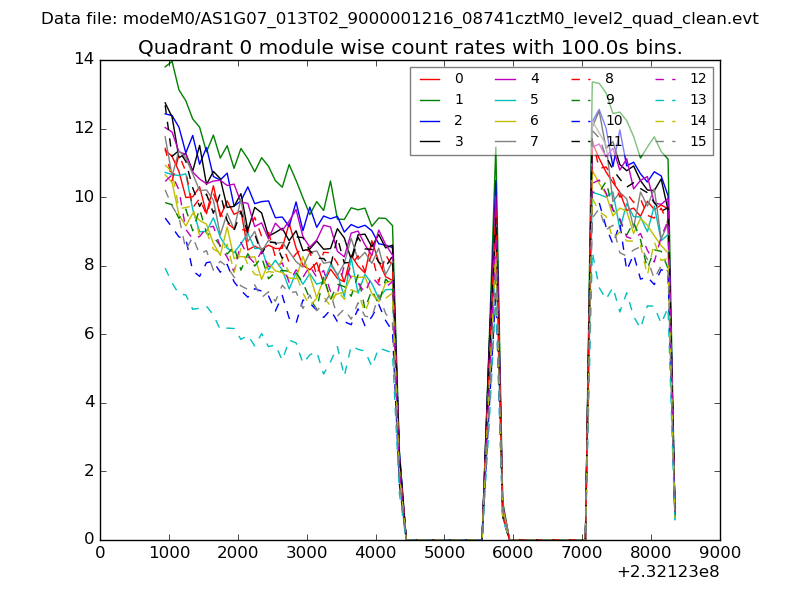 |
 |
| Module-wise count rates for Quadrant B Data is divided into 100 sec bins |
 |
 |
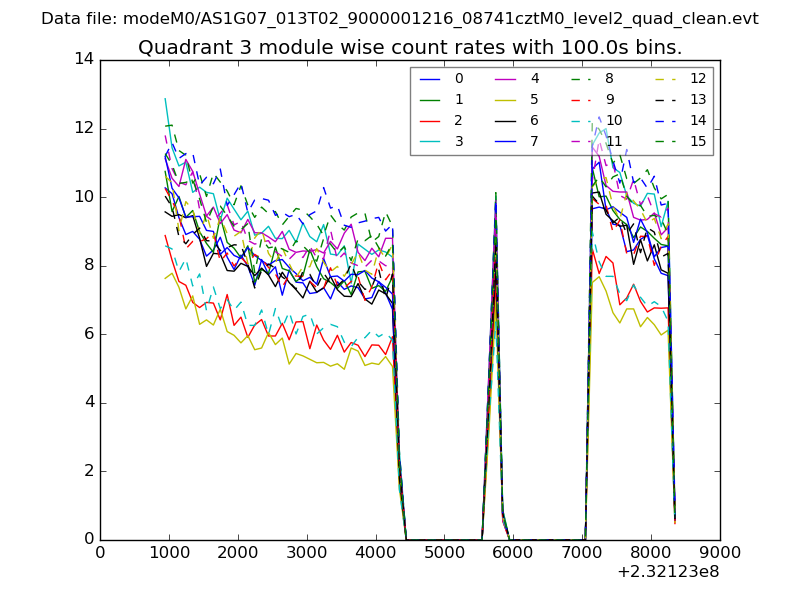
| Module-wise count rates for Quadrant C Data is divided into 100 sec bins |
 |
 |
| Module-wise count rates for Quadrant D Data is divided into 100 sec bins |
 |
 |
| Parameter | Plot |
|---|---|
| CZT HV Monitor | 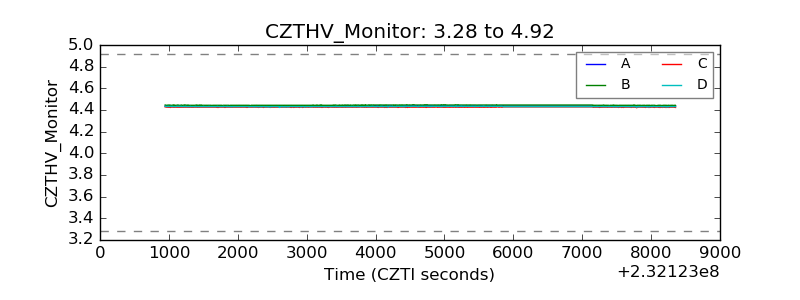 |
| D_VDD | 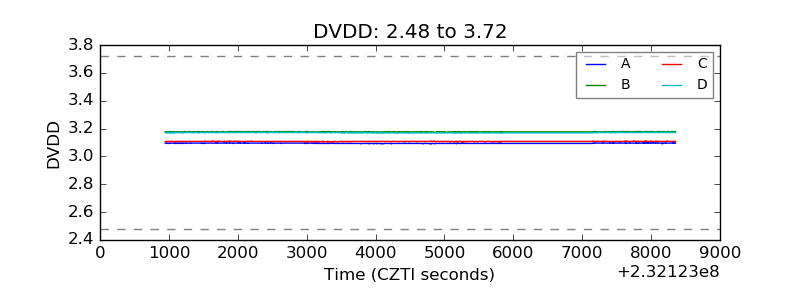 |
| Temperature 1 | 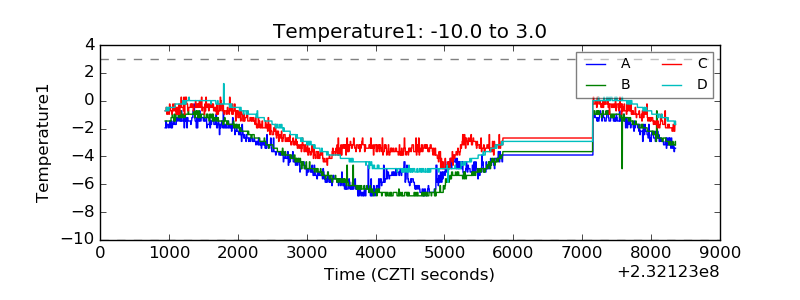 |
| Veto HV Monitor | 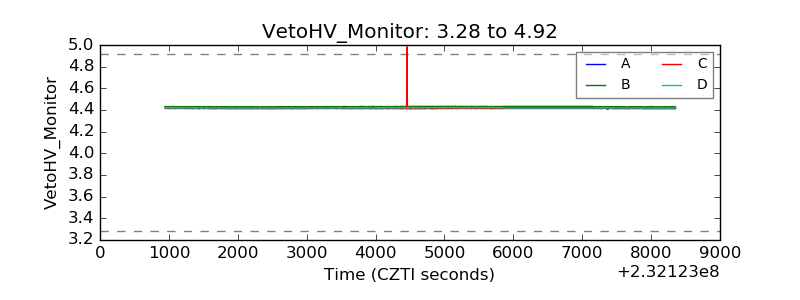 |
| Veto LLD | 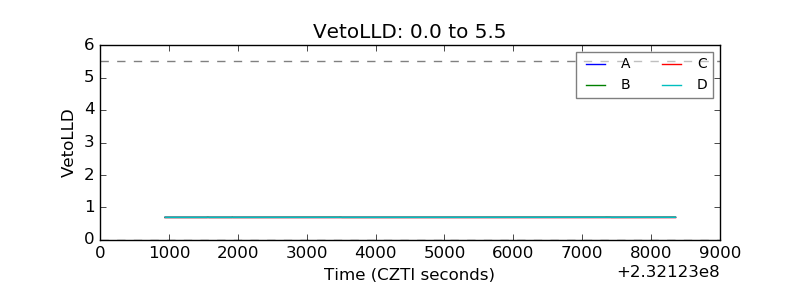 |
| Alpha Counter | 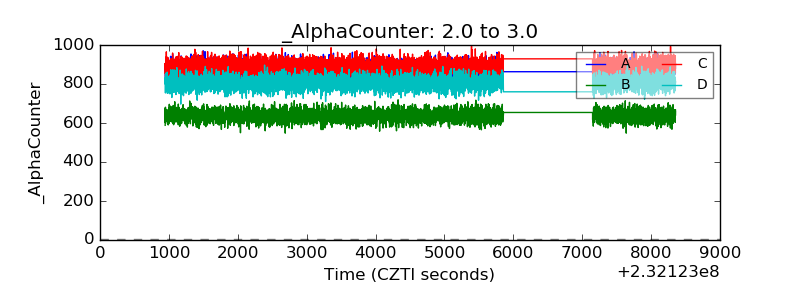 |
| _CPM_Rate | 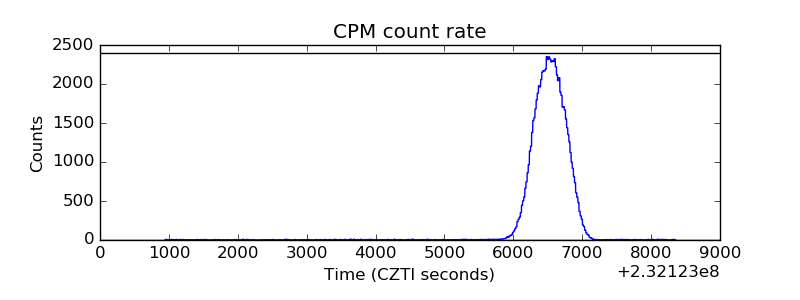 |
| CZT Counter | 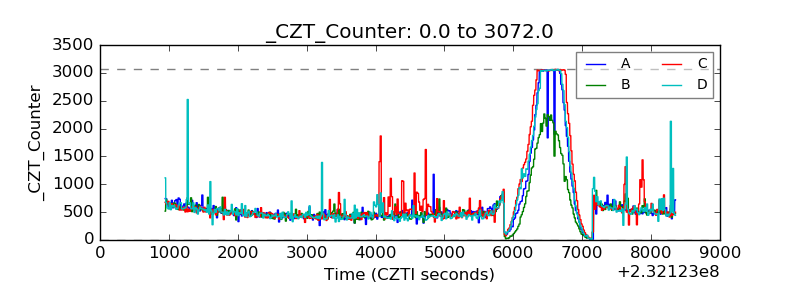 |
| +2.5 Volts monitor |  |
| +5 Volts monitor |  |
| _ROLL_ROT | 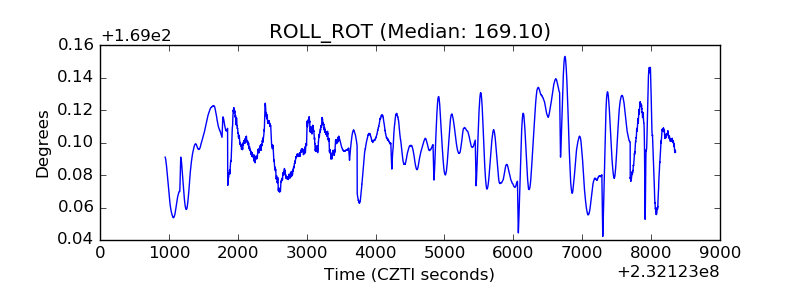 |
| _Roll_DEC | 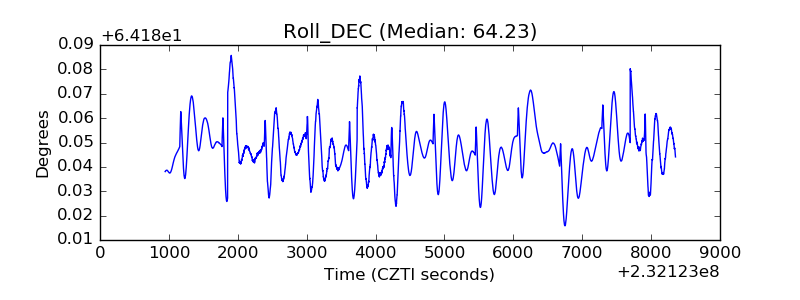 |
| _Roll_RA | 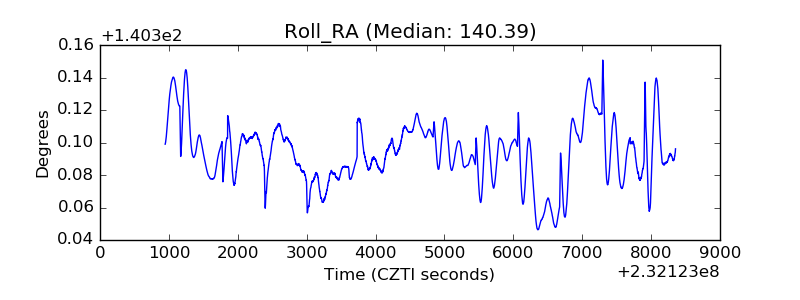 |
| Veto Counter | 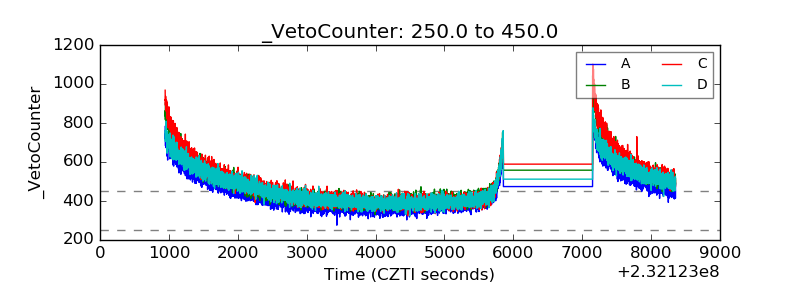 |