| Param | Original file | Final file |
|---|---|---|
| Filename | modeM0/AS1G07_013T02_9000001216_08744cztM0_level2.evt | modeM0/AS1G07_013T02_9000001216_08744cztM0_level2_quad_clean.evt |
| Size (bytes) | 419,391,360 | 103,112,640 |
| Size | 400.0 MB | 98.3 MB |
| Events in quadrant A | 3,005,456 | 662,036 |
| Events in quadrant B | 3,080,519 | 679,651 |
| Events in quadrant C | 3,060,375 | 674,367 |
| Events in quadrant D | 3,107,135 | 647,751 |
| Mode SS | |||
|---|---|---|---|
| Quadrant | BADHDUFLAG | Total packets | Discarded packets |
| A | 0 | 134 | 0 |
| B | 0 | 134 | 0 |
| C | 0 | 134 | 0 |
| D | 0 | 134 | 0 |
| Mode M0 | |||
|---|---|---|---|
| Quadrant | BADHDUFLAG | Total packets | Discarded packets |
| A | 0 | 13590 | 3 |
| B | 0 | 13755 | 2 |
| C | 0 | 13708 | 2 |
| D | 0 | 14027 | 2 |
| Mode M9 | |||
|---|---|---|---|
| Quadrant | BADHDUFLAG | Total packets | Discarded packets |
| A | 0 | 16 | 0 |
| B | 0 | 16 | 0 |
| C | 0 | 16 | 0 |
| D | 0 | 17 | 0 |
| Quadrant | Total seconds | Saturated seconds | Saturation percentage |
|---|---|---|---|
| A | 6582 | 27 | 0.410210% |
| B | 6582 | 29 | 0.440596% |
| C | 6582 | 28 | 0.425403% |
| D | 6582 | 26 | 0.395017% |
Noise dominated data is calculated using 1-second bins in cleaned event files. If a bin has >2000 counts, and if more than 50% of those come from <1% of pixels, then it is considered to be noise-dominated and hence unusable.
| Quadrant | # 1 sec bins | Bins with >0 counts | Bins with >2000 counts | High rate bins dominated by noise | Noise dominated (total time) | Noise dominated (detector-on time) | Marked lightcurve |
|---|---|---|---|---|---|---|---|
| A | 7682 | 6583 | 7 | 7 | 0.09% | 0.11% |  |
| B | 7682 | 6583 | 1 | 1 | 0.01% | 0.02% |  |
| C | 7682 | 6583 | 17 | 17 | 0.22% | 0.26% |  |
| D | 7682 | 6583 | 13 | 13 | 0.17% | 0.20% |  |
Top three noisy pixels from each quadrant. If the there are fewer than three noisy pixels in the level2.evt file, extra rows are filled as -1
| Pixel properties | Quadrant properties | ||||||
|---|---|---|---|---|---|---|---|
| Quadrant | DetID | PixID | Counts | Sigma | Mean | Median | Sigma |
| A | 13 | 251 | 75146 | 493.87 | 747 | 730 | 150.7 |
| A | 15 | 174 | 31684 | 205.43 | 747 | 730 | 150.7 |
| A | 13 | 14 | 9069 | 55.34 | 747 | 730 | 150.7 |
| B | 0 | 214 | 29910 | 205.77 | 763 | 744 | 141.7 |
| B | 4 | 48 | 27044 | 185.55 | 763 | 744 | 141.7 |
| B | 4 | 80 | 20843 | 141.8 | 763 | 744 | 141.7 |
| C | 1 | 16 | 120501 | 698.07 | 745 | 747 | 171.5 |
| C | 8 | 128 | 10233 | 55.3 | 745 | 747 | 171.5 |
| C | 14 | 234 | 9046 | 48.38 | 745 | 747 | 171.5 |
| D | 2 | 152 | 93582 | 468.49 | 731 | 713 | 198.2 |
| D | 7 | 71 | 75890 | 379.24 | 731 | 713 | 198.2 |
| D | 1 | 52 | 64105 | 319.79 | 731 | 713 | 198.2 |
Histogram calculated using DETX and DETY for each event in the final _common_clean file
| Quadrant A |  |
 |
Quadrant B |
|---|---|---|---|
| Quadrant D |  |
 |
Quadrant C |
| Plot type | Count rate plots | Images |
|---|---|---|
| Comparison with Poisson distribution Blue bars denote a histogram of data divided into 1 sec bins. Red curve is a Poisson curve with rate = median count rate of data. |
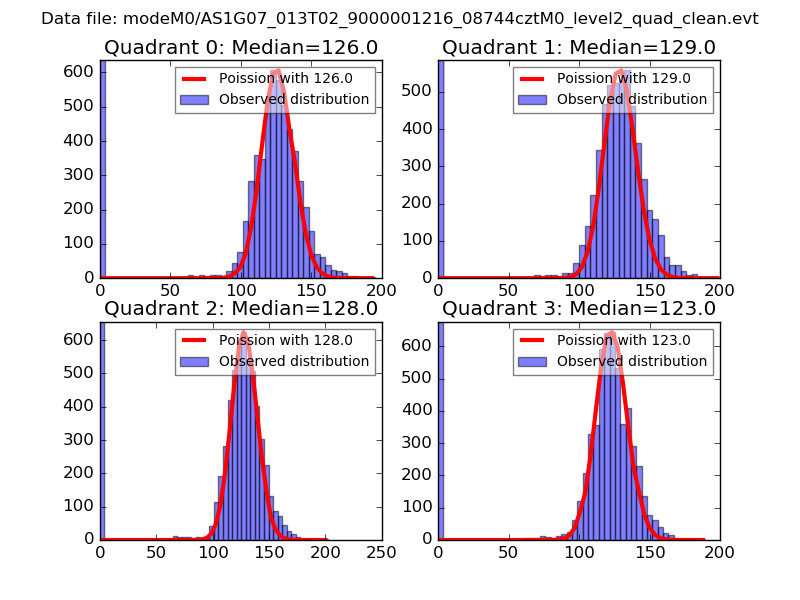 |
 |
| Quadrant-wise count rates Data is divided into 100 sec bins |
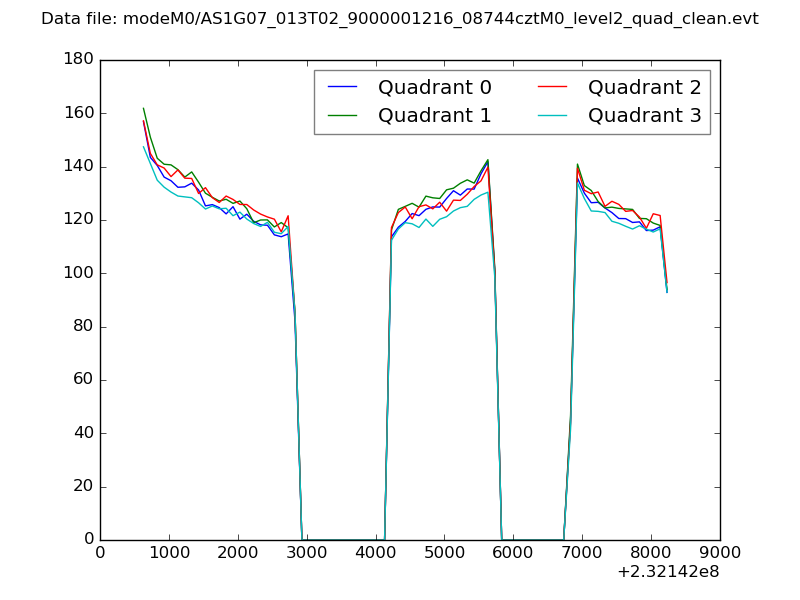 |
|
| Module-wise count rates for Quadrant A Data is divided into 100 sec bins |
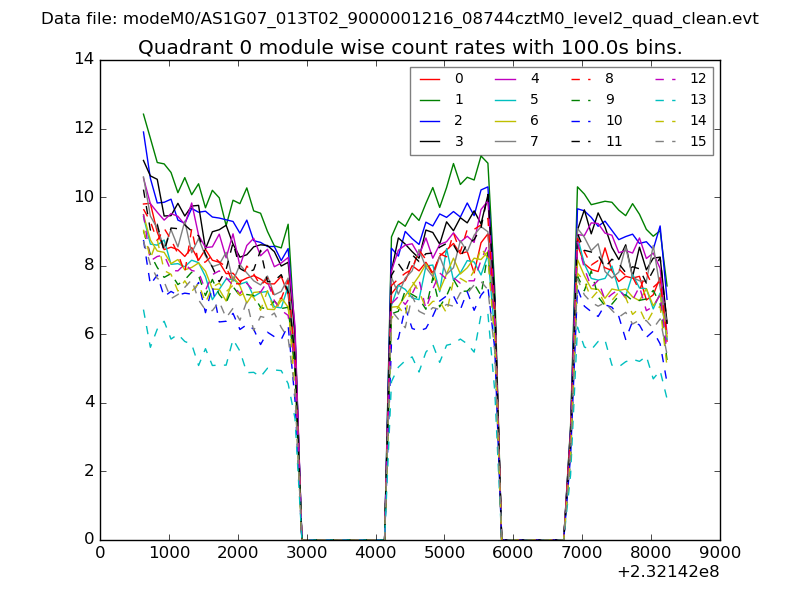 |
 |
| Module-wise count rates for Quadrant B Data is divided into 100 sec bins |
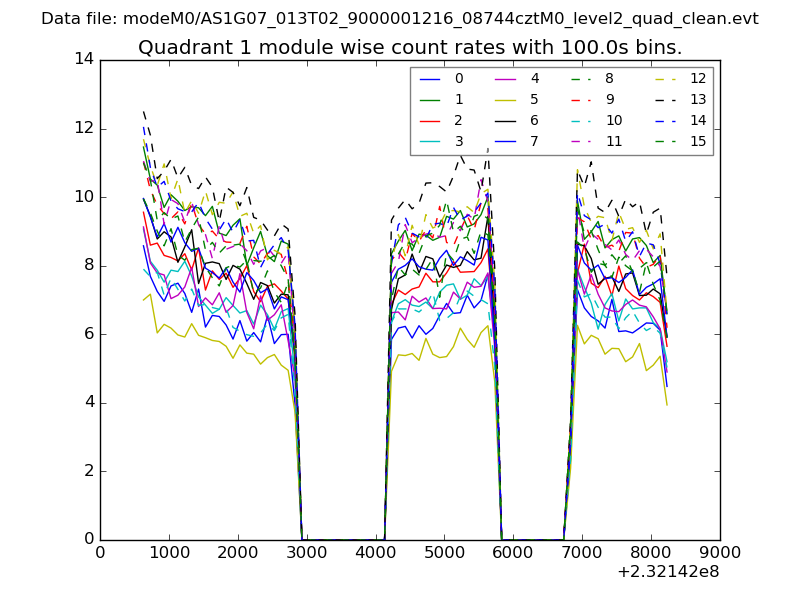 |
 |
| Module-wise count rates for Quadrant C Data is divided into 100 sec bins |
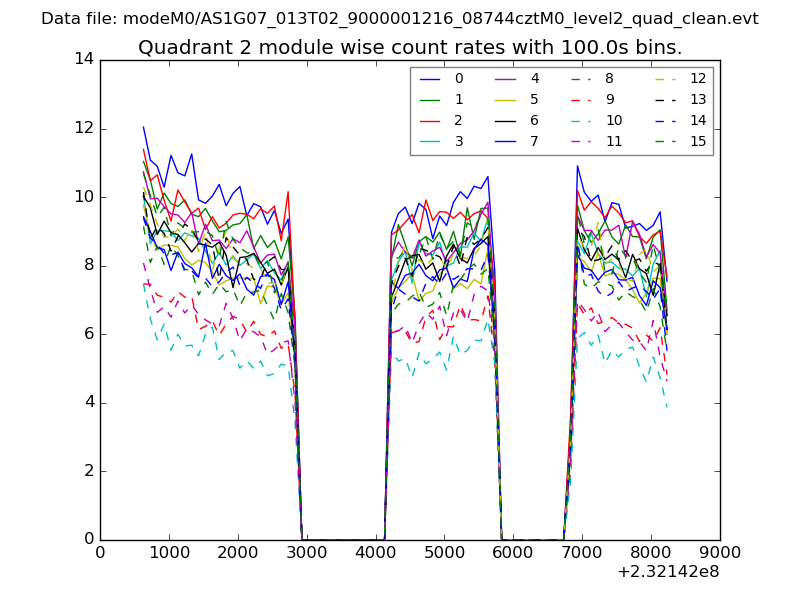 |
 |
| Module-wise count rates for Quadrant D Data is divided into 100 sec bins |
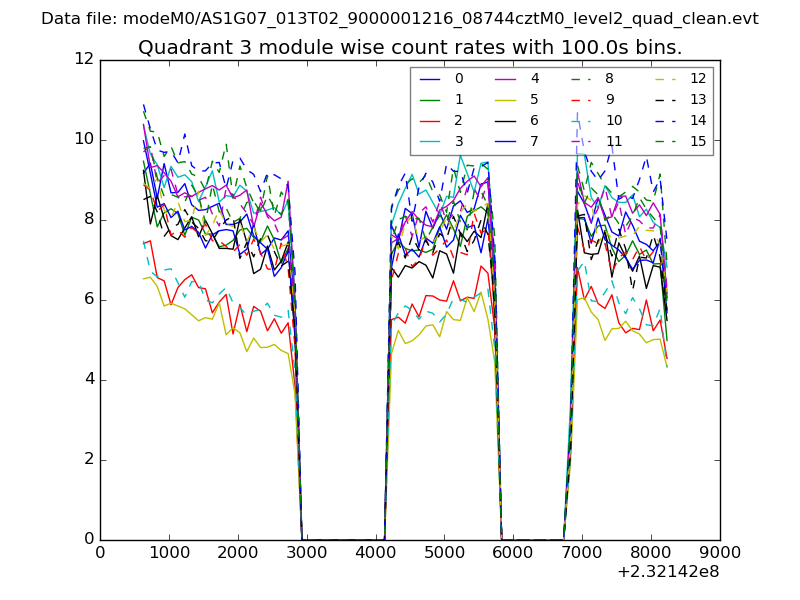 |
 |
| Parameter | Plot |
|---|---|
| CZT HV Monitor | 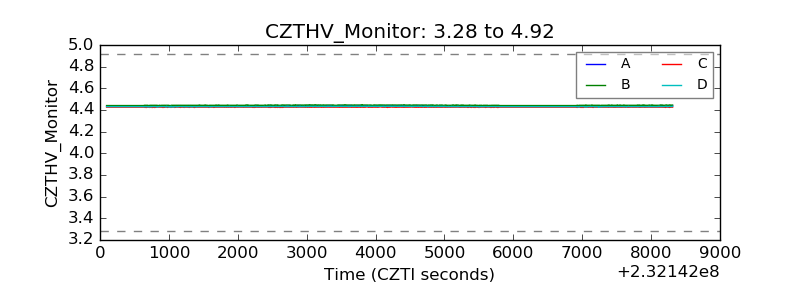 |
| D_VDD |  |
| Temperature 1 |  |
| Veto HV Monitor |  |
| Veto LLD |  |
| Alpha Counter | 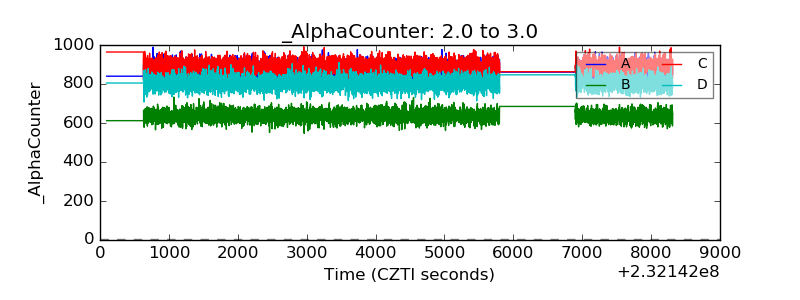 |
| _CPM_Rate | 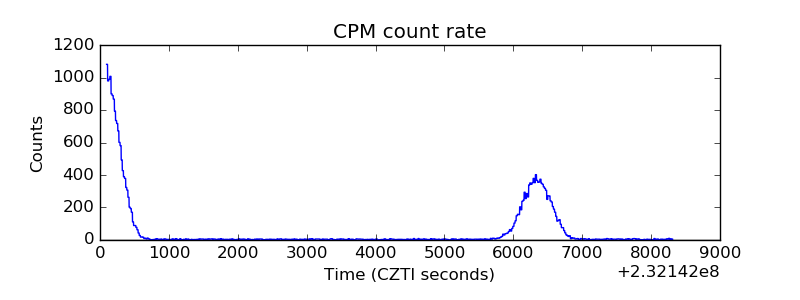 |
| CZT Counter |  |
| +2.5 Volts monitor |  |
| +5 Volts monitor |  |
| _ROLL_ROT | 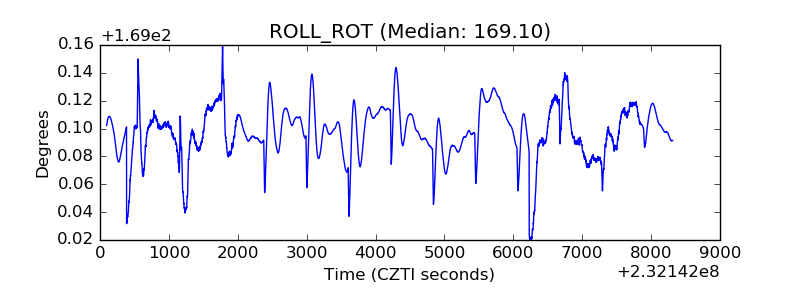 |
| _Roll_DEC | 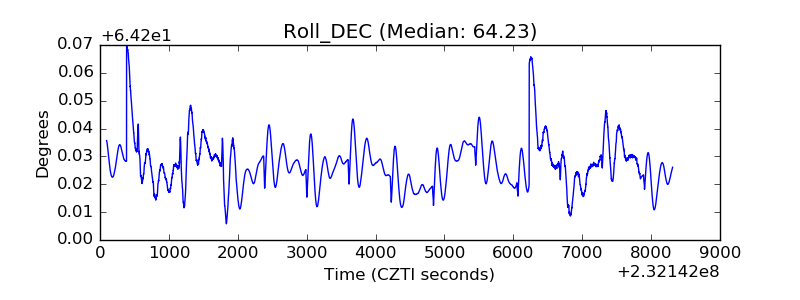 |
| _Roll_RA |  |
| Veto Counter | 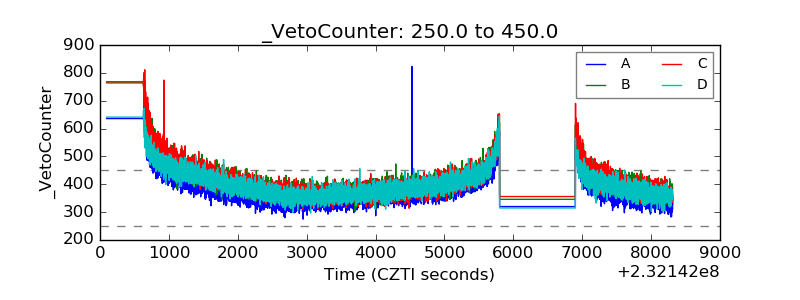 |