| Param | Original file | Final file |
|---|---|---|
| Filename | modeM0/AS1G07_013T02_9000001216_08745cztM0_level2.evt | modeM0/AS1G07_013T02_9000001216_08745cztM0_level2_quad_clean.evt |
| Size (bytes) | 459,691,200 | 104,728,320 |
| Size | 438.4 MB | 99.9 MB |
| Events in quadrant A | 3,486,023 | 673,946 |
| Events in quadrant B | 3,574,368 | 682,527 |
| Events in quadrant C | 3,152,876 | 682,625 |
| Events in quadrant D | 3,242,927 | 655,377 |
| Mode SS | |||
|---|---|---|---|
| Quadrant | BADHDUFLAG | Total packets | Discarded packets |
| A | 0 | 140 | 0 |
| B | 0 | 140 | 0 |
| C | 0 | 140 | 0 |
| D | 0 | 140 | 0 |
| Mode M0 | |||
|---|---|---|---|
| Quadrant | BADHDUFLAG | Total packets | Discarded packets |
| A | 0 | 14996 | 3 |
| B | 0 | 15423 | 2 |
| C | 0 | 14301 | 2 |
| D | 0 | 14777 | 2 |
| Mode M9 | |||
|---|---|---|---|
| Quadrant | BADHDUFLAG | Total packets | Discarded packets |
| A | 0 | 18 | 0 |
| B | 0 | 18 | 0 |
| C | 0 | 18 | 0 |
| D | 0 | 18 | 0 |
| Quadrant | Total seconds | Saturated seconds | Saturation percentage |
|---|---|---|---|
| A | 6852 | 39 | 0.569177% |
| B | 6852 | 136 | 1.984822% |
| C | 6852 | 36 | 0.525394% |
| D | 6852 | 37 | 0.539988% |
Noise dominated data is calculated using 1-second bins in cleaned event files. If a bin has >2000 counts, and if more than 50% of those come from <1% of pixels, then it is considered to be noise-dominated and hence unusable.
| Quadrant | # 1 sec bins | Bins with >0 counts | Bins with >2000 counts | High rate bins dominated by noise | Noise dominated (total time) | Noise dominated (detector-on time) | Marked lightcurve |
|---|---|---|---|---|---|---|---|
| A | 8632 | 6853 | 3 | 3 | 0.03% | 0.04% |  |
| B | 8632 | 6853 | 51 | 51 | 0.59% | 0.74% | 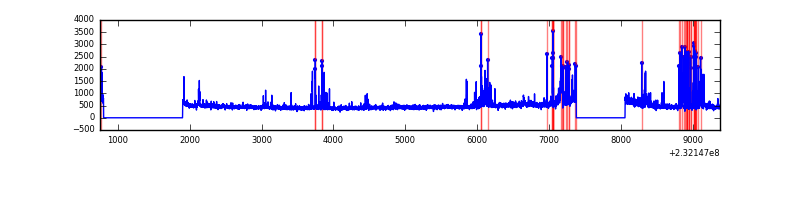 |
| C | 8632 | 6854 | 14 | 14 | 0.16% | 0.20% | 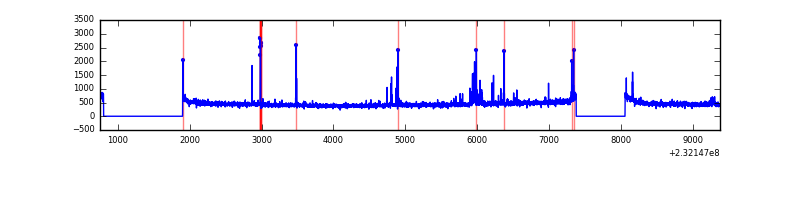 |
| D | 8632 | 6854 | 25 | 25 | 0.29% | 0.36% | 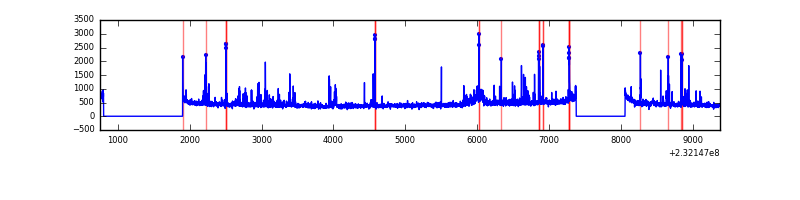 |
Top three noisy pixels from each quadrant. If the there are fewer than three noisy pixels in the level2.evt file, extra rows are filled as -1
| Pixel properties | Quadrant properties | ||||||
|---|---|---|---|---|---|---|---|
| Quadrant | DetID | PixID | Counts | Sigma | Mean | Median | Sigma |
| A | 13 | 251 | 492117 | 3141.39 | 773 | 757 | 156.4 |
| A | 15 | 174 | 14742 | 89.41 | 773 | 757 | 156.4 |
| A | 0 | 226 | 7376 | 42.32 | 773 | 757 | 156.4 |
| B | 10 | 16 | 324071 | 2180.76 | 783 | 763 | 148.3 |
| B | 4 | 48 | 56648 | 376.95 | 783 | 763 | 148.3 |
| B | 0 | 214 | 38293 | 253.15 | 783 | 763 | 148.3 |
| C | 1 | 16 | 149500 | 838.87 | 766 | 769 | 177.3 |
| C | 13 | 61 | 5915 | 29.02 | 766 | 769 | 177.3 |
| C | 8 | 128 | 4092 | 18.74 | 766 | 769 | 177.3 |
| D | 2 | 152 | 106041 | 569.49 | 760 | 737 | 184.9 |
| D | 7 | 71 | 97178 | 521.56 | 760 | 737 | 184.9 |
| D | 1 | 52 | 56077 | 299.28 | 760 | 737 | 184.9 |
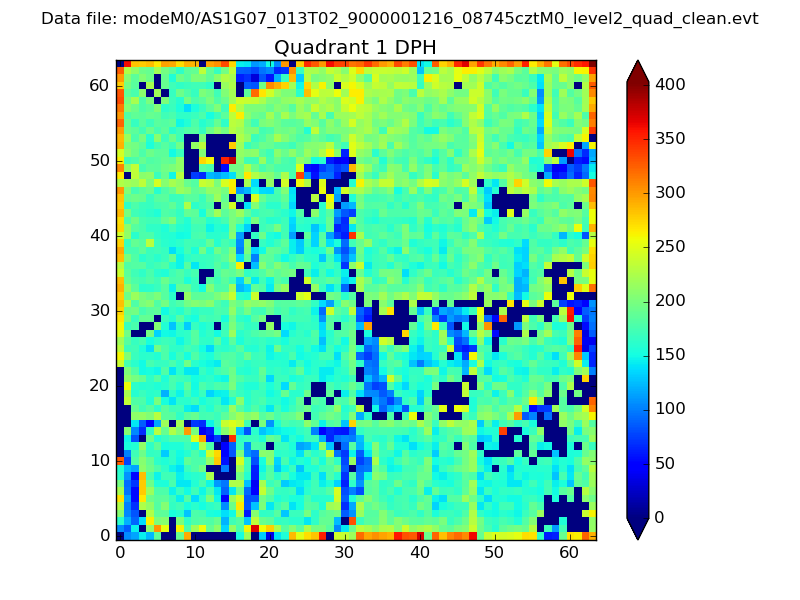
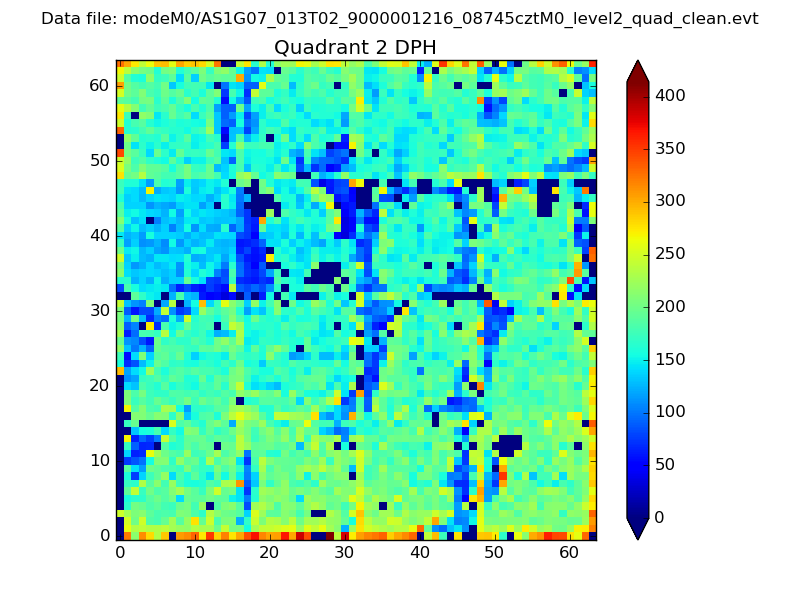
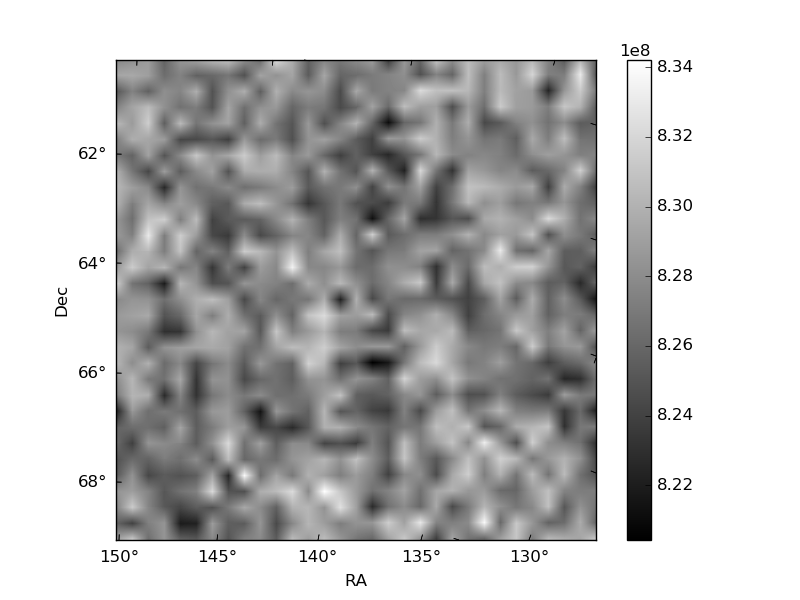
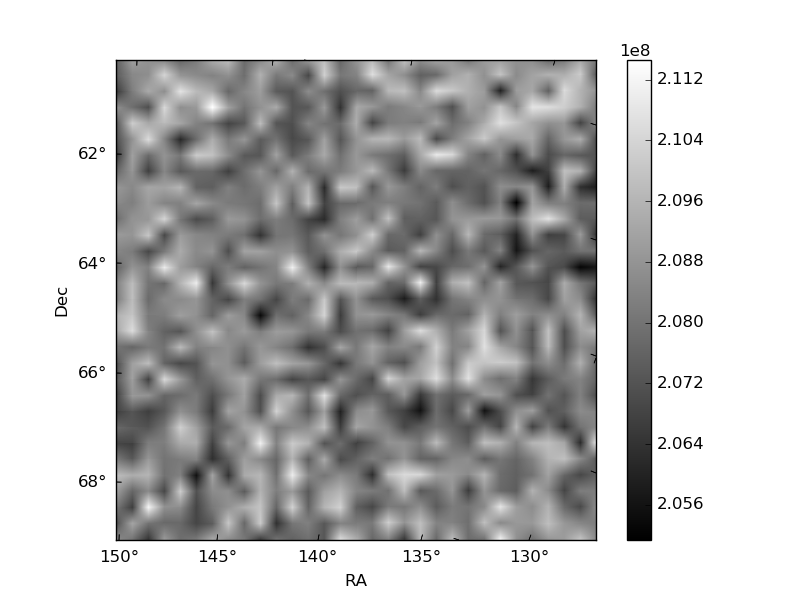
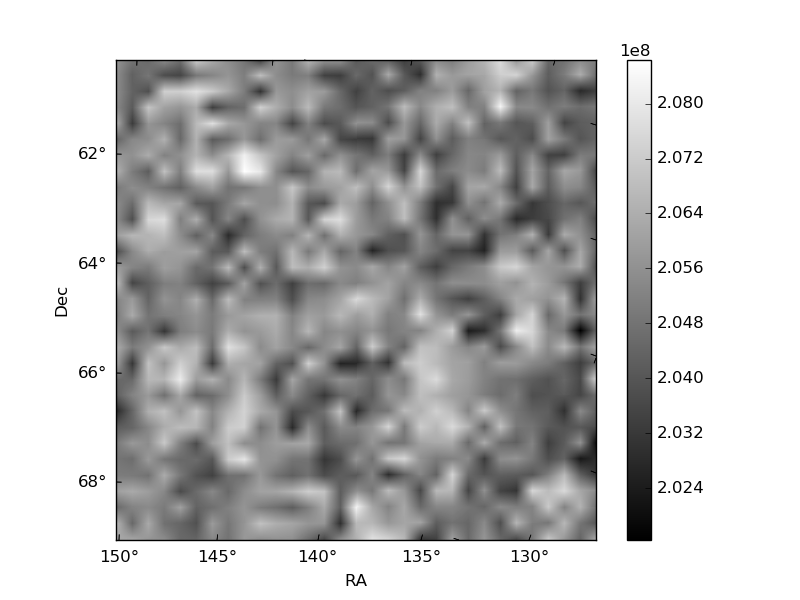
Histogram calculated using DETX and DETY for each event in the final _common_clean file
| Quadrant A | 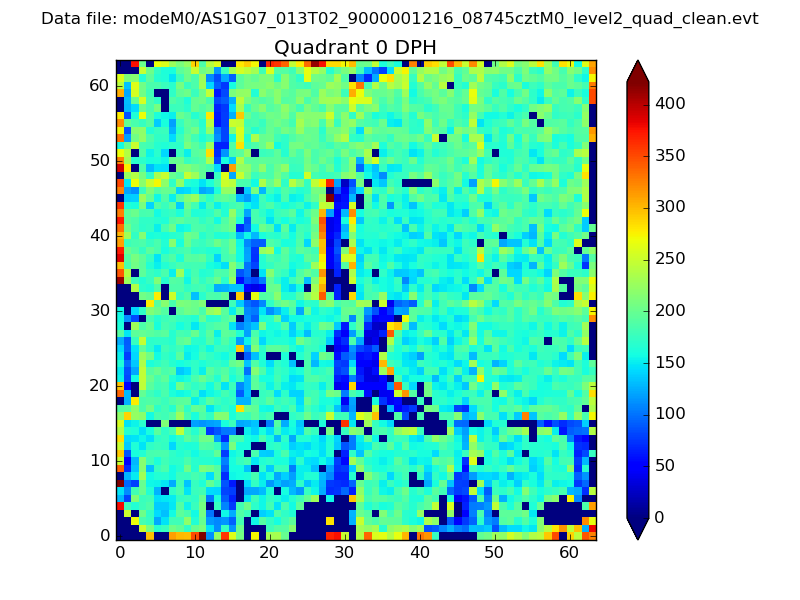 |
 |
Quadrant B |
|---|---|---|---|
| Quadrant D | 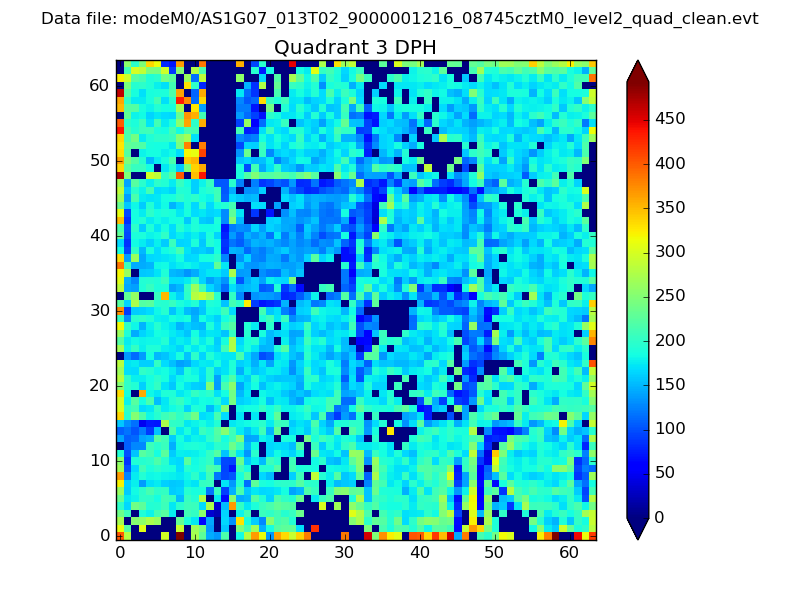 |
 |
Quadrant C |
| Plot type | Count rate plots | Images |
|---|---|---|
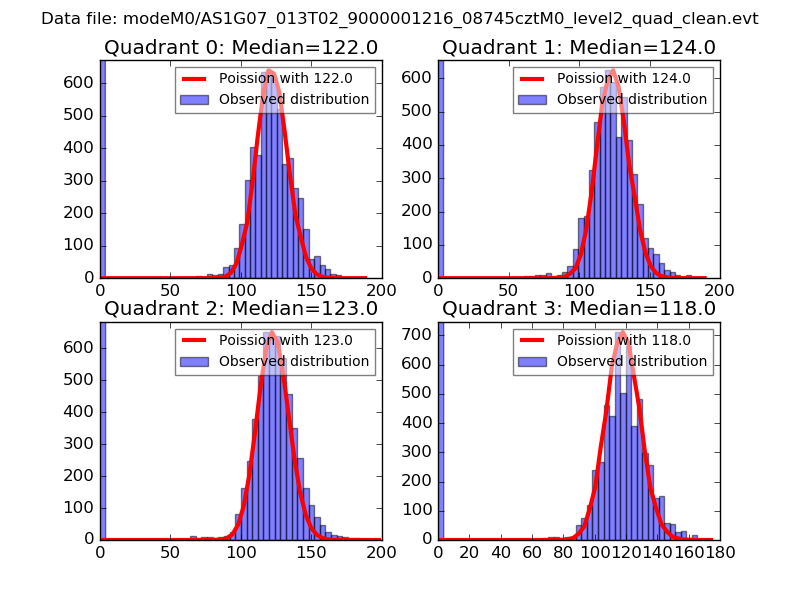
| Comparison with Poisson distribution Blue bars denote a histogram of data divided into 1 sec bins. Red curve is a Poisson curve with rate = median count rate of data. |
 |
 |
| Quadrant-wise count rates Data is divided into 100 sec bins |
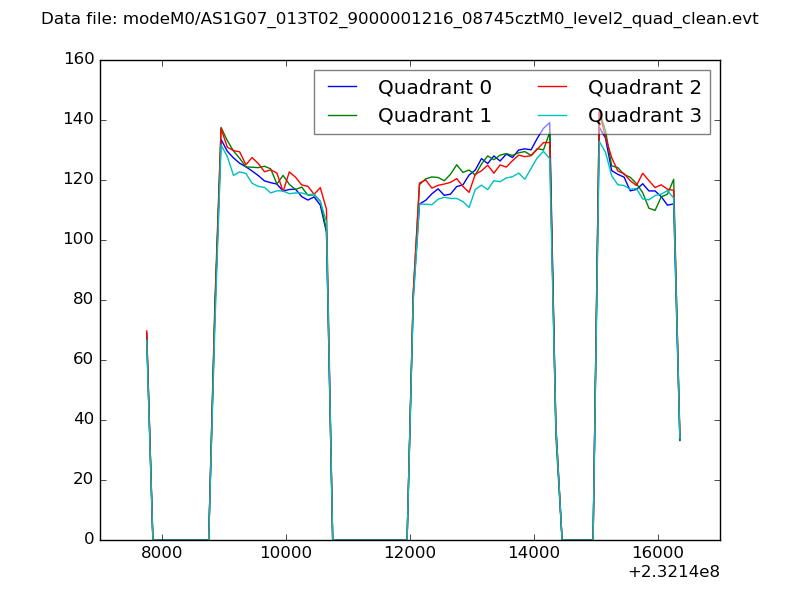 |
|
| Module-wise count rates for Quadrant A Data is divided into 100 sec bins |
 |
 |
| Module-wise count rates for Quadrant B Data is divided into 100 sec bins |
 |
 |
| Module-wise count rates for Quadrant C Data is divided into 100 sec bins |
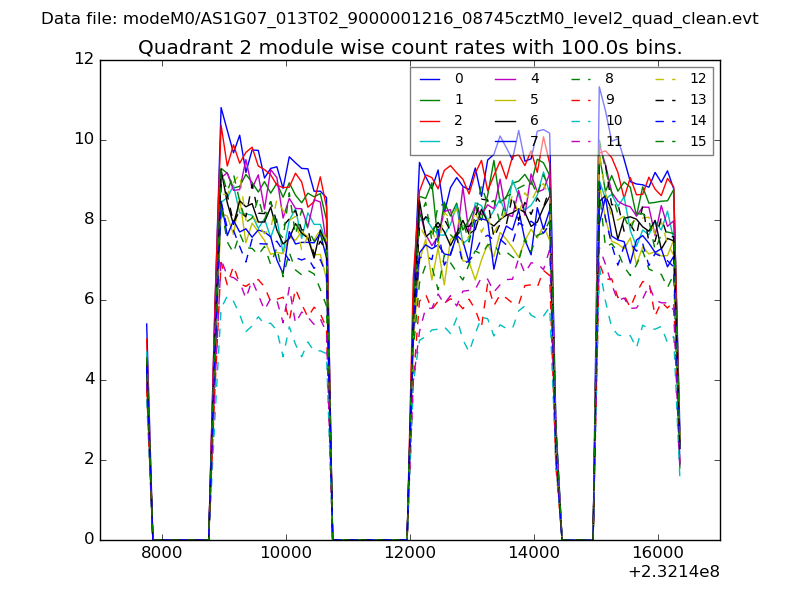 |
 |
| Module-wise count rates for Quadrant D Data is divided into 100 sec bins |
 |
 |
| Parameter | Plot |
|---|---|
| CZT HV Monitor |  |
| D_VDD | 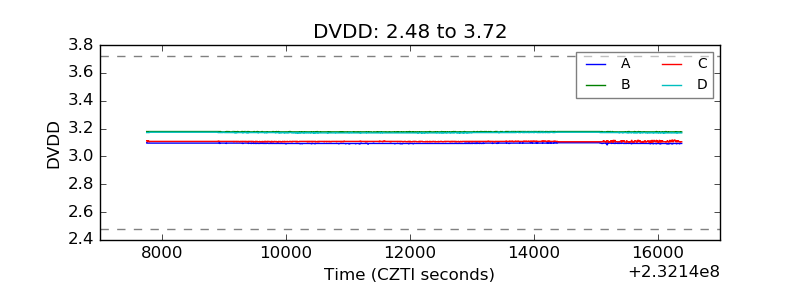 |
| Temperature 1 | 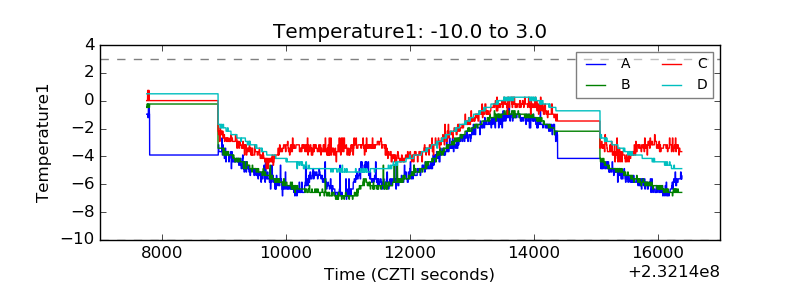 |
| Veto HV Monitor | 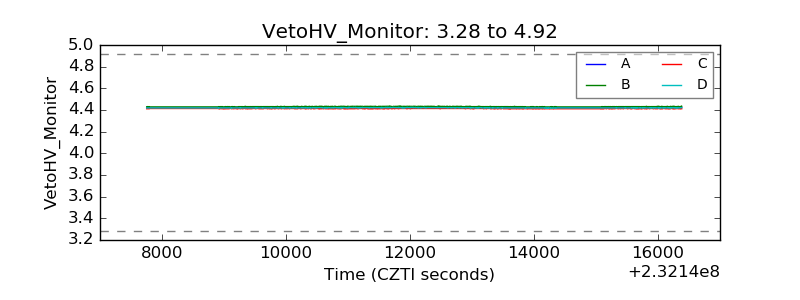 |
| Veto LLD | 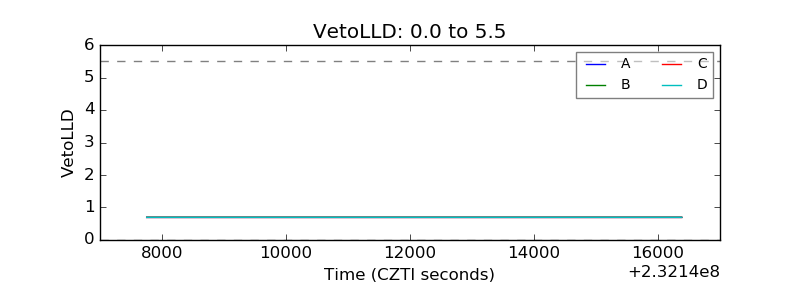 |
| Alpha Counter | 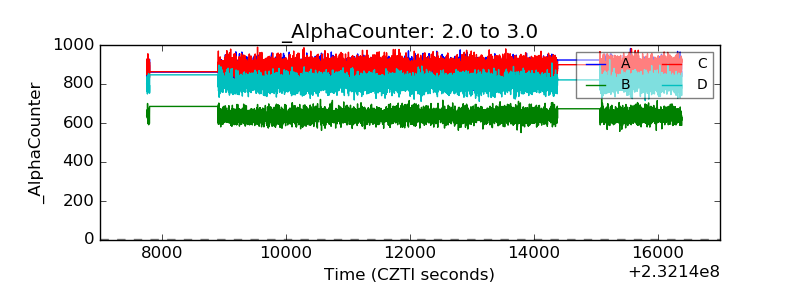 |
| _CPM_Rate | 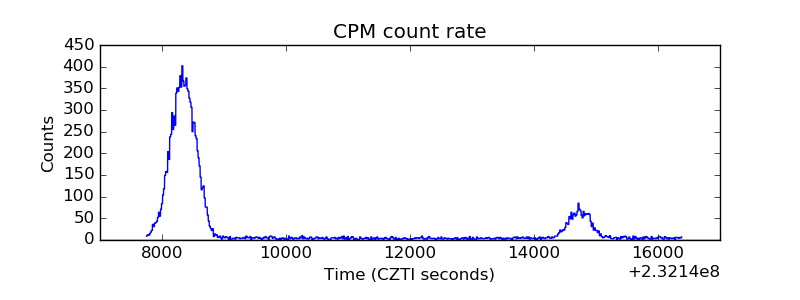 |
| CZT Counter | 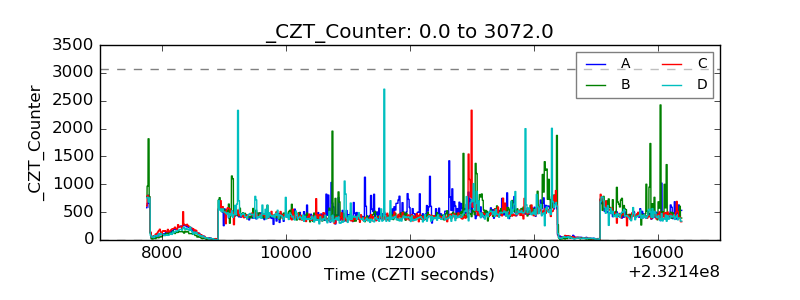 |
| +2.5 Volts monitor | 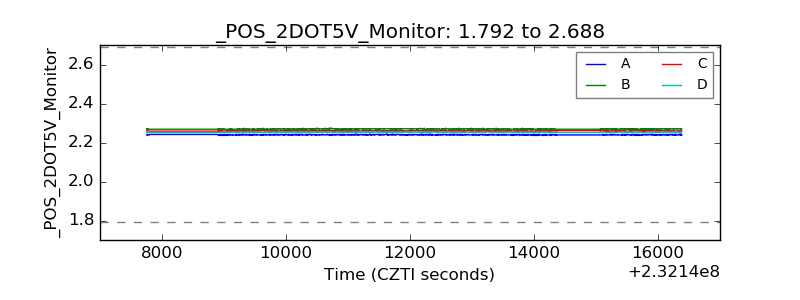 |
| +5 Volts monitor |  |
| _ROLL_ROT | 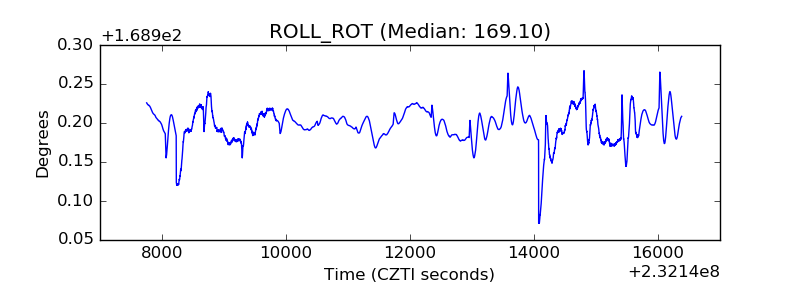 |
| _Roll_DEC | 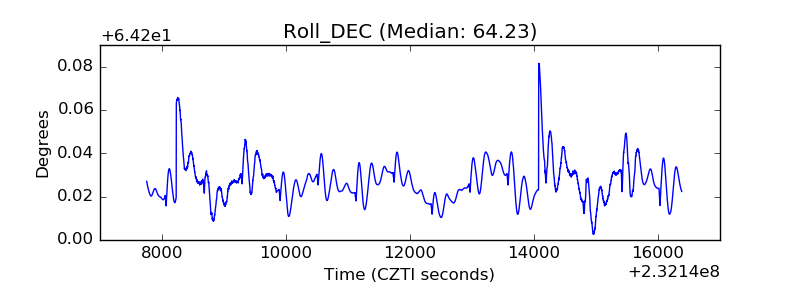 |
| _Roll_RA | 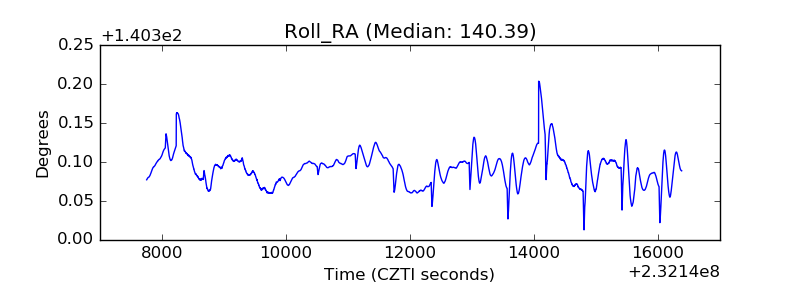 |
| Veto Counter |  |