| Param | Original file | Final file |
|---|---|---|
| Filename | modeM0/AS1G07_013T02_9000001216_08746cztM0_level2.evt | modeM0/AS1G07_013T02_9000001216_08746cztM0_level2_quad_clean.evt |
| Size (bytes) | 519,811,200 | 110,399,040 |
| Size | 495.7 MB | 105.3 MB |
| Events in quadrant A | 3,727,931 | 707,151 |
| Events in quadrant B | 3,975,545 | 713,993 |
| Events in quadrant C | 3,406,876 | 716,025 |
| Events in quadrant D | 4,122,641 | 684,203 |
| Mode SS | |||
|---|---|---|---|
| Quadrant | BADHDUFLAG | Total packets | Discarded packets |
| A | 0 | 156 | 0 |
| B | 0 | 156 | 0 |
| C | 0 | 156 | 0 |
| D | 0 | 156 | 0 |
| Mode M0 | |||
|---|---|---|---|
| Quadrant | BADHDUFLAG | Total packets | Discarded packets |
| A | 0 | 16110 | 3 |
| B | 0 | 17051 | 6 |
| C | 0 | 15545 | 4 |
| D | 0 | 17523 | 5 |
| Mode M9 | |||
|---|---|---|---|
| Quadrant | BADHDUFLAG | Total packets | Discarded packets |
| A | 0 | 9 | 0 |
| B | 0 | 9 | 0 |
| C | 0 | 9 | 0 |
| D | 0 | 9 | 0 |
| Quadrant | Total seconds | Saturated seconds | Saturation percentage |
|---|---|---|---|
| A | 7505 | 73 | 0.972685% |
| B | 7503 | 226 | 3.012128% |
| C | 7504 | 55 | 0.732942% |
| D | 7504 | 95 | 1.265991% |
Noise dominated data is calculated using 1-second bins in cleaned event files. If a bin has >2000 counts, and if more than 50% of those come from <1% of pixels, then it is considered to be noise-dominated and hence unusable.
| Quadrant | # 1 sec bins | Bins with >0 counts | Bins with >2000 counts | High rate bins dominated by noise | Noise dominated (total time) | Noise dominated (detector-on time) | Marked lightcurve |
|---|---|---|---|---|---|---|---|
| A | 8425 | 7506 | 10 | 10 | 0.12% | 0.13% |  |
| B | 8425 | 7507 | 85 | 85 | 1.01% | 1.13% |  |
| C | 8425 | 7508 | 7 | 7 | 0.08% | 0.09% |  |
| D | 8425 | 7508 | 72 | 72 | 0.85% | 0.96% |  |
Top three noisy pixels from each quadrant. If the there are fewer than three noisy pixels in the level2.evt file, extra rows are filled as -1
| Pixel properties | Quadrant properties | ||||||
|---|---|---|---|---|---|---|---|
| Quadrant | DetID | PixID | Counts | Sigma | Mean | Median | Sigma |
| A | 13 | 251 | 378314 | 2179.48 | 853 | 833 | 173.2 |
| A | 5 | 16 | 47957 | 272.08 | 853 | 833 | 173.2 |
| A | 15 | 174 | 14308 | 77.8 | 853 | 833 | 173.2 |
| B | 10 | 16 | 500996 | 3049.47 | 862 | 838 | 164.0 |
| B | 4 | 48 | 51429 | 308.45 | 862 | 838 | 164.0 |
| B | 0 | 214 | 31772 | 188.61 | 862 | 838 | 164.0 |
| C | 1 | 16 | 60547 | 305.69 | 845 | 850 | 195.3 |
| C | 14 | 234 | 21219 | 104.3 | 845 | 850 | 195.3 |
| C | 8 | 128 | 11236 | 53.18 | 845 | 850 | 195.3 |
| D | 1 | 52 | 592928 | 2910.37 | 837 | 809 | 203.5 |
| D | 2 | 152 | 123008 | 600.63 | 837 | 809 | 203.5 |
| D | 7 | 71 | 92349 | 449.94 | 837 | 809 | 203.5 |
Histogram calculated using DETX and DETY for each event in the final _common_clean file
| Quadrant A |  |
 |
Quadrant B |
|---|---|---|---|
| Quadrant D |  |
 |
Quadrant C |
| Plot type | Count rate plots | Images |
|---|---|---|
| Comparison with Poisson distribution Blue bars denote a histogram of data divided into 1 sec bins. Red curve is a Poisson curve with rate = median count rate of data. |
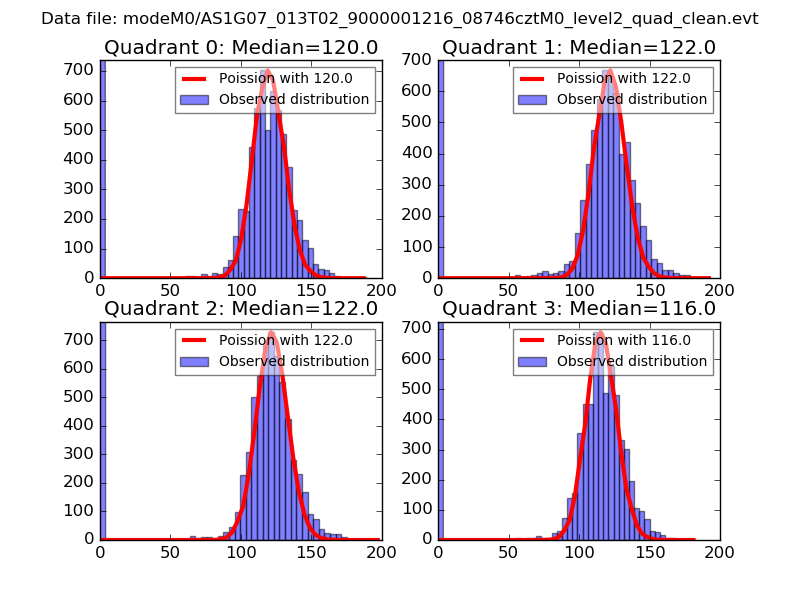 |
 |
| Quadrant-wise count rates Data is divided into 100 sec bins |
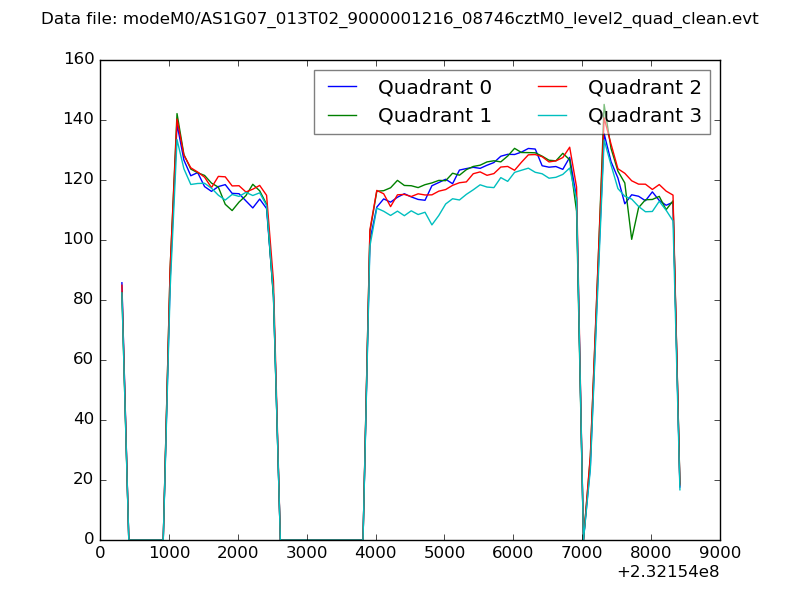 |
|
| Module-wise count rates for Quadrant A Data is divided into 100 sec bins |
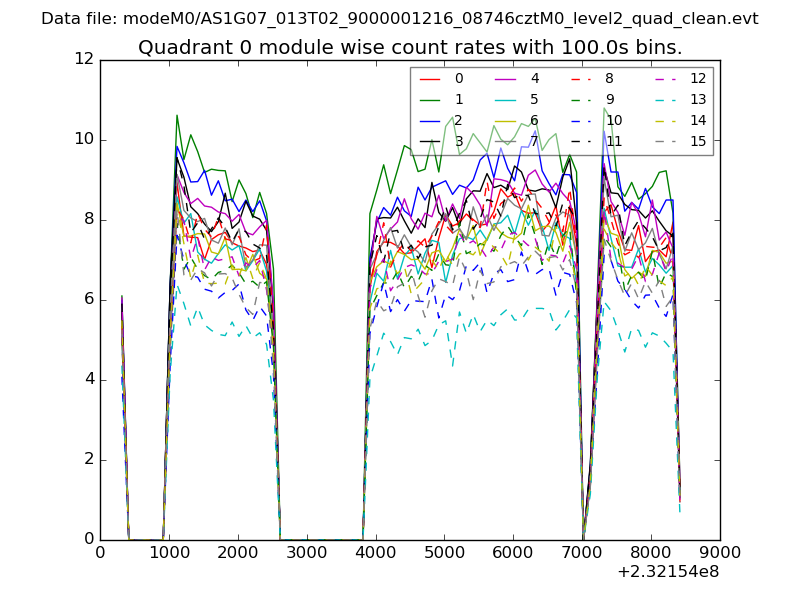 |
 |
| Module-wise count rates for Quadrant B Data is divided into 100 sec bins |
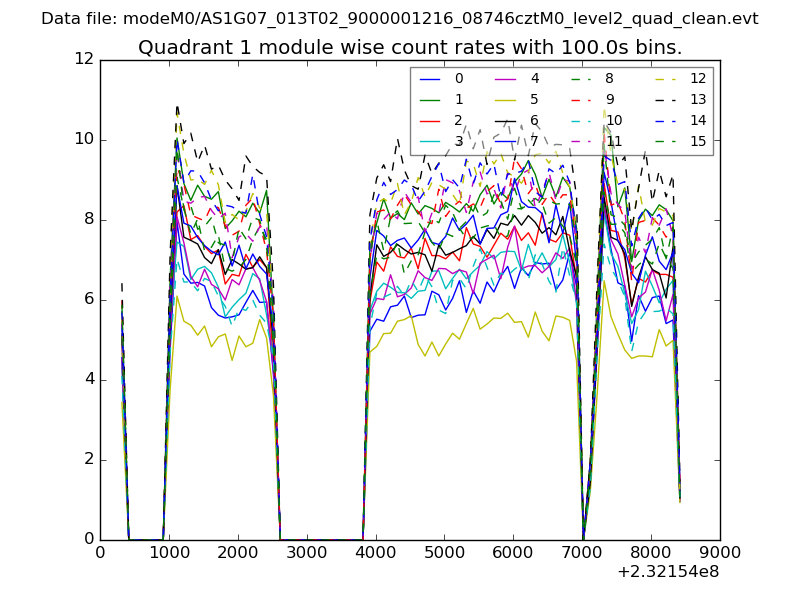 |
 |
| Module-wise count rates for Quadrant C Data is divided into 100 sec bins |
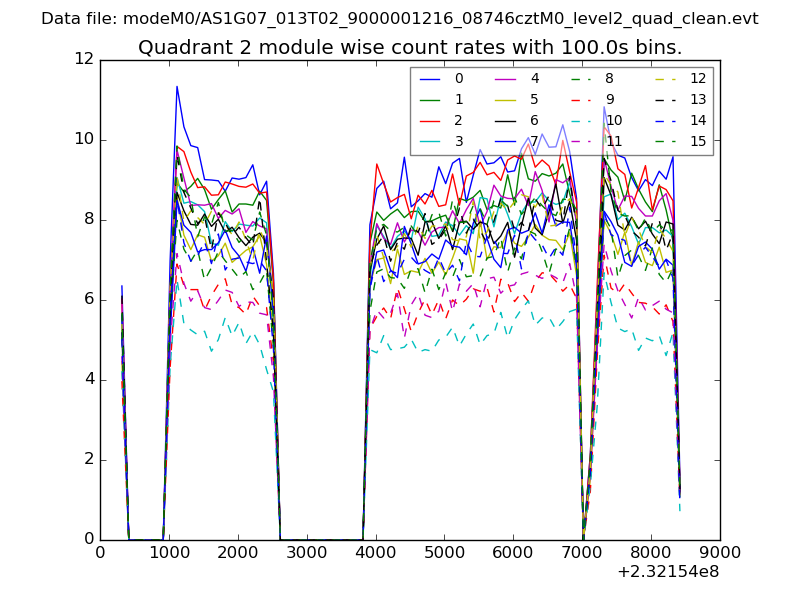 |
 |
| Module-wise count rates for Quadrant D Data is divided into 100 sec bins |
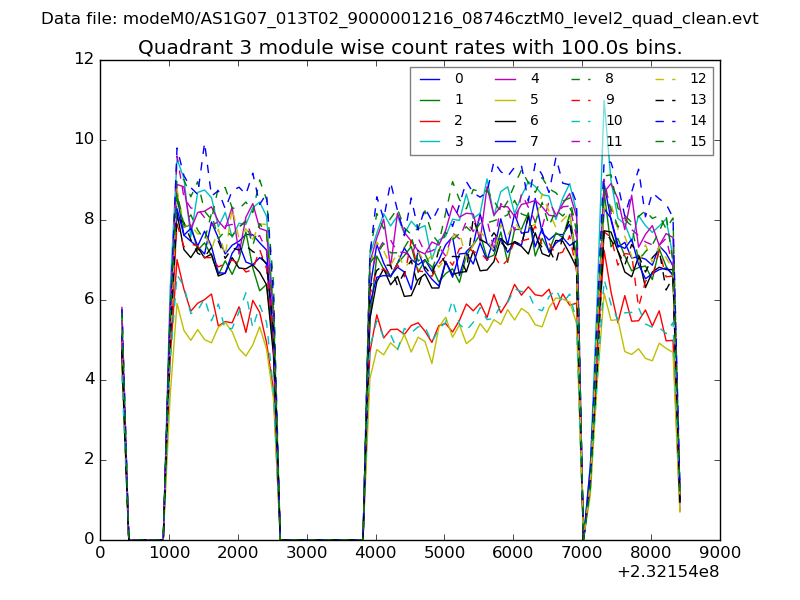 |
 |
| Parameter | Plot |
|---|---|
| CZT HV Monitor | 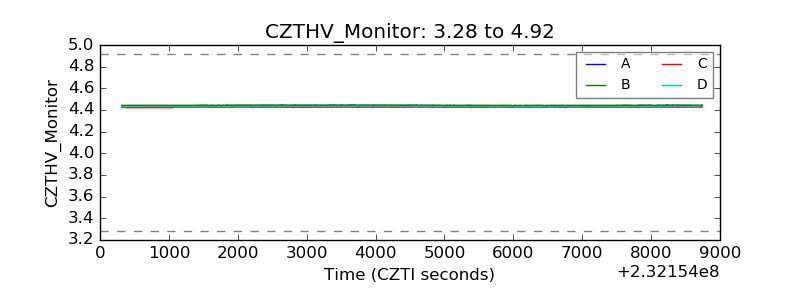 |
| D_VDD |  |
| Temperature 1 |  |
| Veto HV Monitor |  |
| Veto LLD |  |
| Alpha Counter | 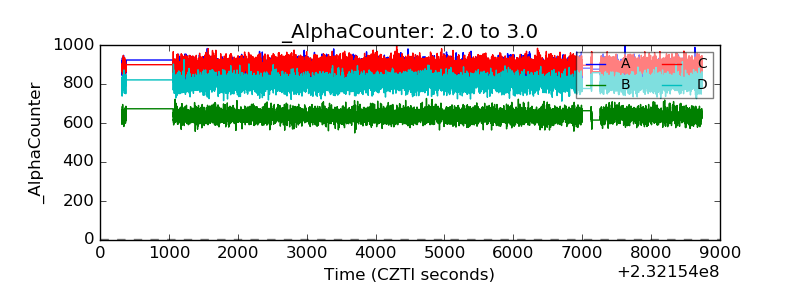 |
| _CPM_Rate | 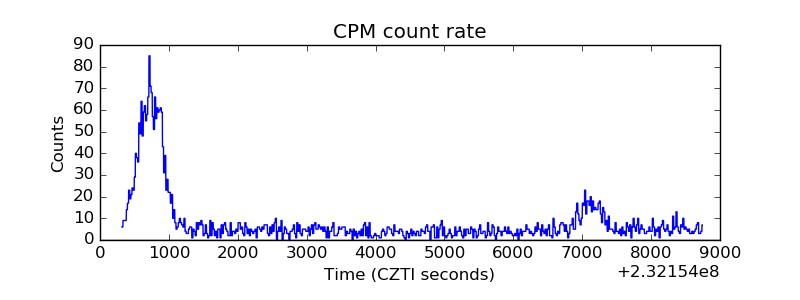 |
| CZT Counter |  |
| +2.5 Volts monitor |  |
| +5 Volts monitor |  |
| _ROLL_ROT | 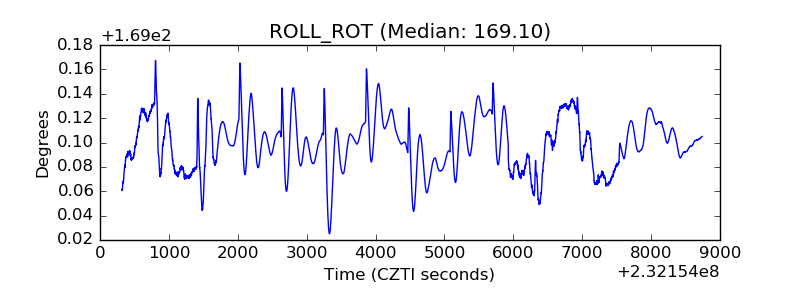 |
| _Roll_DEC | 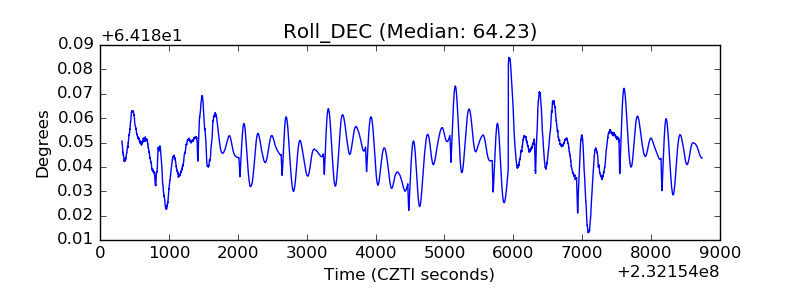 |
| _Roll_RA |  |
| Veto Counter | 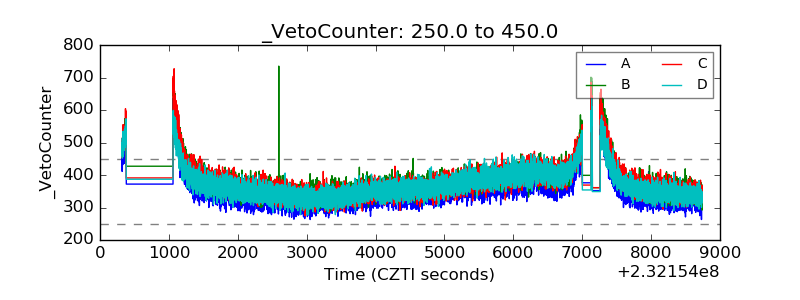 |