| Param | Original file | Final file |
|---|---|---|
| Filename | modeM0/AS1G07_013T02_9000001216_08747cztM0_level2.evt | modeM0/AS1G07_013T02_9000001216_08747cztM0_level2_quad_clean.evt |
| Size (bytes) | 534,444,480 | 102,484,800 |
| Size | 509.7 MB | 97.7 MB |
| Events in quadrant A | 3,613,774 | 645,502 |
| Events in quadrant B | 3,955,739 | 654,461 |
| Events in quadrant C | 3,399,412 | 652,979 |
| Events in quadrant D | 4,698,401 | 619,599 |
| Mode SS | |||
|---|---|---|---|
| Quadrant | BADHDUFLAG | Total packets | Discarded packets |
| A | 0 | 154 | 0 |
| B | 0 | 154 | 0 |
| C | 0 | 154 | 0 |
| D | 0 | 154 | 0 |
| Mode M0 | |||
|---|---|---|---|
| Quadrant | BADHDUFLAG | Total packets | Discarded packets |
| A | 0 | 16065 | 2 |
| B | 0 | 16966 | 1 |
| C | 0 | 15715 | 1 |
| D | 0 | 19201 | 1 |
| Mode M9 | |||
|---|---|---|---|
| Quadrant | BADHDUFLAG | Total packets | Discarded packets |
| A | 0 | 1 | 0 |
| B | 0 | 1 | 0 |
| C | 0 | 1 | 0 |
| D | 0 | 1 | 0 |
| Quadrant | Total seconds | Saturated seconds | Saturation percentage |
|---|---|---|---|
| A | 7633 | 149 | 1.952050% |
| B | 7633 | 285 | 3.733788% |
| C | 7633 | 92 | 1.205293% |
| D | 7633 | 293 | 3.838596% |
Noise dominated data is calculated using 1-second bins in cleaned event files. If a bin has >2000 counts, and if more than 50% of those come from <1% of pixels, then it is considered to be noise-dominated and hence unusable.
| Quadrant | # 1 sec bins | Bins with >0 counts | Bins with >2000 counts | High rate bins dominated by noise | Noise dominated (total time) | Noise dominated (detector-on time) | Marked lightcurve |
|---|---|---|---|---|---|---|---|
| A | 7733 | 7634 | 24 | 24 | 0.31% | 0.31% |  |
| B | 7733 | 7633 | 76 | 76 | 0.98% | 1.00% |  |
| C | 7733 | 7633 | 5 | 5 | 0.06% | 0.07% |  |
| D | 7733 | 7634 | 169 | 169 | 2.19% | 2.21% |  |
Top three noisy pixels from each quadrant. If the there are fewer than three noisy pixels in the level2.evt file, extra rows are filled as -1
| Pixel properties | Quadrant properties | ||||||
|---|---|---|---|---|---|---|---|
| Quadrant | DetID | PixID | Counts | Sigma | Mean | Median | Sigma |
| A | 13 | 251 | 132454 | 746.62 | 862 | 843 | 176.3 |
| A | 5 | 16 | 94484 | 531.22 | 862 | 843 | 176.3 |
| A | 4 | 2 | 45388 | 252.7 | 862 | 843 | 176.3 |
| B | 10 | 16 | 492916 | 3005.59 | 870 | 848 | 163.7 |
| B | 0 | 214 | 37454 | 223.59 | 870 | 848 | 163.7 |
| B | 4 | 48 | 21950 | 128.89 | 870 | 848 | 163.7 |
| C | 14 | 234 | 32289 | 160.08 | 851 | 853 | 196.4 |
| C | 1 | 16 | 21454 | 104.91 | 851 | 853 | 196.4 |
| C | 5 | 128 | 14207 | 68.0 | 851 | 853 | 196.4 |
| D | 1 | 52 | 1020797 | 5005.78 | 835 | 809 | 203.8 |
| D | 2 | 152 | 130603 | 636.99 | 835 | 809 | 203.8 |
| D | 7 | 71 | 78109 | 379.36 | 835 | 809 | 203.8 |
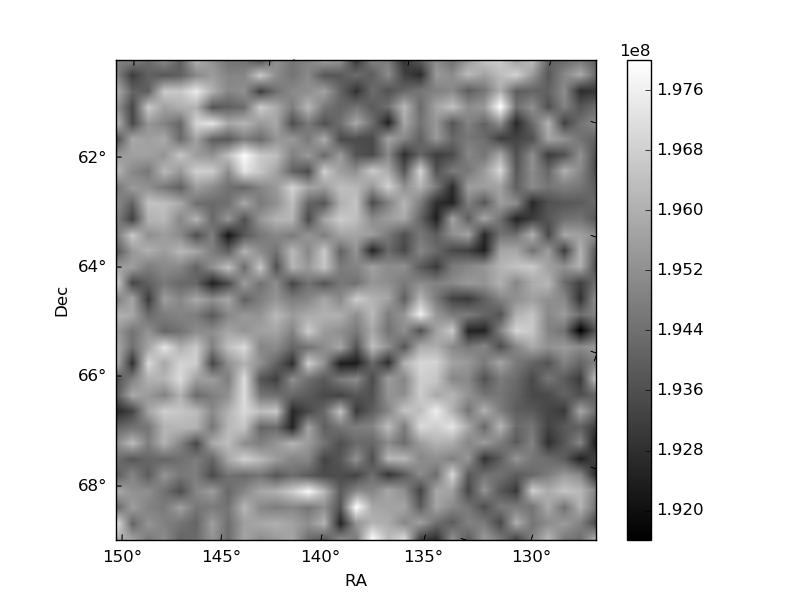
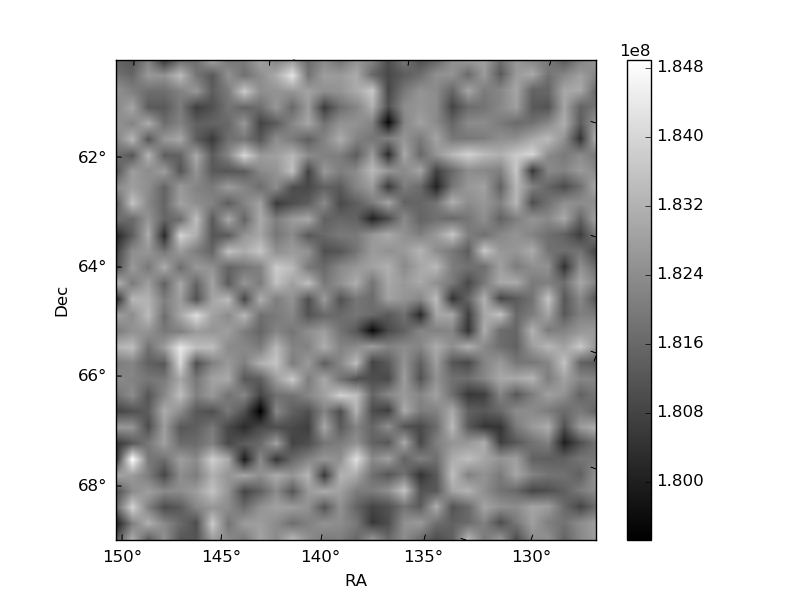
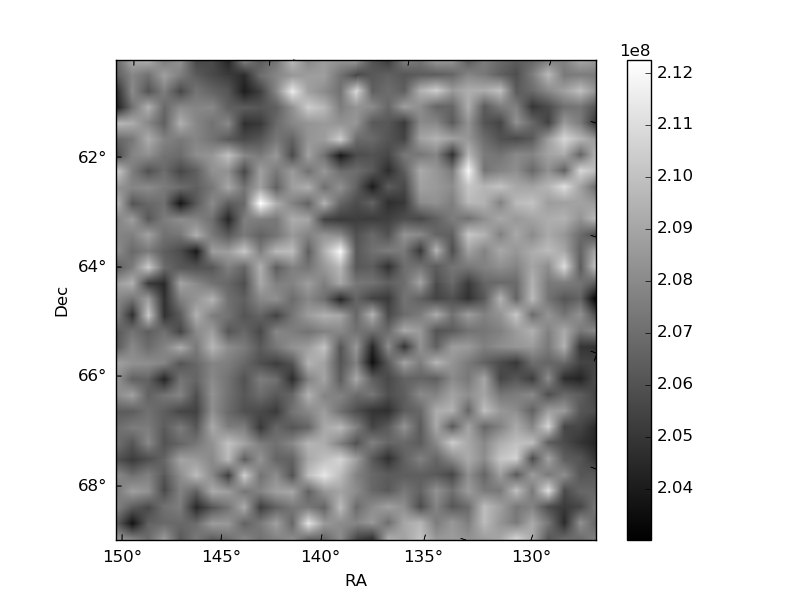
Histogram calculated using DETX and DETY for each event in the final _common_clean file
| Quadrant A | 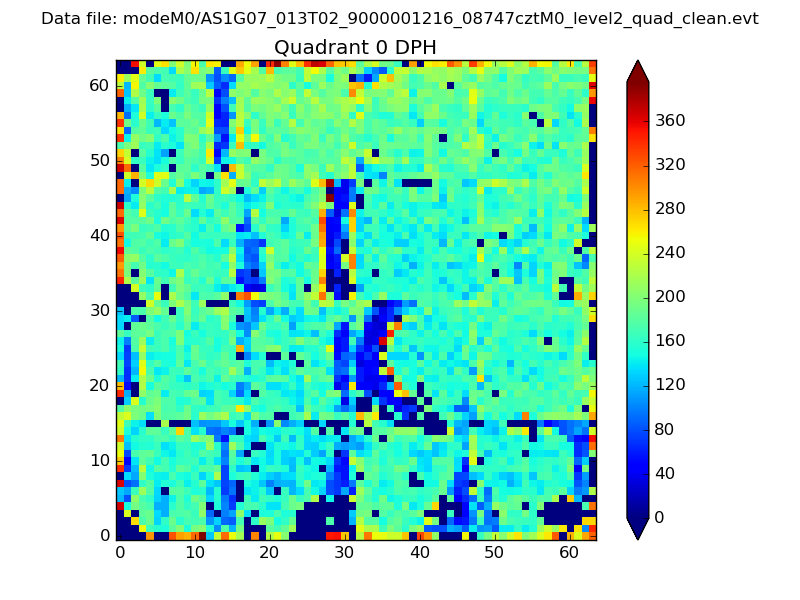 |
 |
Quadrant B |
|---|---|---|---|
| Quadrant D |  |
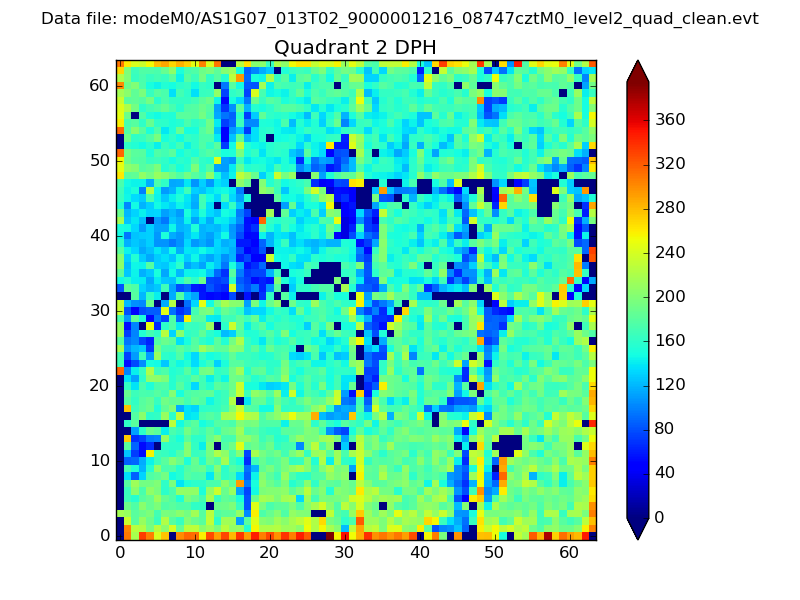 |
Quadrant C |
| Plot type | Count rate plots | Images |
|---|---|---|
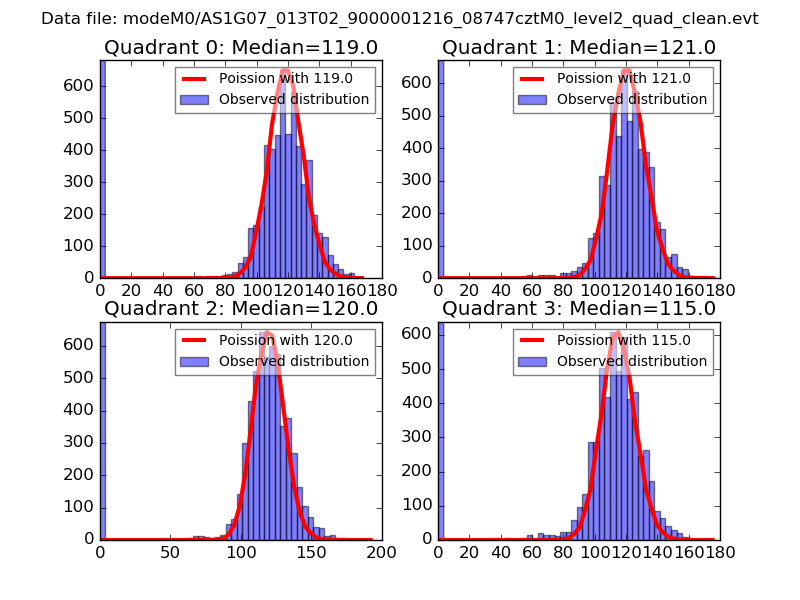
| Comparison with Poisson distribution Blue bars denote a histogram of data divided into 1 sec bins. Red curve is a Poisson curve with rate = median count rate of data. |
 |
 |
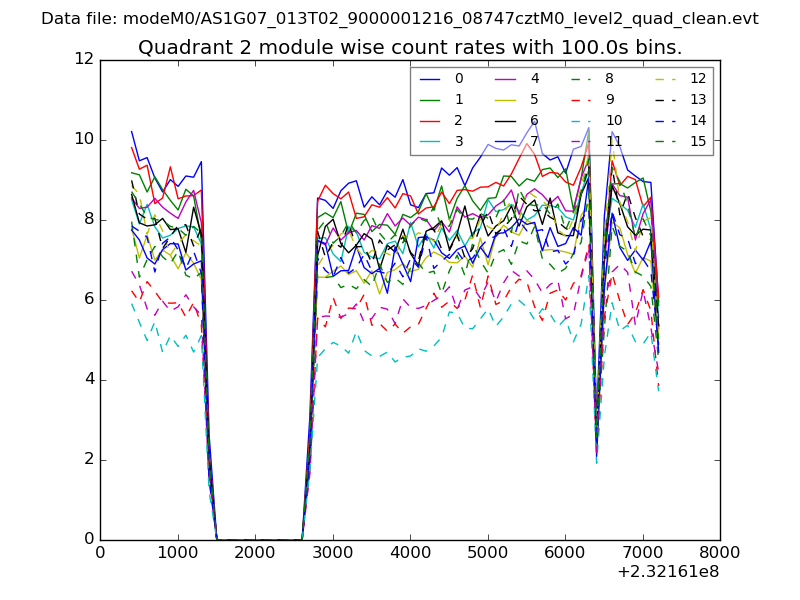
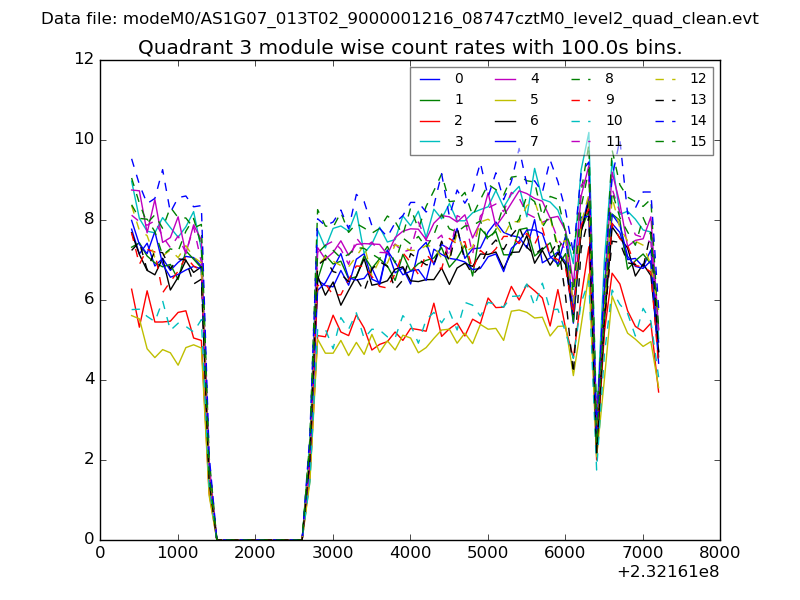
| Quadrant-wise count rates Data is divided into 100 sec bins |
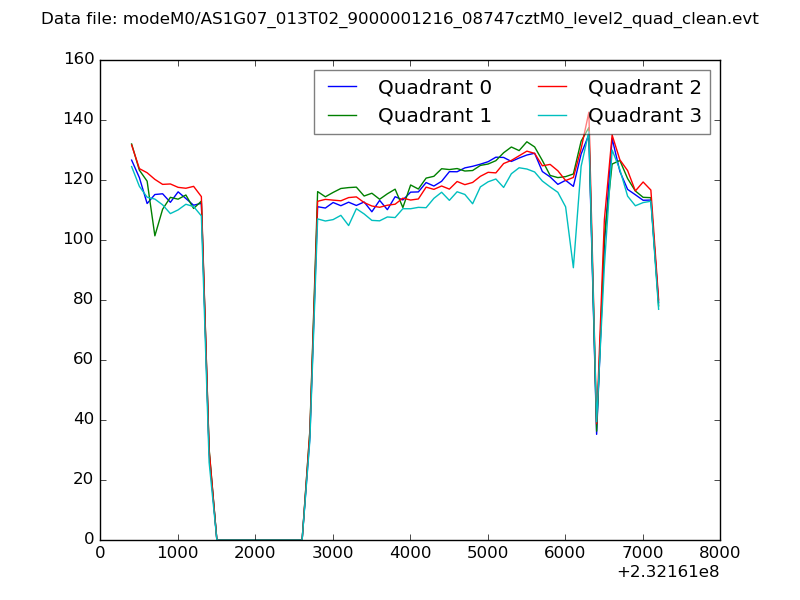 |
|
| Module-wise count rates for Quadrant A Data is divided into 100 sec bins |
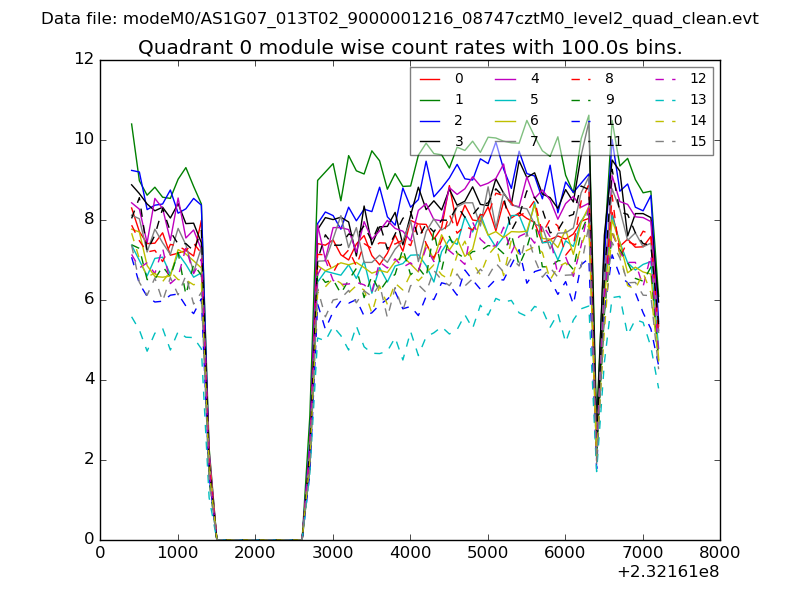 |
 |
| Module-wise count rates for Quadrant B Data is divided into 100 sec bins |
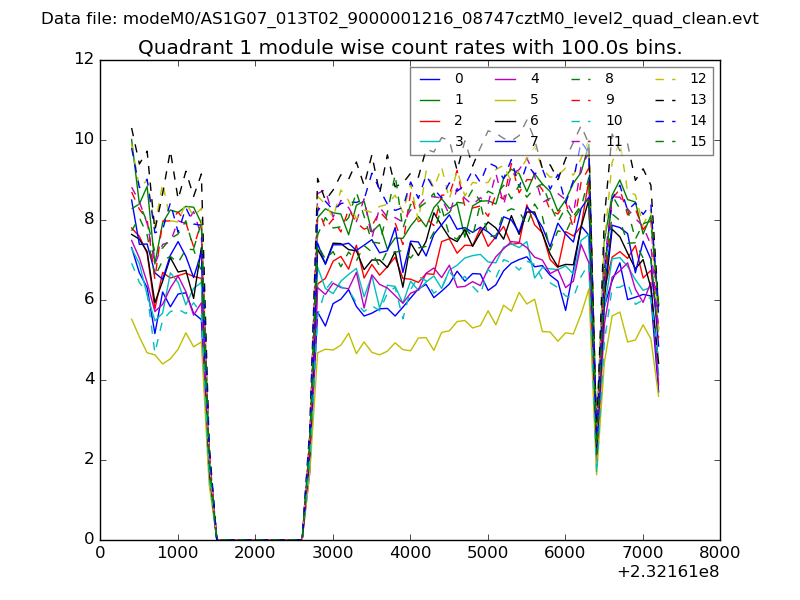 |
 |
| Module-wise count rates for Quadrant C Data is divided into 100 sec bins |
 |
 |
| Module-wise count rates for Quadrant D Data is divided into 100 sec bins |
 |
 |
| Parameter | Plot |
|---|---|
| CZT HV Monitor |  |
| D_VDD | 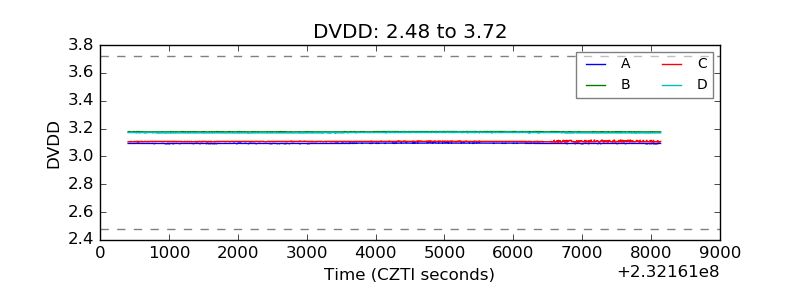 |
| Temperature 1 | 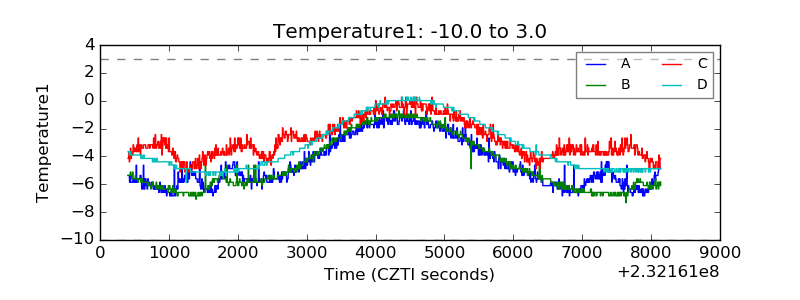 |
| Veto HV Monitor | 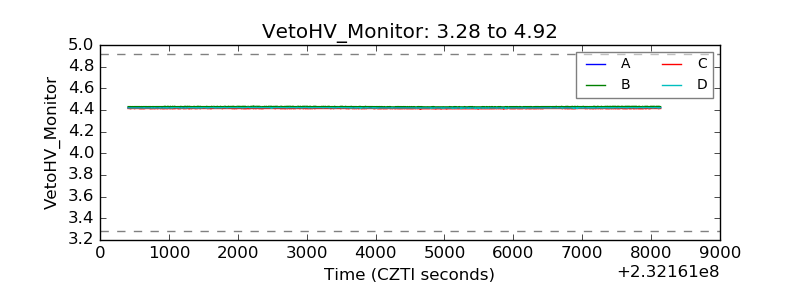 |
| Veto LLD | 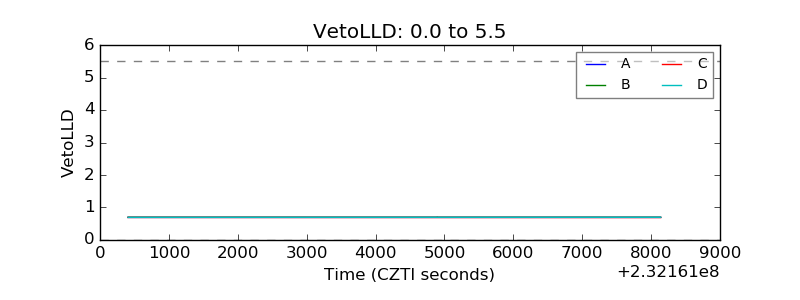 |
| Alpha Counter | 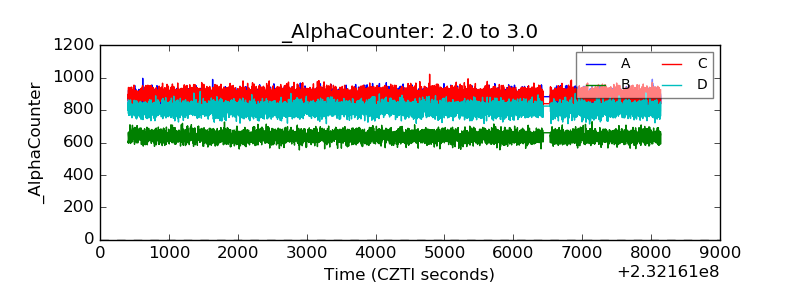 |
| _CPM_Rate | 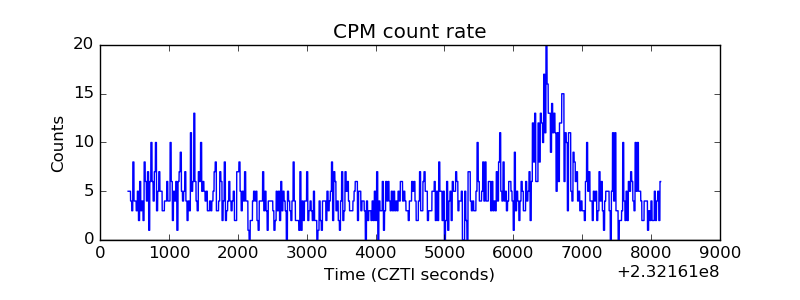 |
| CZT Counter | 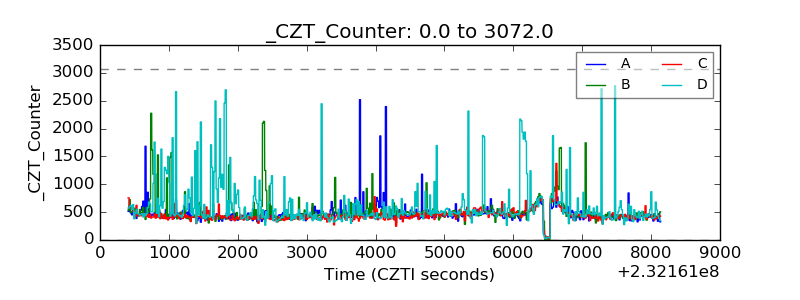 |
| +2.5 Volts monitor |  |
| +5 Volts monitor | 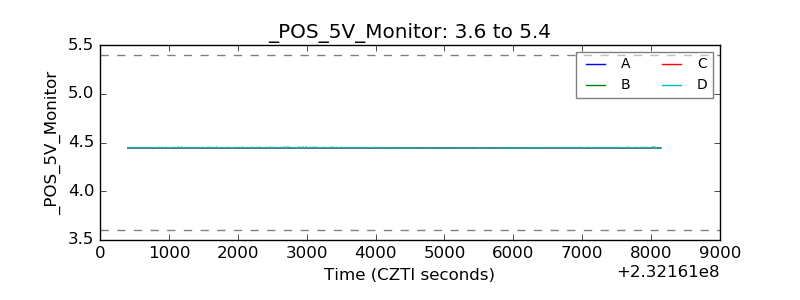 |
| _ROLL_ROT | 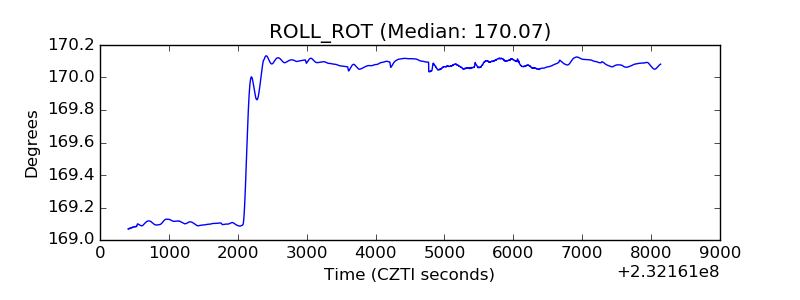 |
| _Roll_DEC | 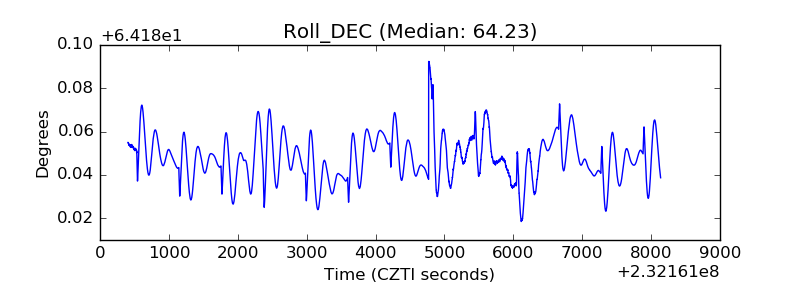 |
| _Roll_RA | 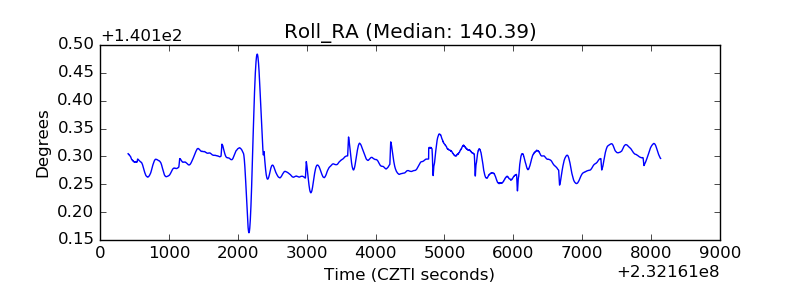 |
| Veto Counter |  |