| Param | Original file | Final file |
|---|---|---|
| Filename | modeM0/AS1G07_013T02_9000001216_08750cztM0_level2.evt | modeM0/AS1G07_013T02_9000001216_08750cztM0_level2_quad_clean.evt |
| Size (bytes) | 676,316,160 | 139,717,440 |
| Size | 645.0 MB | 133.2 MB |
| Events in quadrant A | 4,628,915 | 890,434 |
| Events in quadrant B | 5,150,557 | 898,674 |
| Events in quadrant C | 4,378,651 | 890,033 |
| Events in quadrant D | 5,638,380 | 851,859 |
| Mode SS | |||
|---|---|---|---|
| Quadrant | BADHDUFLAG | Total packets | Discarded packets |
| A | 0 | 206 | 0 |
| B | 0 | 206 | 0 |
| C | 0 | 206 | 0 |
| D | 0 | 206 | 0 |
| Mode M0 | |||
|---|---|---|---|
| Quadrant | BADHDUFLAG | Total packets | Discarded packets |
| A | 0 | 20985 | 2 |
| B | 0 | 22165 | 2 |
| C | 0 | 20543 | 4 |
| D | 0 | 23820 | 6 |
| Mode M9 | |||
|---|---|---|---|
| Quadrant | BADHDUFLAG | Total packets | Discarded packets |
| A | 0 | 8 | 0 |
| B | 0 | 8 | 0 |
| C | 0 | 8 | 0 |
| D | 0 | 8 | 0 |
| Quadrant | Total seconds | Saturated seconds | Saturation percentage |
|---|---|---|---|
| A | 10109 | 186 | 1.839945% |
| B | 10109 | 336 | 3.323771% |
| C | 10108 | 111 | 1.098140% |
| D | 10107 | 260 | 2.572475% |
Noise dominated data is calculated using 1-second bins in cleaned event files. If a bin has >2000 counts, and if more than 50% of those come from <1% of pixels, then it is considered to be noise-dominated and hence unusable.
| Quadrant | # 1 sec bins | Bins with >0 counts | Bins with >2000 counts | High rate bins dominated by noise | Noise dominated (total time) | Noise dominated (detector-on time) | Marked lightcurve |
|---|---|---|---|---|---|---|---|
| A | 10944 | 10110 | 23 | 23 | 0.21% | 0.23% | 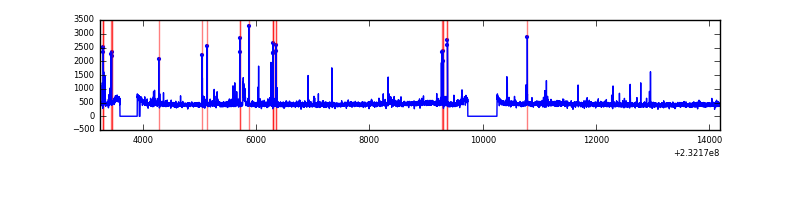 |
| B | 10944 | 10110 | 133 | 133 | 1.22% | 1.32% | 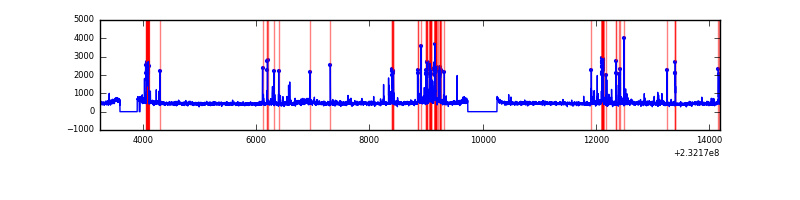 |
| C | 10944 | 10110 | 1 | 1 | 0.01% | 0.01% | 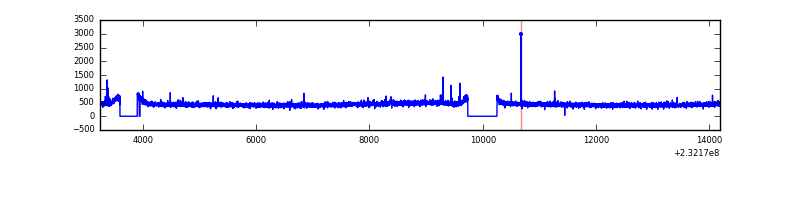 |
| D | 10944 | 10110 | 123 | 123 | 1.12% | 1.22% | 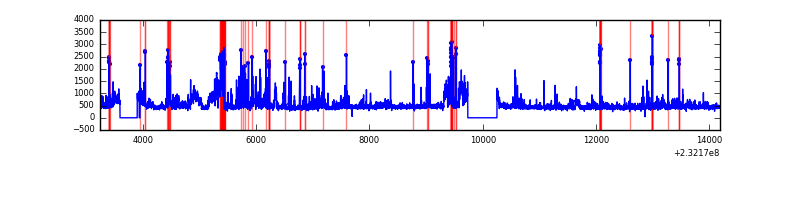 |
Top three noisy pixels from each quadrant. If the there are fewer than three noisy pixels in the level2.evt file, extra rows are filled as -1
| Pixel properties | Quadrant properties | ||||||
|---|---|---|---|---|---|---|---|
| Quadrant | DetID | PixID | Counts | Sigma | Mean | Median | Sigma |
| A | 5 | 16 | 125003 | 531.3 | 1140 | 1112 | 233.2 |
| A | 15 | 174 | 45278 | 189.4 | 1140 | 1112 | 233.2 |
| A | 13 | 251 | 38364 | 159.75 | 1140 | 1112 | 233.2 |
| B | 10 | 16 | 498158 | 2285.86 | 1146 | 1116 | 217.4 |
| B | 0 | 214 | 89618 | 407.01 | 1146 | 1116 | 217.4 |
| B | 4 | 48 | 68826 | 311.39 | 1146 | 1116 | 217.4 |
| C | 14 | 234 | 14204 | 50.47 | 1113 | 1115 | 259.3 |
| C | 1 | 16 | 13262 | 46.84 | 1113 | 1115 | 259.3 |
| C | 14 | 64 | 8545 | 28.65 | 1113 | 1115 | 259.3 |
| D | 1 | 52 | 930585 | 3211.24 | 1098 | 1068 | 289.5 |
| D | 2 | 152 | 210577 | 723.8 | 1098 | 1068 | 289.5 |
| D | 7 | 71 | 98077 | 335.14 | 1098 | 1068 | 289.5 |
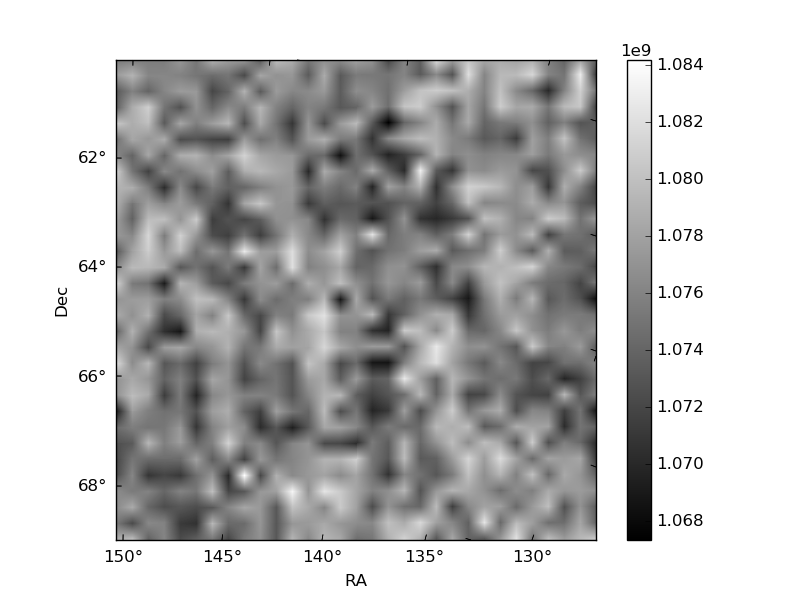
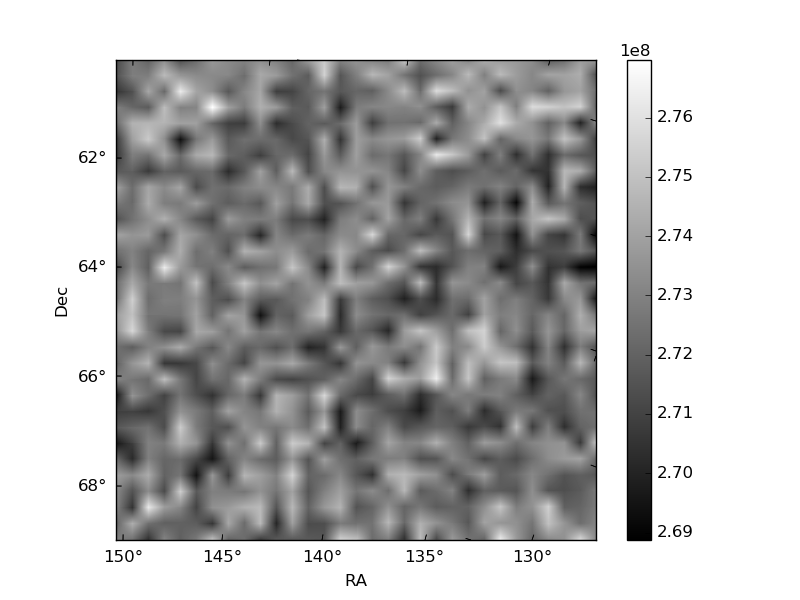
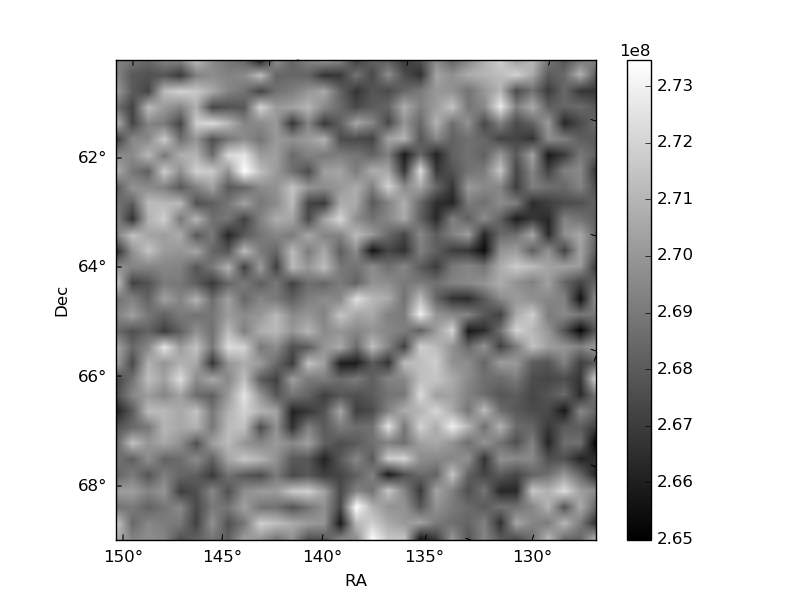
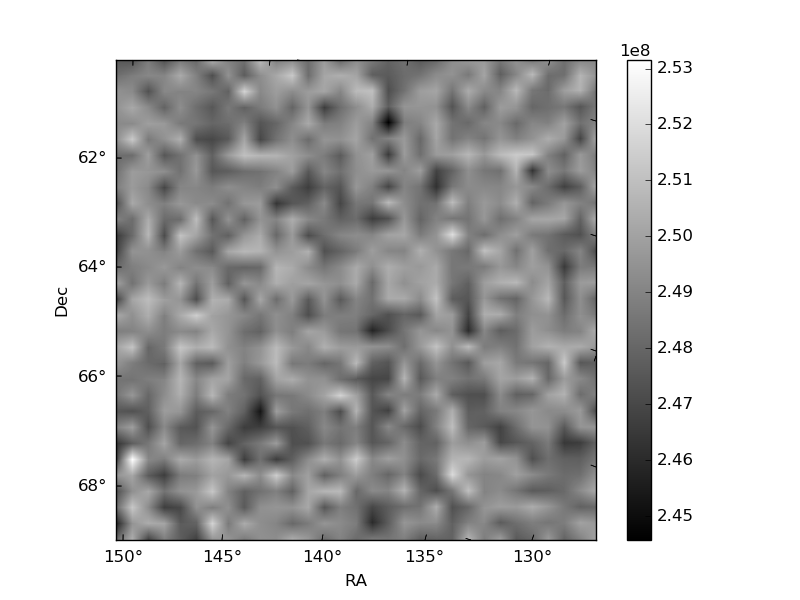
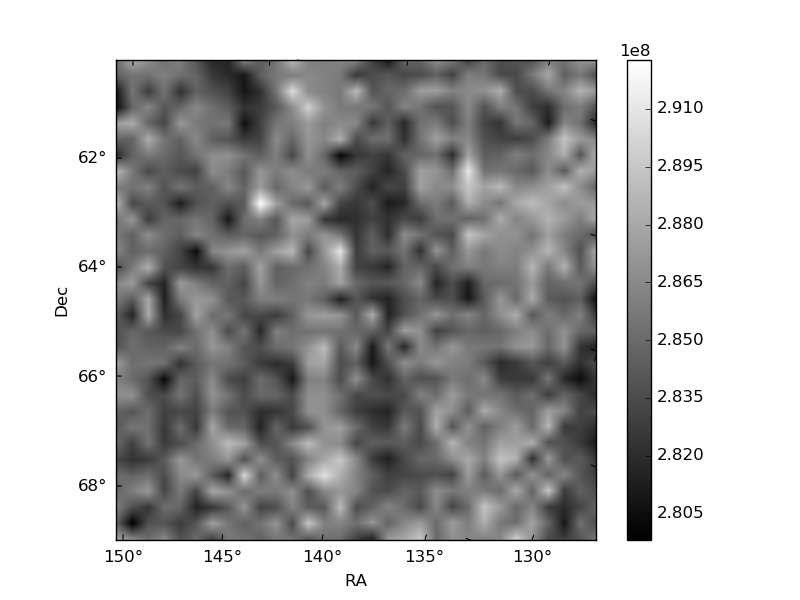
Histogram calculated using DETX and DETY for each event in the final _common_clean file
| Quadrant A | 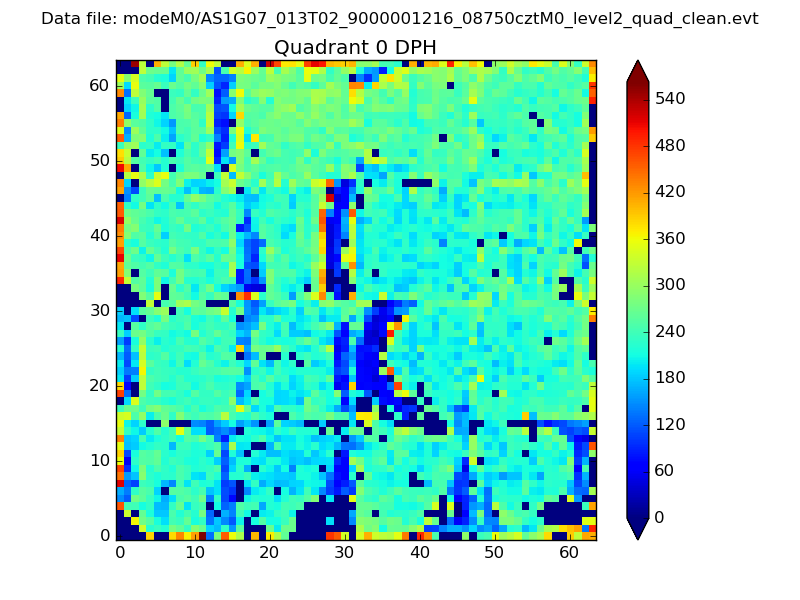 |
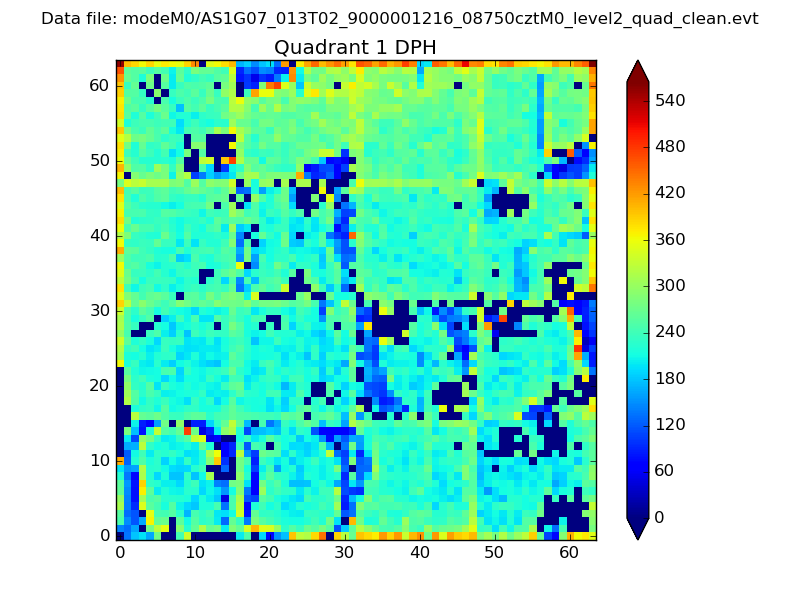 |
Quadrant B |
|---|---|---|---|
| Quadrant D | 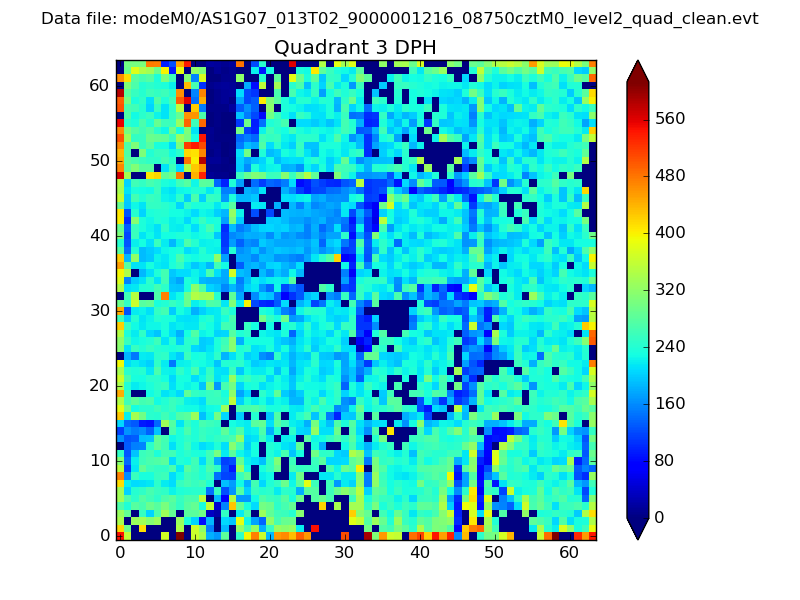 |
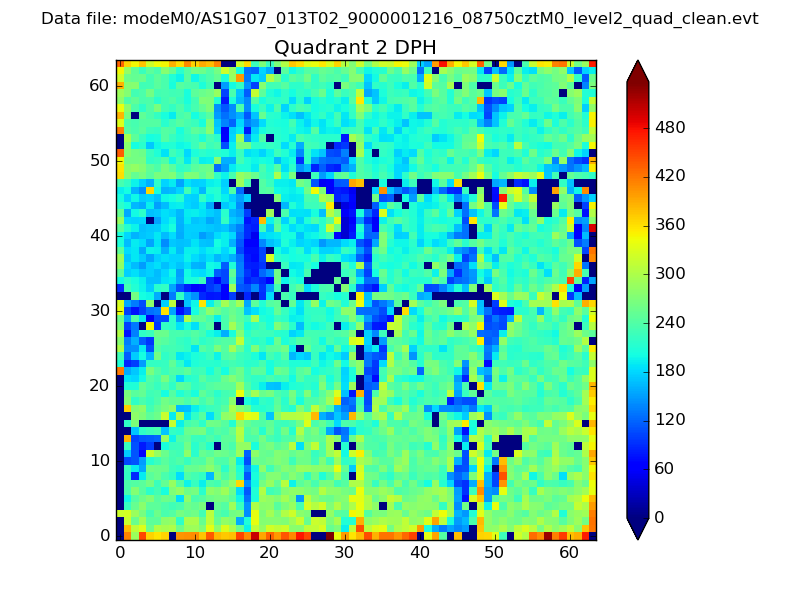 |
Quadrant C |
| Plot type | Count rate plots | Images |
|---|---|---|
| Comparison with Poisson distribution Blue bars denote a histogram of data divided into 1 sec bins. Red curve is a Poisson curve with rate = median count rate of data. |
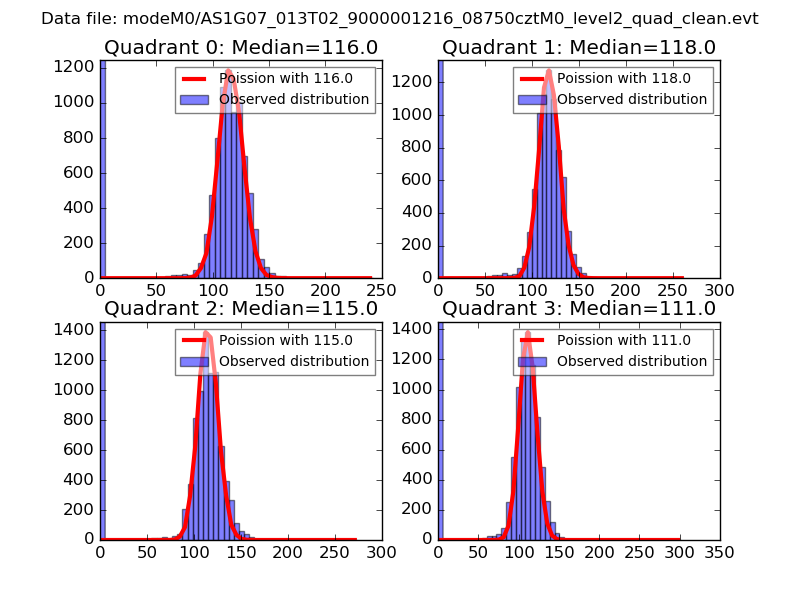 |
 |
| Quadrant-wise count rates Data is divided into 100 sec bins |
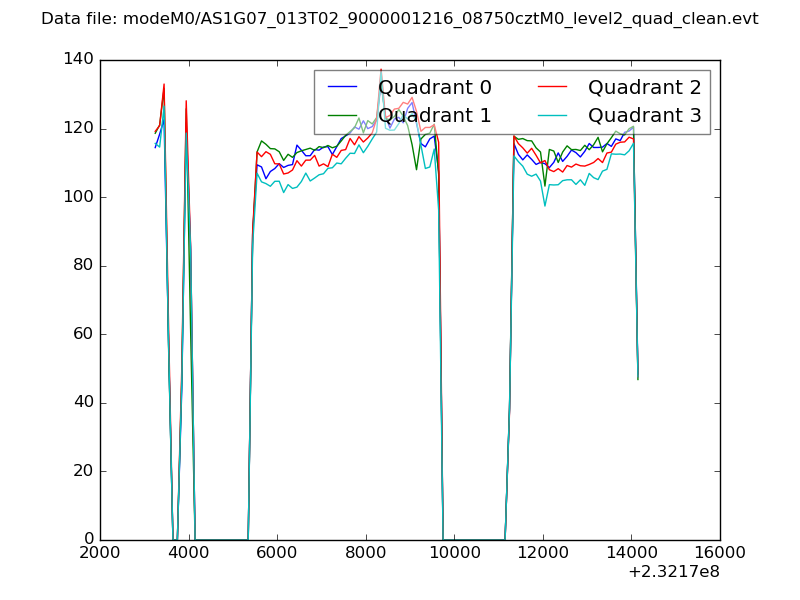 |
|
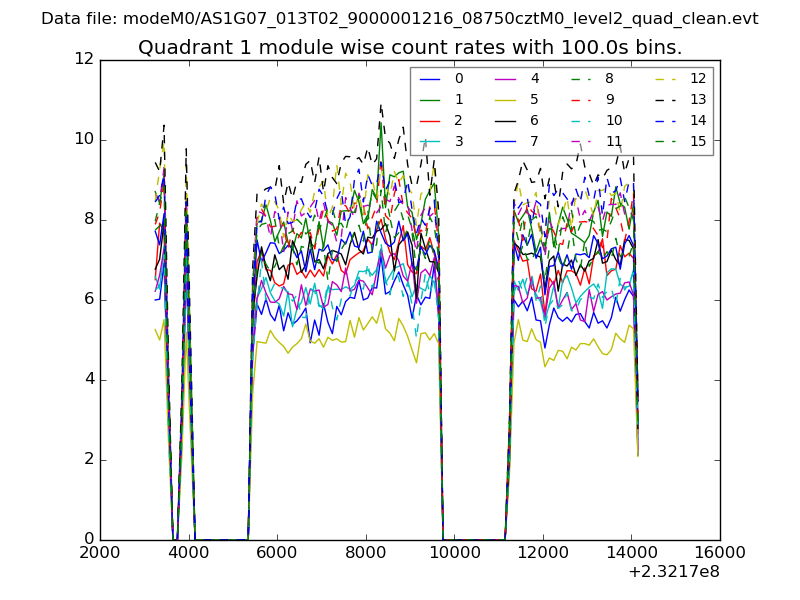
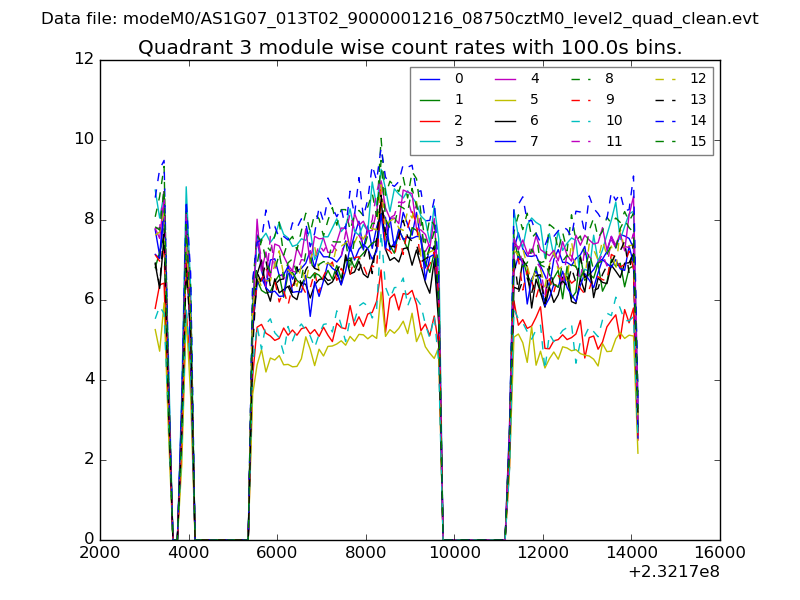
| Module-wise count rates for Quadrant A Data is divided into 100 sec bins |
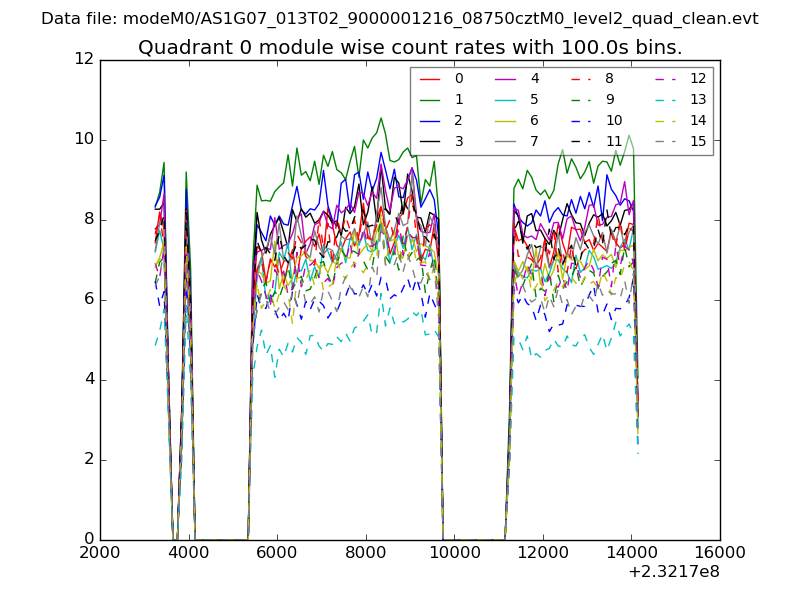 |
 |
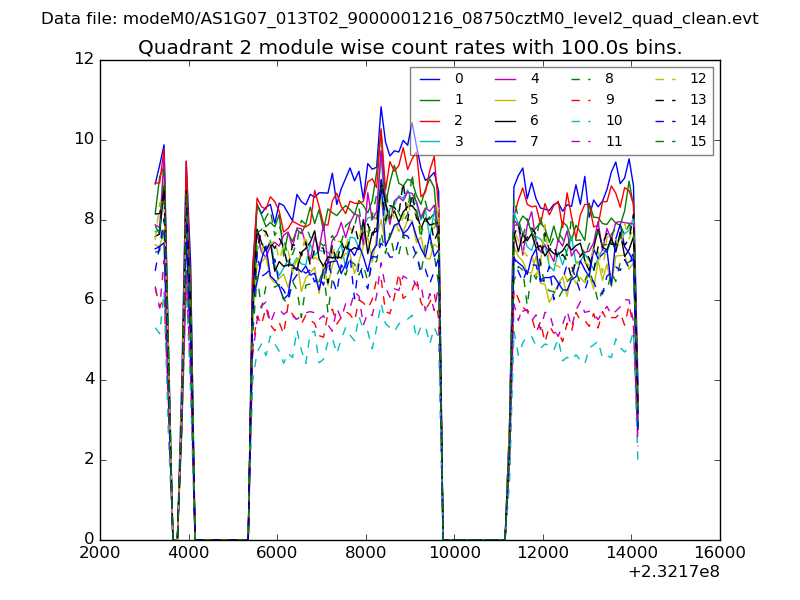
| Module-wise count rates for Quadrant B Data is divided into 100 sec bins |
 |
 |
| Module-wise count rates for Quadrant C Data is divided into 100 sec bins |
 |
 |
| Module-wise count rates for Quadrant D Data is divided into 100 sec bins |
 |
 |
| Parameter | Plot |
|---|---|
| CZT HV Monitor | 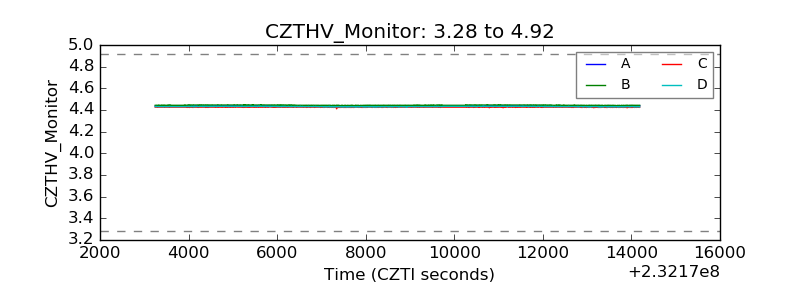 |
| D_VDD | 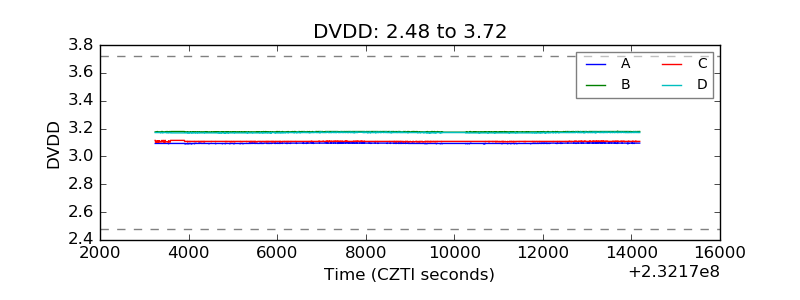 |
| Temperature 1 | 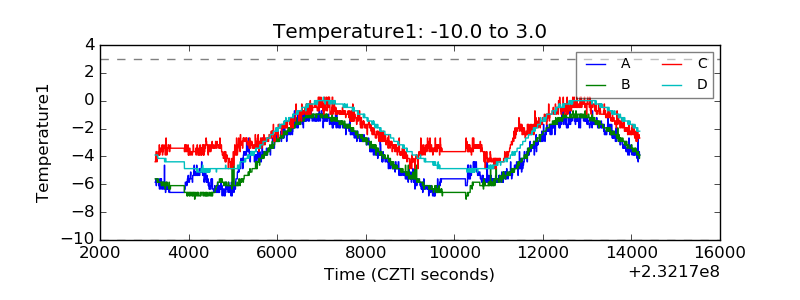 |
| Veto HV Monitor | 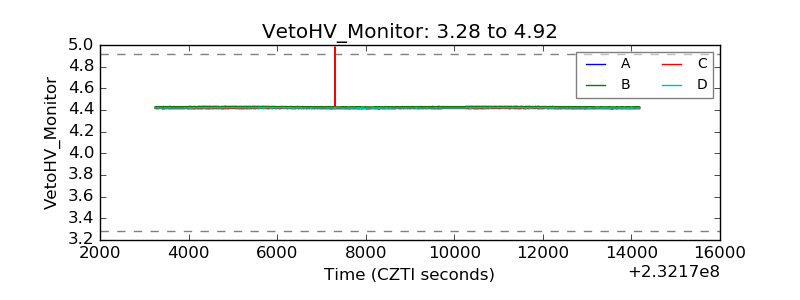 |
| Veto LLD | 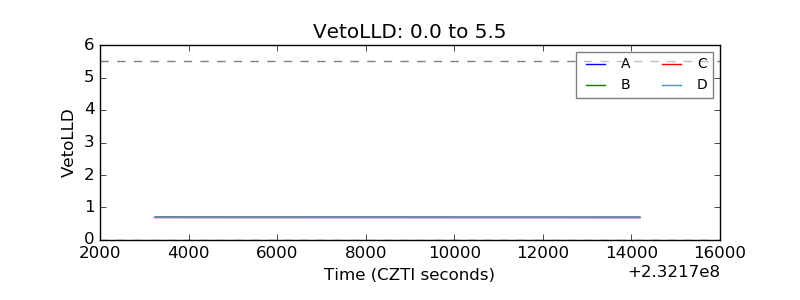 |
| Alpha Counter | 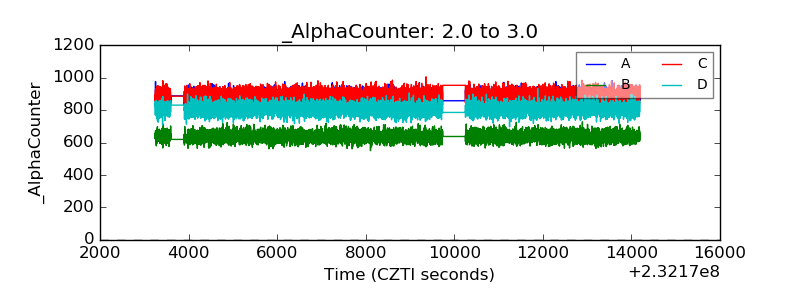 |
| _CPM_Rate | 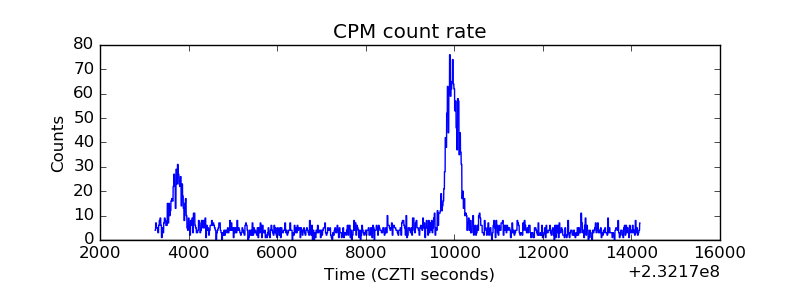 |
| CZT Counter | 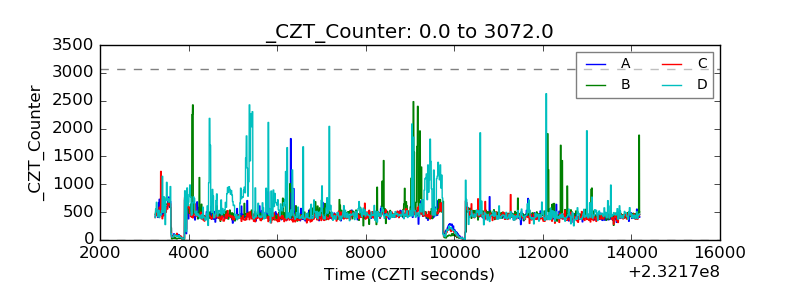 |
| +2.5 Volts monitor |  |
| +5 Volts monitor |  |
| _ROLL_ROT | 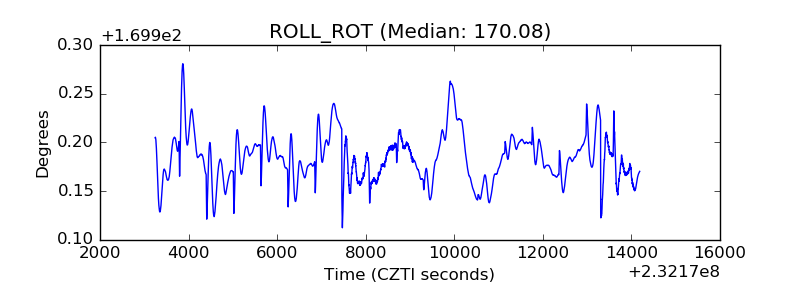 |
| _Roll_DEC | 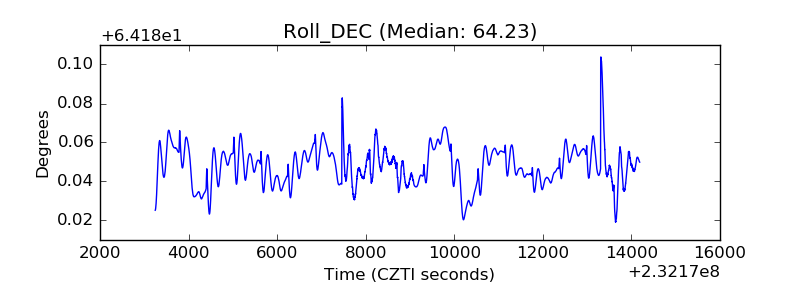 |
| _Roll_RA | 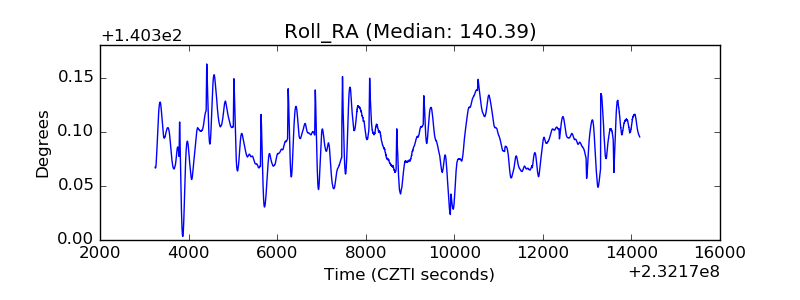 |
| Veto Counter | 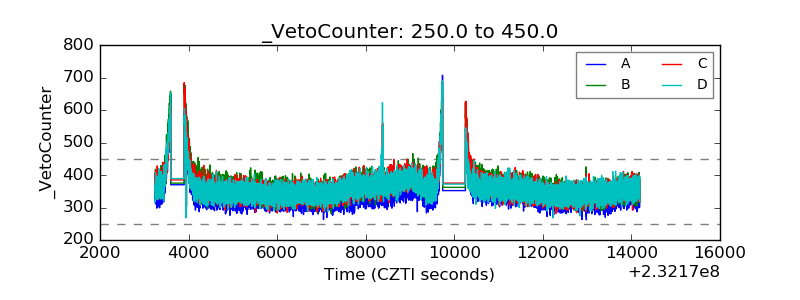 |