| Param | Original file | Final file |
|---|---|---|
| Filename | modeM0/AS1A03_038T01_9000001218cztM0_level2.fits | modeM0/AS1A03_038T01_9000001218cztM0_level2_quad_clean.evt |
| Size (bytes) | 840,542,400 | 754,914,240 |
| Size | 801.6 MB | 719.9 MB |
| Events in quadrant A | 5,112,632 | 4,440,485 |
| Events in quadrant B | 4,943,256 | 4,447,653 |
| Events in quadrant C | 5,056,946 | 4,247,504 |
| Events in quadrant D | 4,216,748 | 3,603,473 |
| Mode M9 | |||
|---|---|---|---|
| Quadrant | BADHDUFLAG | Total packets | Discarded packets |
| A | 0 | 144 | 0 |
| B | 0 | 144 | 0 |
| C | 0 | 143 | 0 |
| D | 0 | 145 | 0 |
| Mode M0 | |||
|---|---|---|---|
| Quadrant | BADHDUFLAG | Total packets | Discarded packets |
| A | 0 | 187957 | 0 |
| B | 0 | 185628 | 0 |
| C | 0 | 184743 | 0 |
| D | 0 | 247215 | 0 |
| Mode SS | |||
|---|---|---|---|
| Quadrant | BADHDUFLAG | Total packets | Discarded packets |
| A | 0 | 1828 | 0 |
| B | 0 | 1824 | 0 |
| C | 0 | 1824 | 0 |
| D | 0 | 1828 | 0 |
| Quadrant | Total seconds | Saturated seconds | Saturation percentage |
|---|---|---|---|
| A | 89341 | 1250 | 1.399134% |
| B | 89360 | 1278 | 1.430170% |
| C | 89362 | 843 | 0.943354% |
| D | 89120 | 6878 | 7.717684% |
Noise dominated data is calculated using 1-second bins in cleaned event files. If a bin has >2000 counts, and if more than 50% of those come from <1% of pixels, then it is considered to be noise-dominated and hence unusable.
| Quadrant | # 1 sec bins | Bins with >0 counts | Bins with >2000 counts | High rate bins dominated by noise | Noise dominated (total time) | Noise dominated (detector-on time) | Marked lightcurve |
|---|---|---|---|---|---|---|---|
| A | 104358 | 89740 | 0 | 0 | 0.00% | 0.00% |  |
| B | 104357 | 89761 | 0 | 0 | 0.00% | 0.00% | 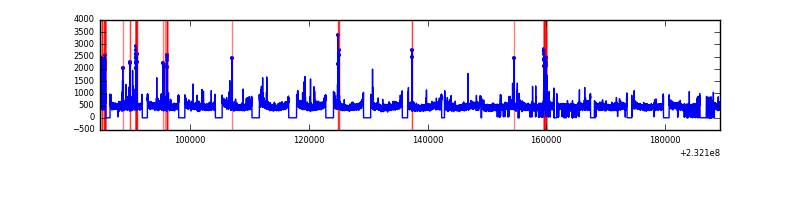 |
| C | 104358 | 89772 | 0 | 0 | 0.00% | 0.00% | 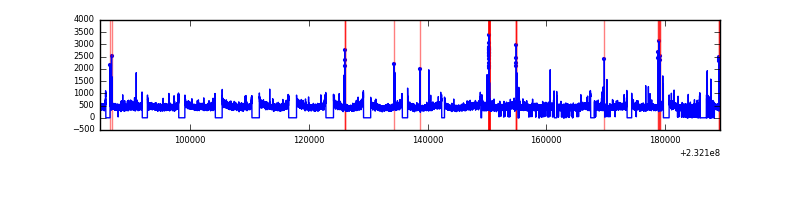 |
| D | 104357 | 89390 | 0 | 0 | 0.00% | 0.00% | 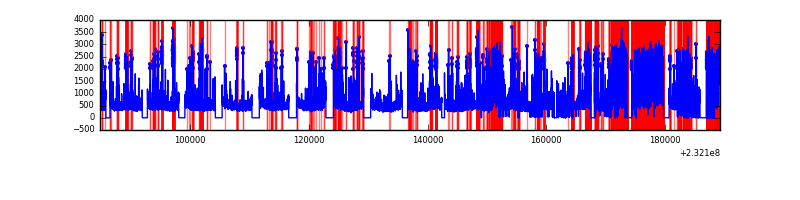 |
Top three noisy pixels from each quadrant. If the there are fewer than three noisy pixels in the level2.evt file, extra rows are filled as -1
| Pixel properties | Quadrant properties | ||||||
|---|---|---|---|---|---|---|---|
| Quadrant | DetID | PixID | Counts | Sigma | Mean | Median | Sigma |
| A | 0 | 29 | 4817 | 10.65 | 1330 | 1239 | 336.1 |
| A | 7 | 110 | 4082 | 8.46 | 1330 | 1239 | 336.1 |
| A | 9 | 19 | 3776 | 7.55 | 1330 | 1239 | 336.1 |
| B | 2 | 9 | 4395 | 12.23 | 1301 | 1233 | 258.6 |
| B | 2 | 8 | 3423 | 8.47 | 1301 | 1233 | 258.6 |
| B | 3 | 17 | 3326 | 8.09 | 1301 | 1233 | 258.6 |
| C | 1 | 80 | 3849 | 7.44 | 1336 | 1240 | 350.9 |
| C | 1 | 81 | 3773 | 7.22 | 1336 | 1240 | 350.9 |
| C | 12 | 241 | 3620 | 6.78 | 1336 | 1240 | 350.9 |
| D | 3 | 14 | 3127 | 6.43 | 1201 | 1091 | 316.7 |
| D | 6 | 231 | 3068 | 6.24 | 1201 | 1091 | 316.7 |
| D | 1 | 19 | 3026 | 6.11 | 1201 | 1091 | 316.7 |
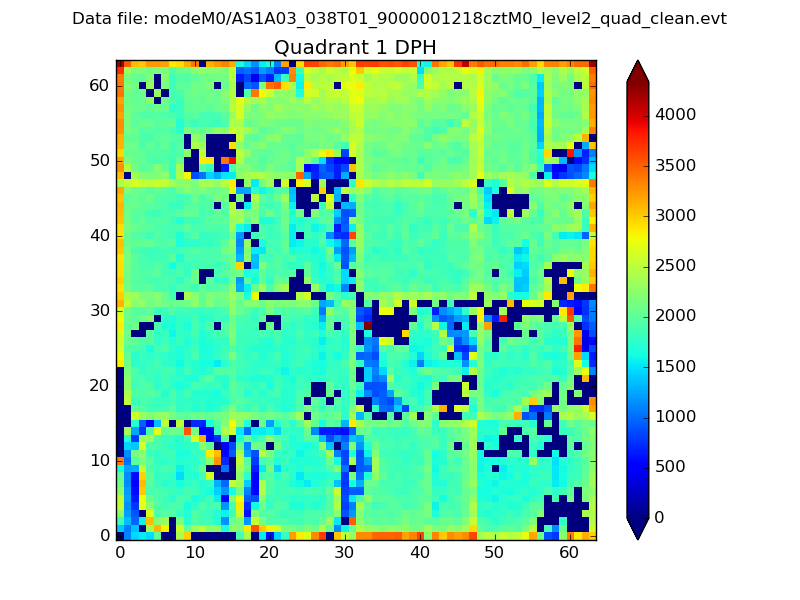
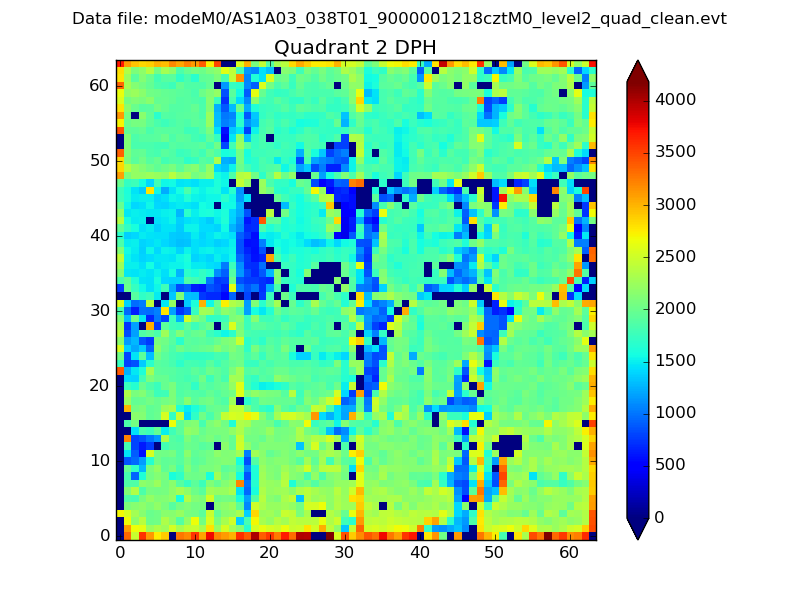
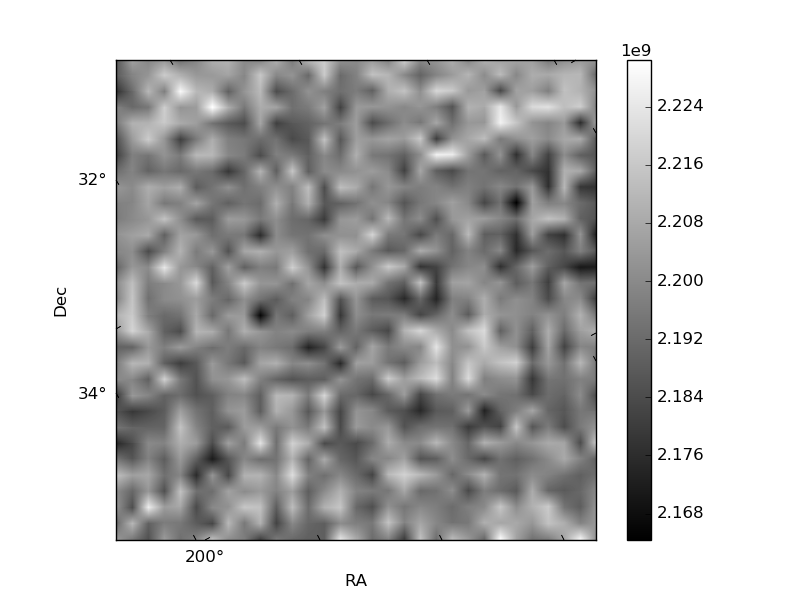
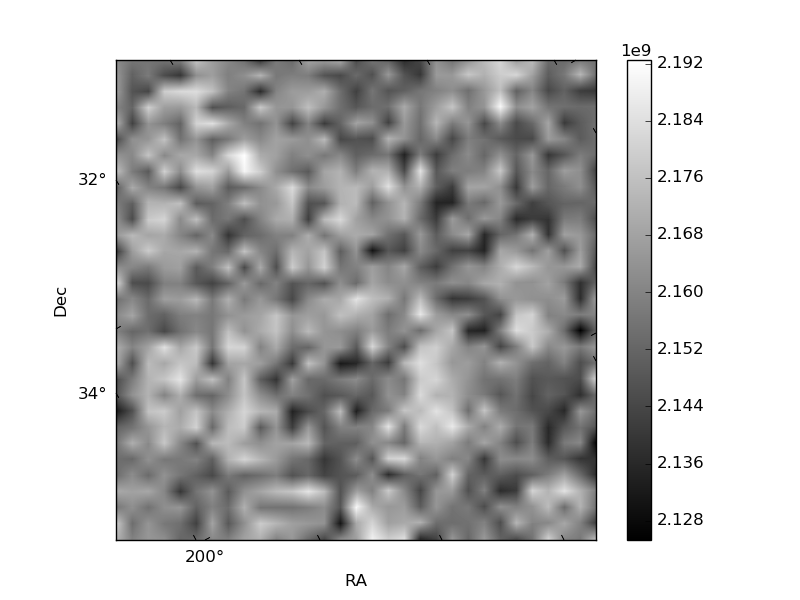
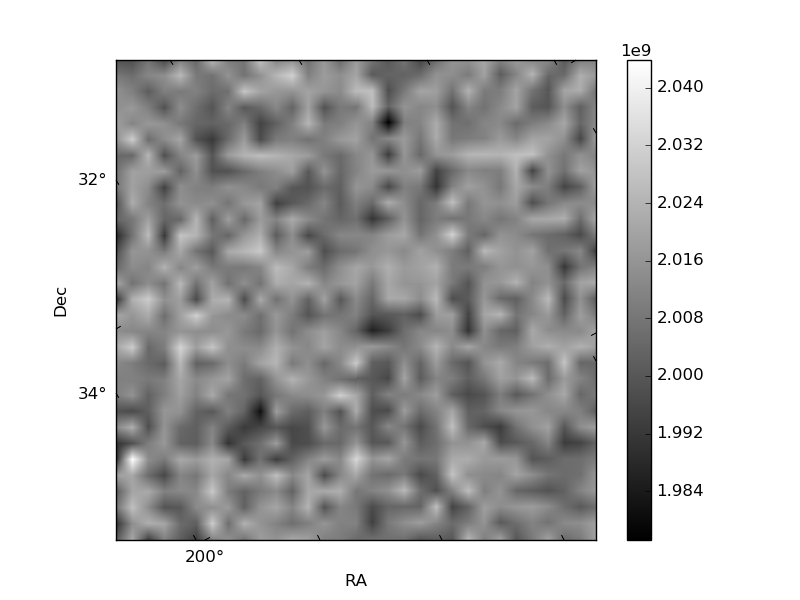
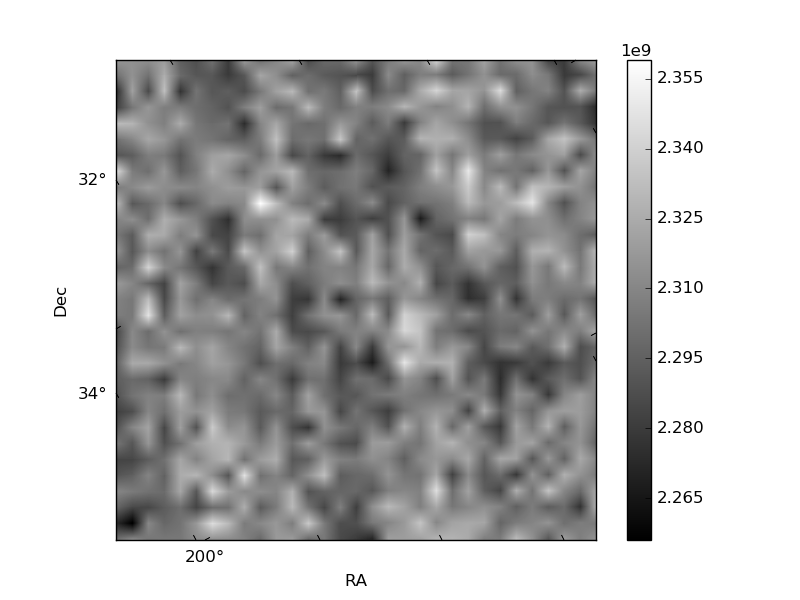
Histogram calculated using DETX and DETY for each event in the final _common_clean file
| Quadrant A | 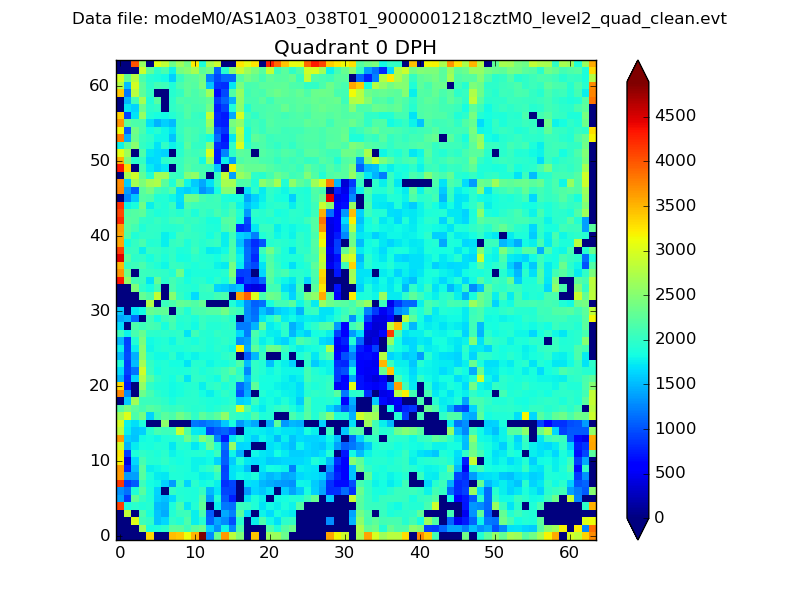 |
 |
Quadrant B |
|---|---|---|---|
| Quadrant D | 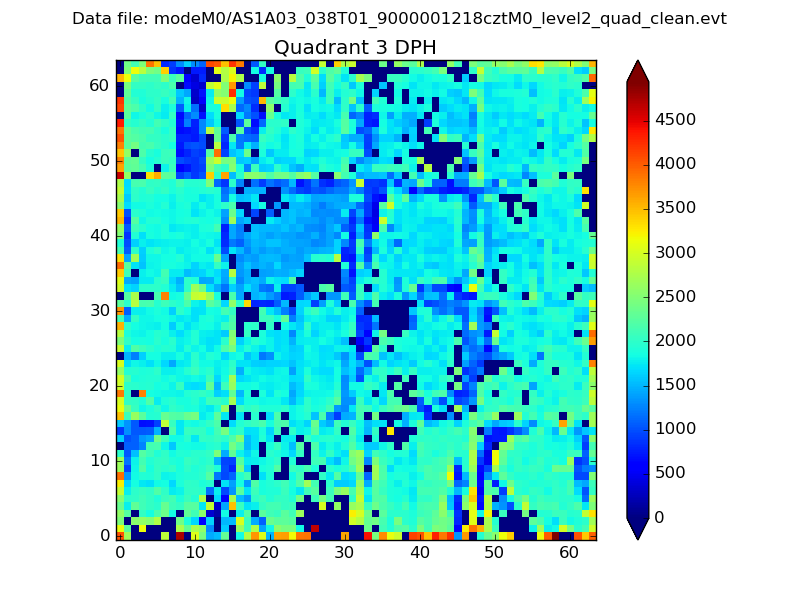 |
 |
Quadrant C |
| Plot type | Count rate plots | Images |
|---|---|---|
| Comparison with Poisson distribution Blue bars denote a histogram of data divided into 1 sec bins. Red curve is a Poisson curve with rate = median count rate of data. |
 |
 |
| Quadrant-wise count rates Data is divided into 100 sec bins |
 |
|
| Module-wise count rates for Quadrant A Data is divided into 100 sec bins |
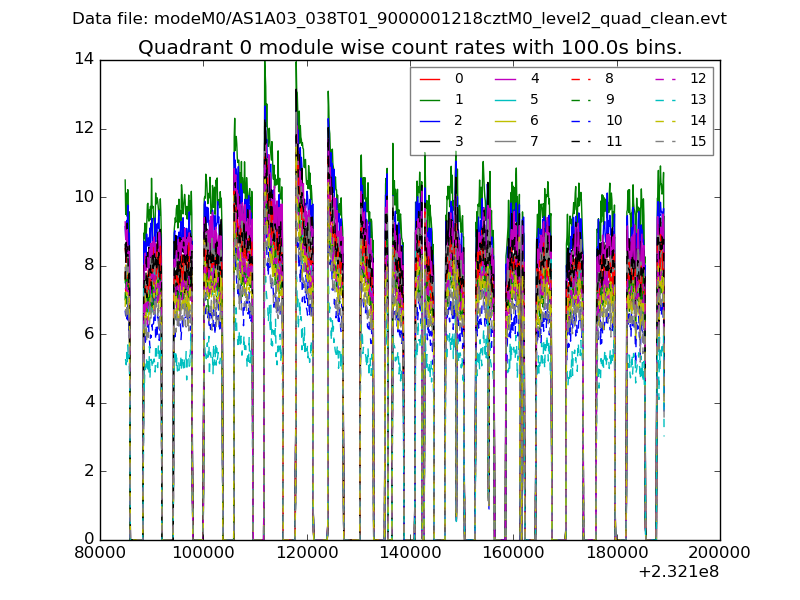 |
 |
| Module-wise count rates for Quadrant B Data is divided into 100 sec bins |
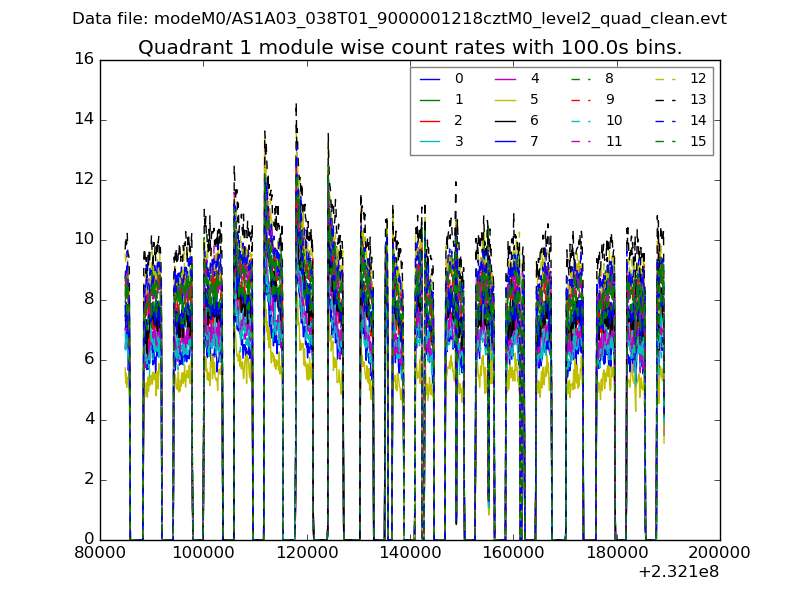 |
 |
| Module-wise count rates for Quadrant C Data is divided into 100 sec bins |
 |
 |
| Module-wise count rates for Quadrant D Data is divided into 100 sec bins |
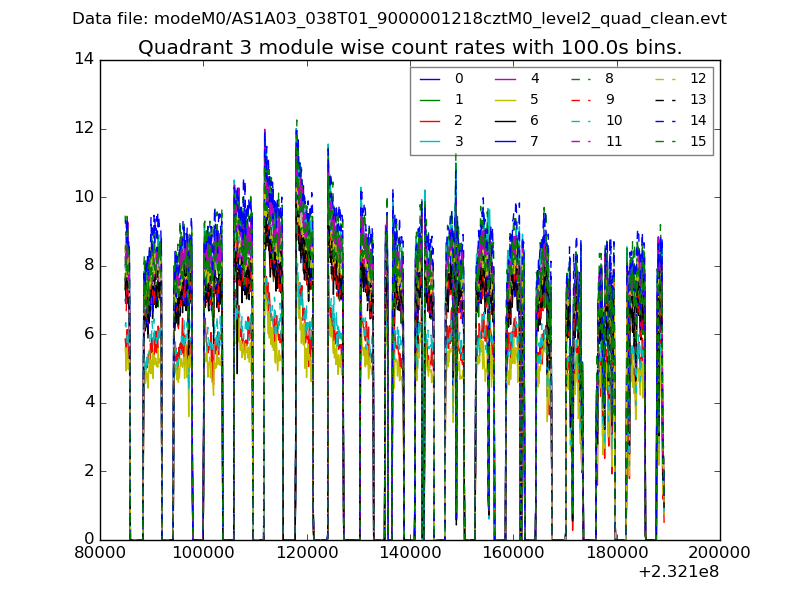 |
 |
| Parameter | Plot |
|---|---|
| CZT HV Monitor | 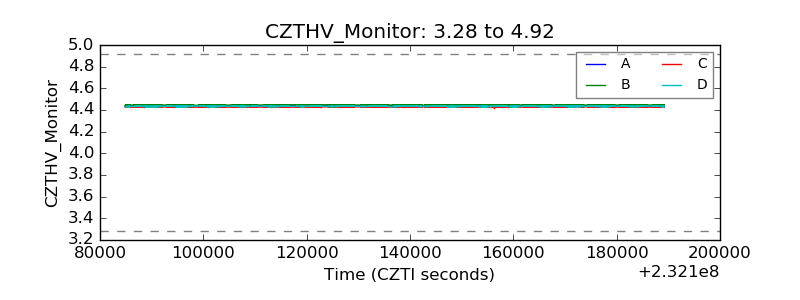 |
| D_VDD | 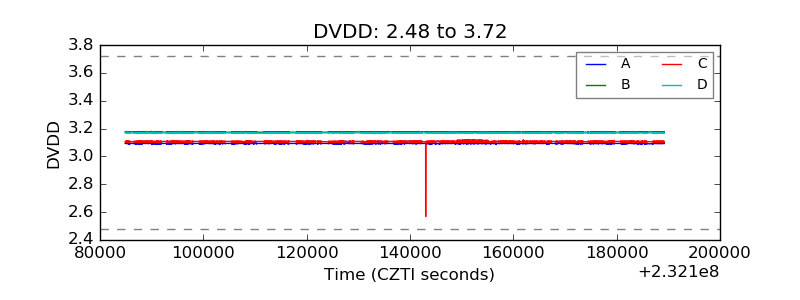 |
| Temperature 1 | 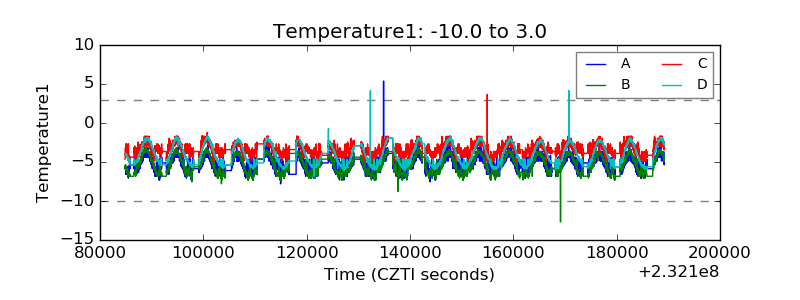 |
| Veto HV Monitor | 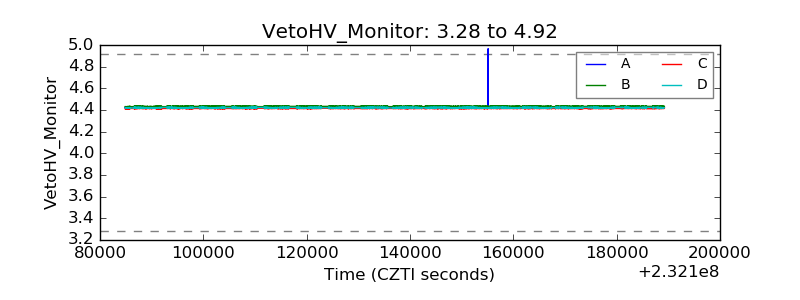 |
| Veto LLD | 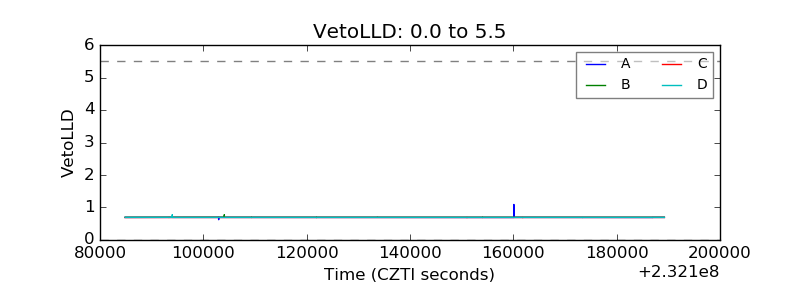 |
| Alpha Counter | 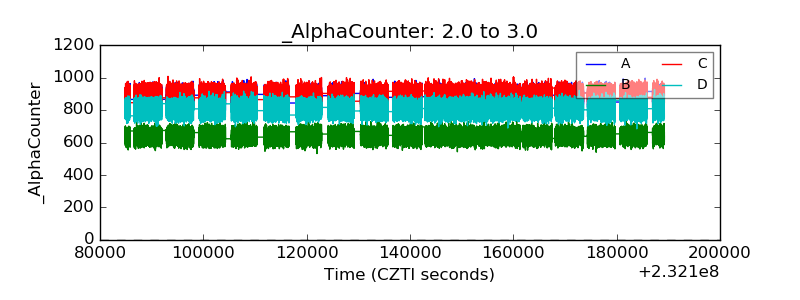 |
| _CPM_Rate | 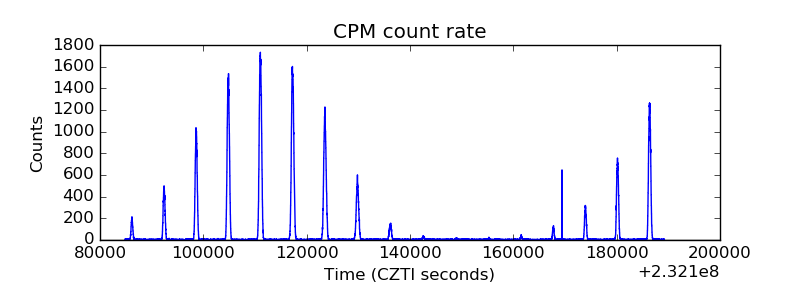 |
| CZT Counter |  |
| +2.5 Volts monitor | 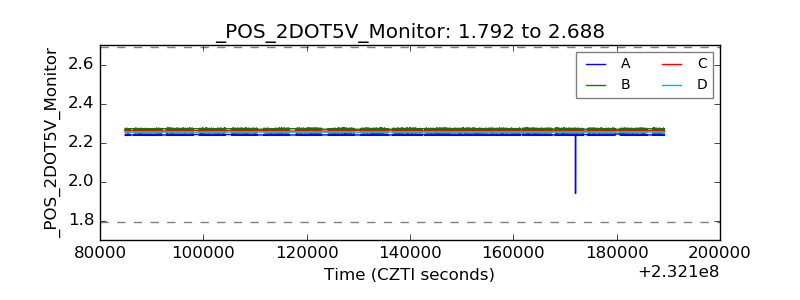 |
| +5 Volts monitor | 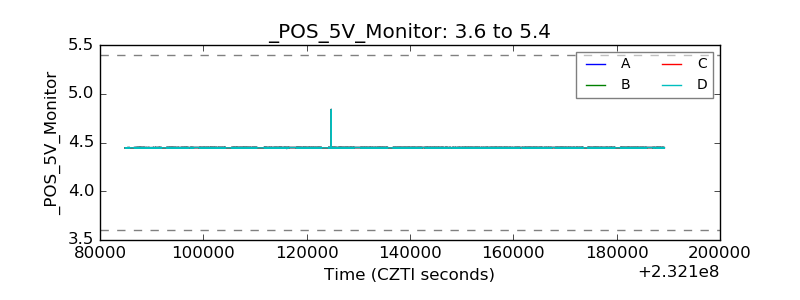 |
| _ROLL_ROT |  |
| _Roll_DEC | 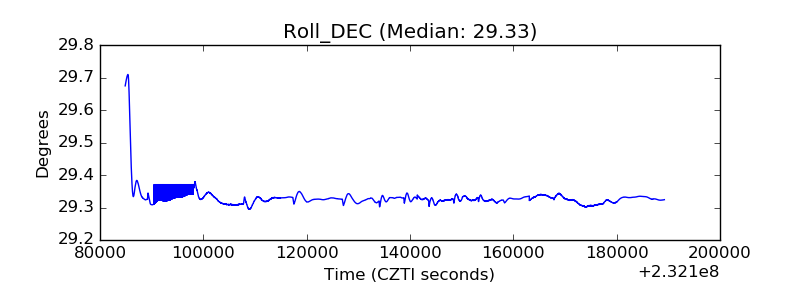 |
| _Roll_RA | 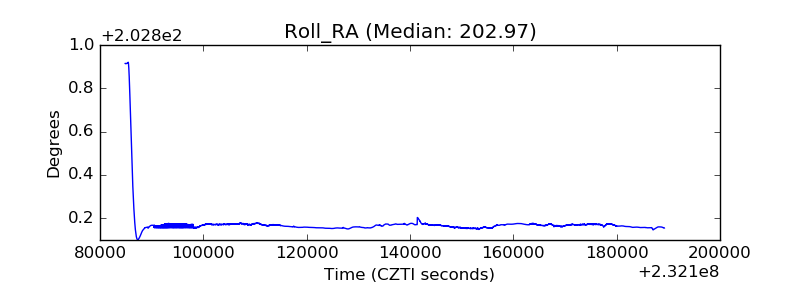 |
| Veto Counter |  |