| Param | Original file | Final file |
|---|---|---|
| Filename | modeM0/AS1A03_038T01_9000001218_08750cztM0_level2.evt | modeM0/AS1A03_038T01_9000001218_08750cztM0_level2_quad_clean.evt |
| Size (bytes) | 181,008,000 | 21,723,840 |
| Size | 172.6 MB | 20.7 MB |
| Events in quadrant A | 1,299,631 | 118,119 |
| Events in quadrant B | 1,349,800 | 117,587 |
| Events in quadrant C | 1,212,757 | 120,917 |
| Events in quadrant D | 1,442,328 | 115,721 |
| Mode M9 | |||
|---|---|---|---|
| Quadrant | BADHDUFLAG | Total packets | Discarded packets |
| A | 0 | 7 | 0 |
| B | 0 | 7 | 0 |
| C | 0 | 7 | 0 |
| D | 0 | 7 | 0 |
| Mode M0 | |||
|---|---|---|---|
| Quadrant | BADHDUFLAG | Total packets | Discarded packets |
| A | 0 | 5506 | 6 |
| B | 0 | 5581 | 3 |
| C | 0 | 5325 | 5 |
| D | 0 | 6002 | 1 |
| Mode SS | |||
|---|---|---|---|
| Quadrant | BADHDUFLAG | Total packets | Discarded packets |
| A | 0 | 54 | 0 |
| B | 0 | 54 | 0 |
| C | 0 | 54 | 0 |
| D | 0 | 54 | 0 |
| Quadrant | Total seconds | Saturated seconds | Saturation percentage |
|---|---|---|---|
| A | 2574 | 66 | 2.564103% |
| B | 2575 | 85 | 3.300971% |
| C | 2574 | 40 | 1.554002% |
| D | 2576 | 64 | 2.484472% |
Noise dominated data is calculated using 1-second bins in cleaned event files. If a bin has >2000 counts, and if more than 50% of those come from <1% of pixels, then it is considered to be noise-dominated and hence unusable.
| Quadrant | # 1 sec bins | Bins with >0 counts | Bins with >2000 counts | High rate bins dominated by noise | Noise dominated (total time) | Noise dominated (detector-on time) | Marked lightcurve |
|---|---|---|---|---|---|---|---|
| A | 3301 | 2576 | 5 | 5 | 0.15% | 0.19% |  |
| B | 3301 | 2576 | 15 | 15 | 0.45% | 0.58% |  |
| C | 3301 | 2576 | 2 | 2 | 0.06% | 0.08% |  |
| D | 3301 | 2576 | 16 | 16 | 0.48% | 0.62% | 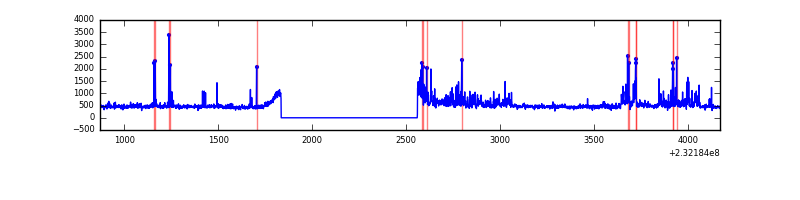 |
Top three noisy pixels from each quadrant. If the there are fewer than three noisy pixels in the level2.evt file, extra rows are filled as -1
| Pixel properties | Quadrant properties | ||||||
|---|---|---|---|---|---|---|---|
| Quadrant | DetID | PixID | Counts | Sigma | Mean | Median | Sigma |
| A | 13 | 251 | 64489 | 949.21 | 317 | 309 | 67.6 |
| A | 5 | 16 | 6541 | 92.17 | 317 | 309 | 67.6 |
| A | 13 | 14 | 3739 | 50.73 | 317 | 309 | 67.6 |
| B | 10 | 16 | 89490 | 1383.37 | 319 | 311 | 64.5 |
| B | 0 | 214 | 7384 | 109.72 | 319 | 311 | 64.5 |
| B | 12 | 111 | 6990 | 103.61 | 319 | 311 | 64.5 |
| C | 1 | 16 | 13738 | 181.18 | 307 | 308 | 74.1 |
| C | 13 | 61 | 2389 | 28.07 | 307 | 308 | 74.1 |
| C | 8 | 222 | 1413 | 14.91 | 307 | 308 | 74.1 |
| D | 2 | 136 | 165138 | 2089.14 | 302 | 293 | 78.9 |
| D | 13 | 122 | 30175 | 378.71 | 302 | 293 | 78.9 |
| D | 1 | 52 | 29176 | 366.05 | 302 | 293 | 78.9 |
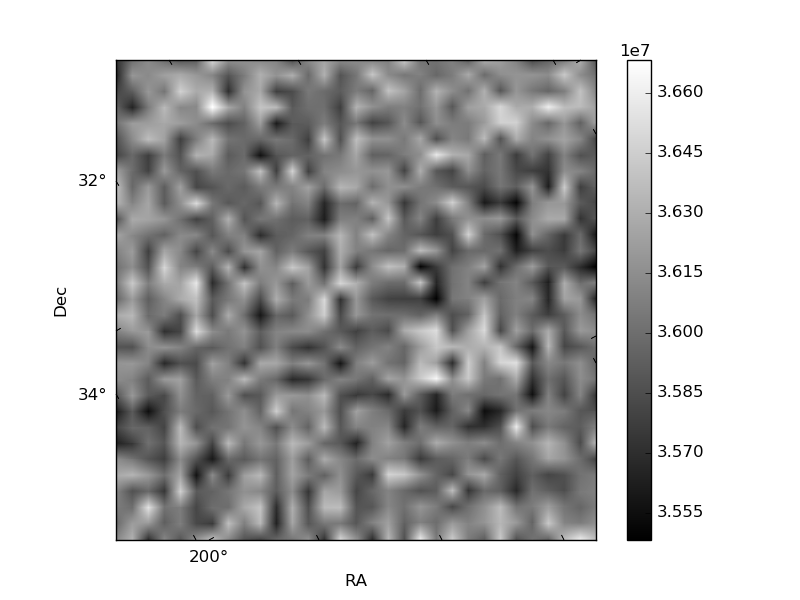
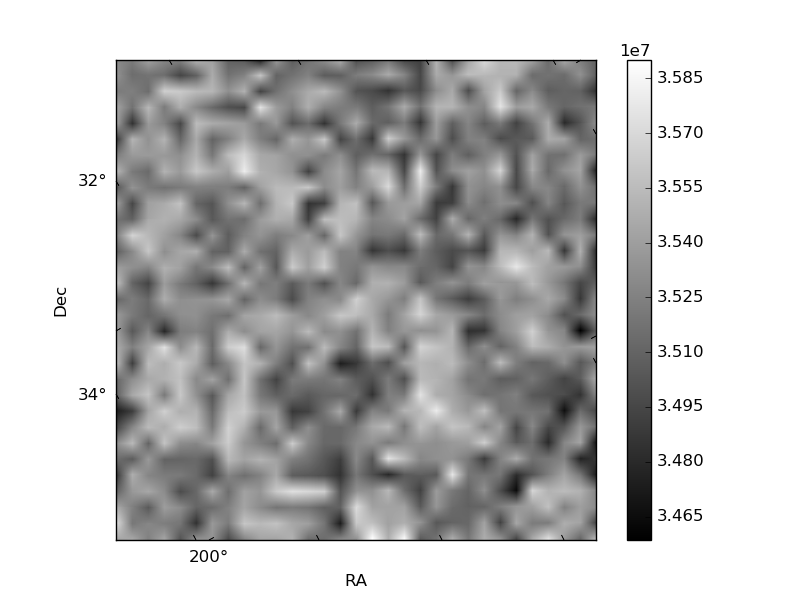
Histogram calculated using DETX and DETY for each event in the final _common_clean file
| Quadrant A | 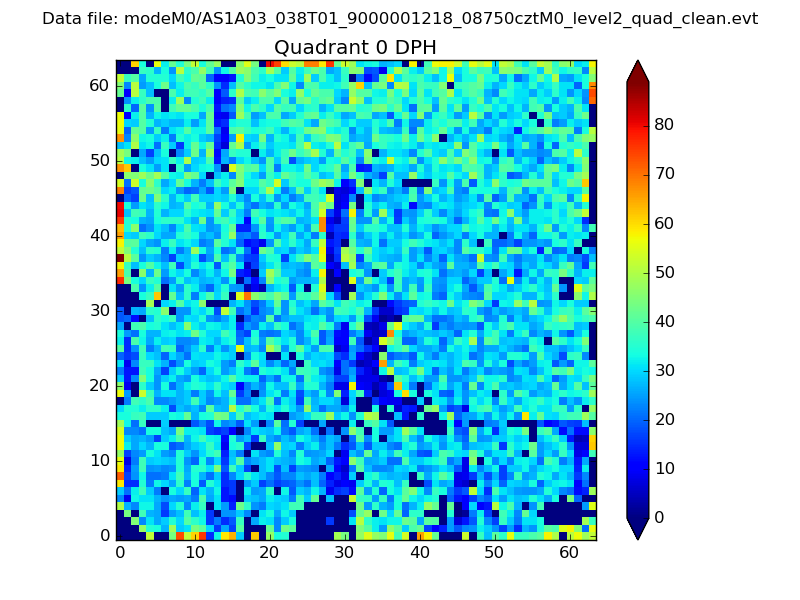 |
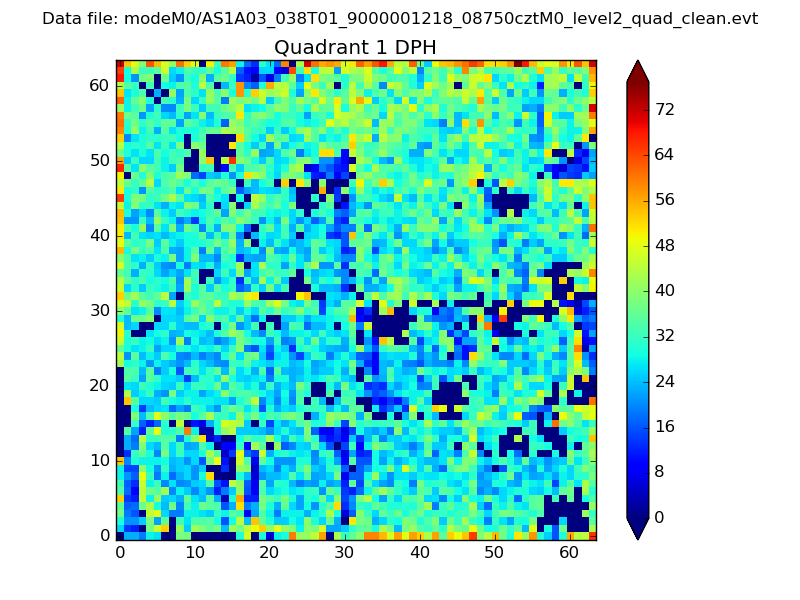 |
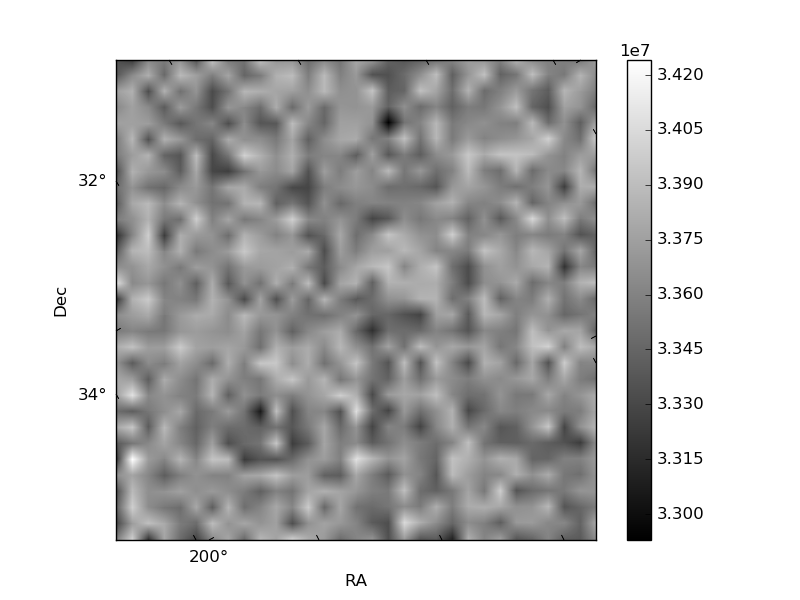
Quadrant B |
|---|---|---|---|
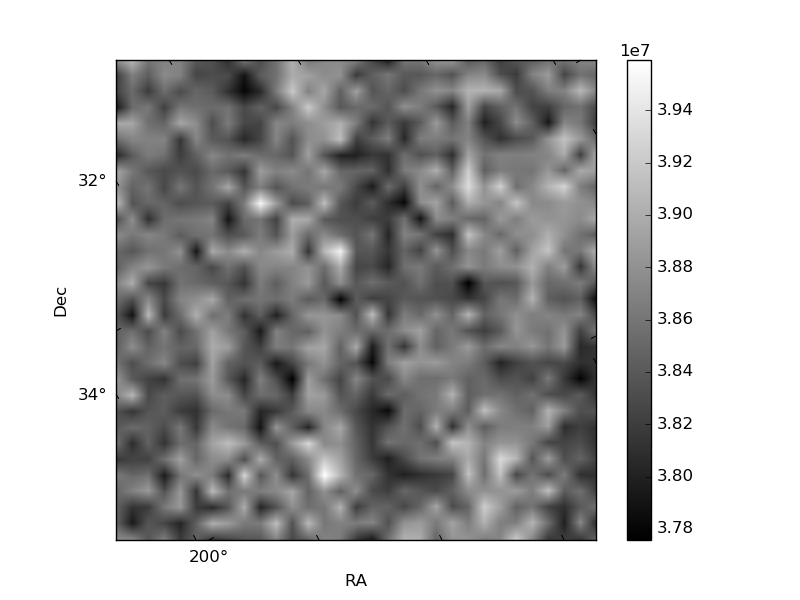
| Quadrant D | 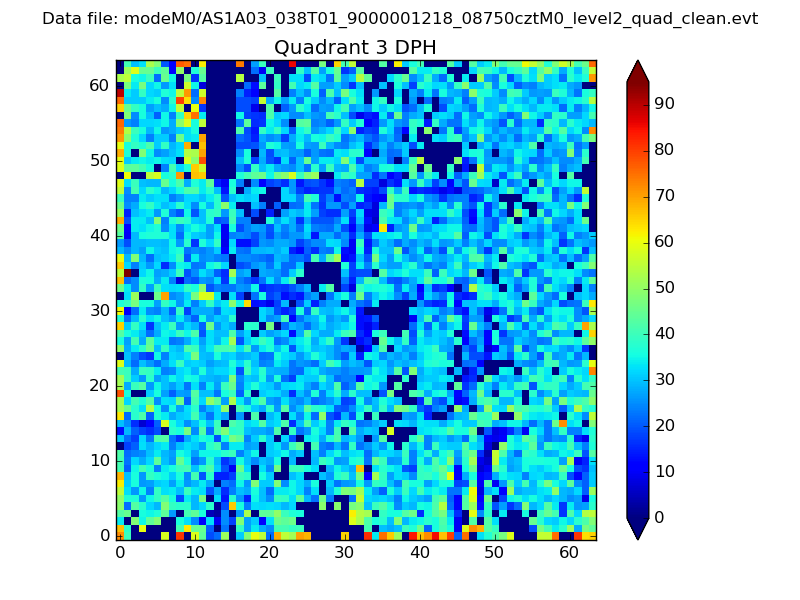 |
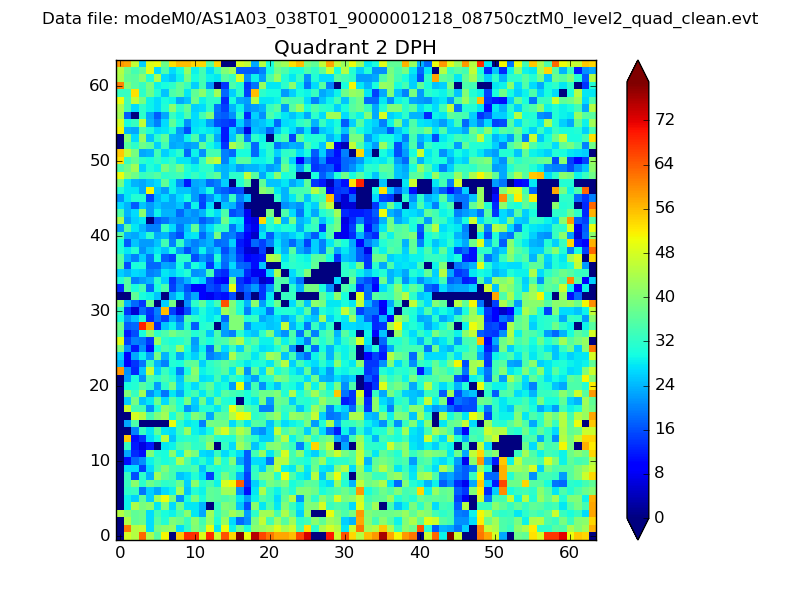 |
Quadrant C |
| Plot type | Count rate plots | Images |
|---|---|---|
| Comparison with Poisson distribution Blue bars denote a histogram of data divided into 1 sec bins. Red curve is a Poisson curve with rate = median count rate of data. |
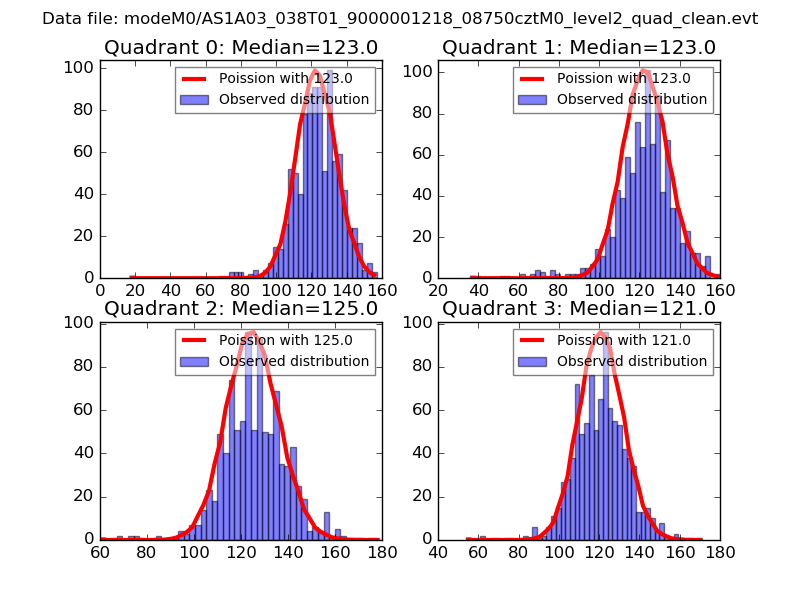 |
 |
| Quadrant-wise count rates Data is divided into 100 sec bins |
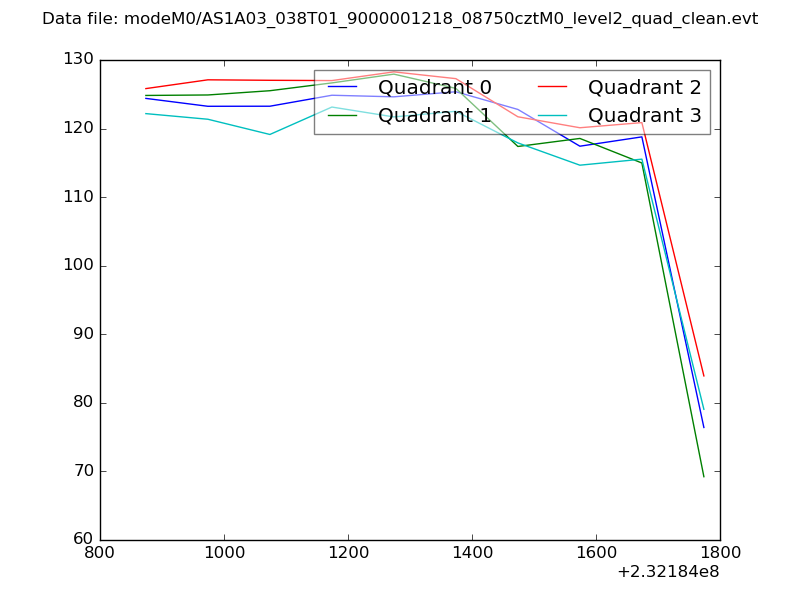 |
|
| Module-wise count rates for Quadrant A Data is divided into 100 sec bins |
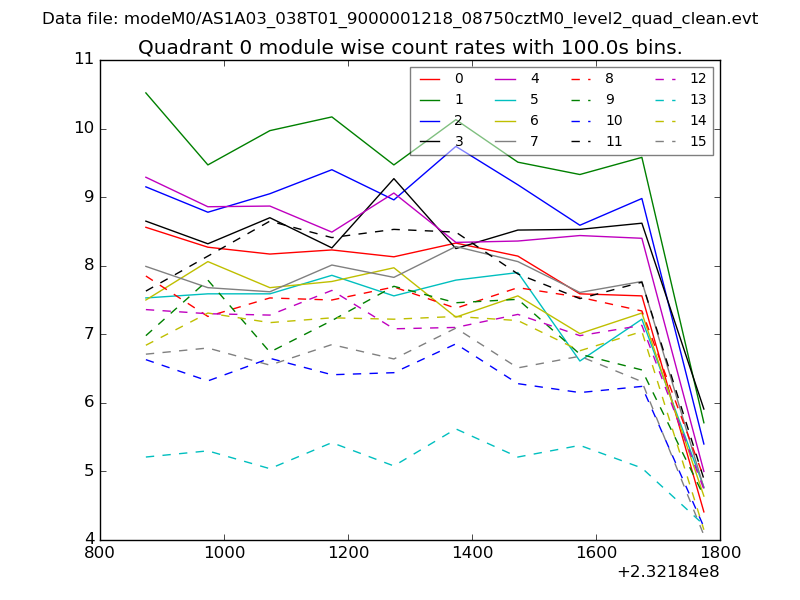 |
 |
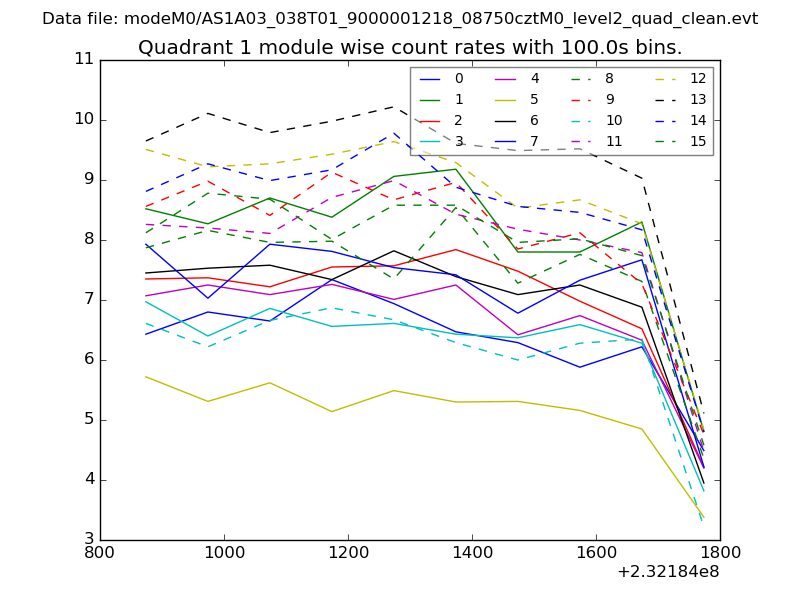
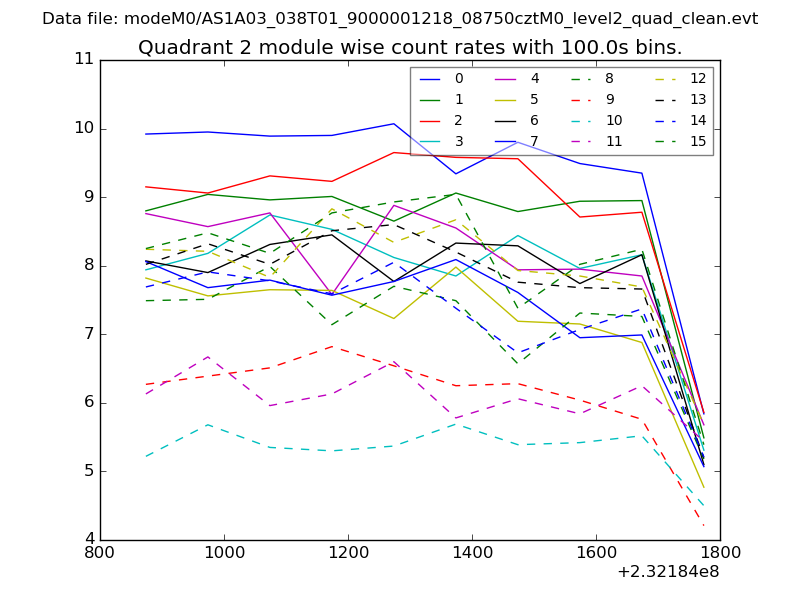
| Module-wise count rates for Quadrant B Data is divided into 100 sec bins |
 |
 |
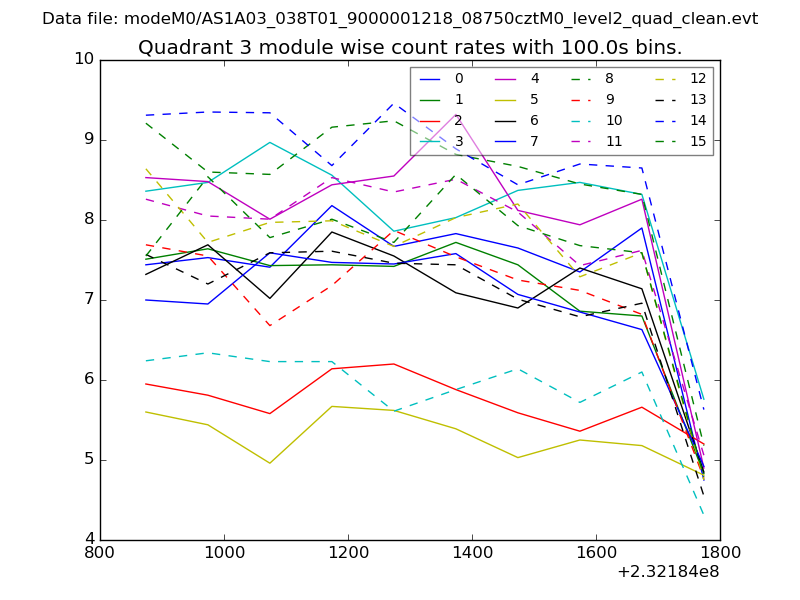
| Module-wise count rates for Quadrant C Data is divided into 100 sec bins |
 |
 |
| Module-wise count rates for Quadrant D Data is divided into 100 sec bins |
 |
 |
| Parameter | Plot |
|---|---|
| CZT HV Monitor | 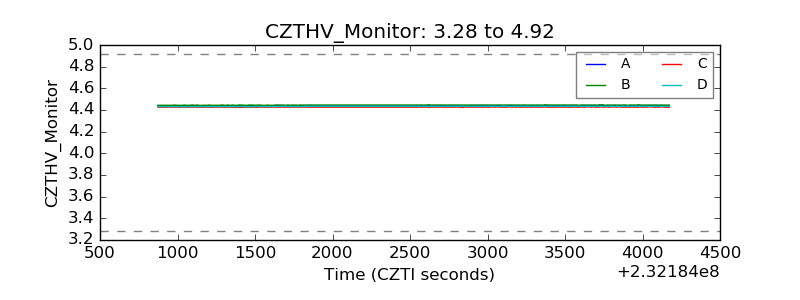 |
| D_VDD | 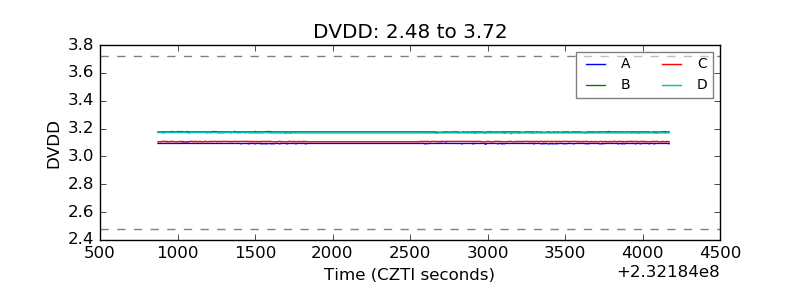 |
| Temperature 1 | 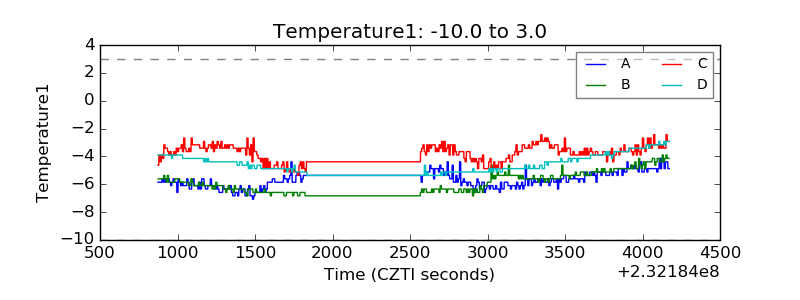 |
| Veto HV Monitor | 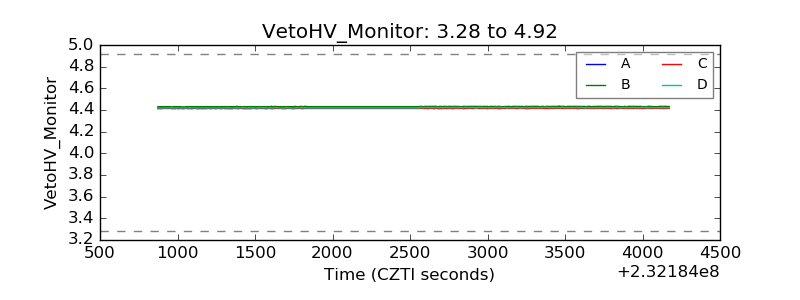 |
| Veto LLD |  |
| Alpha Counter | 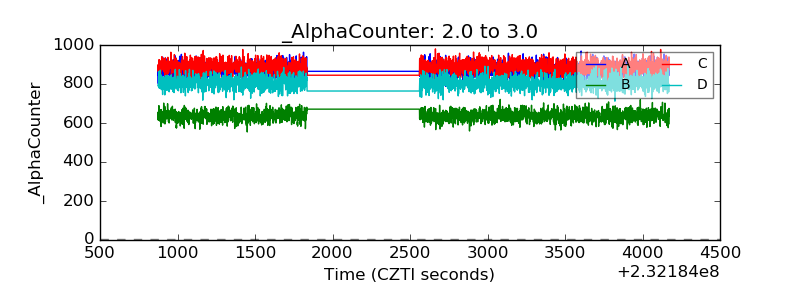 |
| _CPM_Rate | 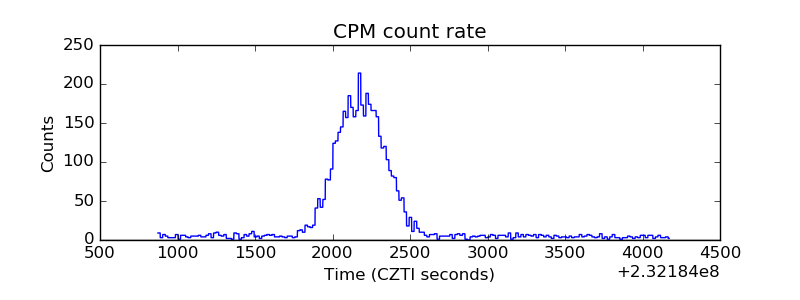 |
| CZT Counter | 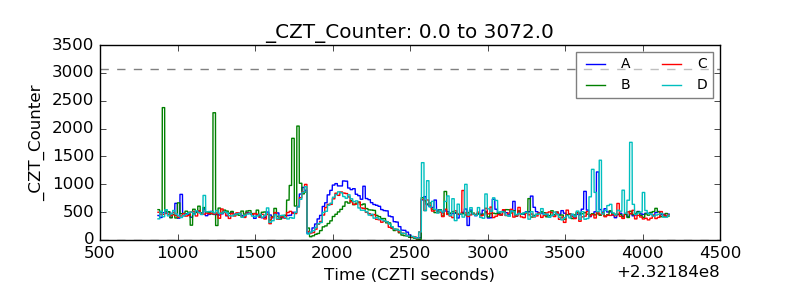 |
| +2.5 Volts monitor |  |
| +5 Volts monitor |  |
| _ROLL_ROT | 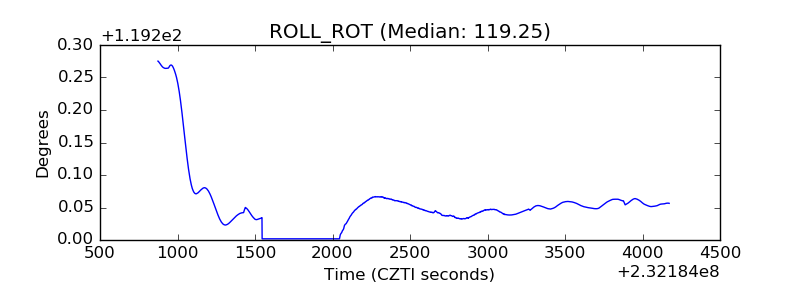 |
| _Roll_DEC | 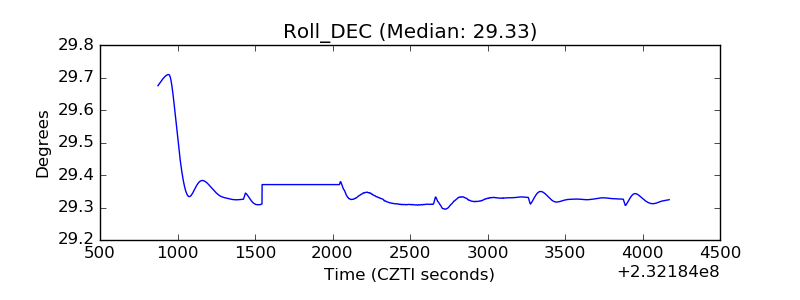 |
| _Roll_RA | 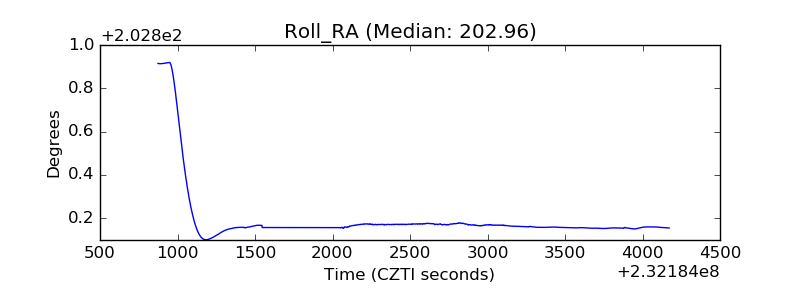 |
| Veto Counter | 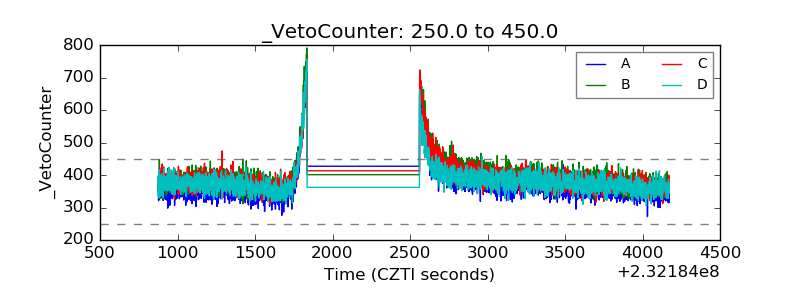 |