| Param | Original file | Final file |
|---|---|---|
| Filename | modeM0/AS1A03_038T01_9000001218_08751cztM0_level2.evt | modeM0/AS1A03_038T01_9000001218_08751cztM0_level2_quad_clean.evt |
| Size (bytes) | 483,903,360 | 77,247,360 |
| Size | 461.5 MB | 73.7 MB |
| Events in quadrant A | 3,462,192 | 461,617 |
| Events in quadrant B | 3,571,950 | 463,889 |
| Events in quadrant C | 3,330,508 | 463,301 |
| Events in quadrant D | 3,800,930 | 448,852 |
| Mode M9 | |||
|---|---|---|---|
| Quadrant | BADHDUFLAG | Total packets | Discarded packets |
| A | 0 | 16 | 0 |
| B | 0 | 16 | 0 |
| C | 0 | 16 | 0 |
| D | 0 | 16 | 0 |
| Mode M0 | |||
|---|---|---|---|
| Quadrant | BADHDUFLAG | Total packets | Discarded packets |
| A | 0 | 15025 | 3 |
| B | 0 | 15210 | 2 |
| C | 0 | 14768 | 2 |
| D | 0 | 16149 | 2 |
| Mode SS | |||
|---|---|---|---|
| Quadrant | BADHDUFLAG | Total packets | Discarded packets |
| A | 0 | 148 | 0 |
| B | 0 | 148 | 0 |
| C | 0 | 148 | 0 |
| D | 0 | 148 | 0 |
| Quadrant | Total seconds | Saturated seconds | Saturation percentage |
|---|---|---|---|
| A | 7200 | 150 | 2.083333% |
| B | 7200 | 167 | 2.319444% |
| C | 7200 | 96 | 1.333333% |
| D | 7200 | 175 | 2.430556% |
Noise dominated data is calculated using 1-second bins in cleaned event files. If a bin has >2000 counts, and if more than 50% of those come from <1% of pixels, then it is considered to be noise-dominated and hence unusable.
| Quadrant | # 1 sec bins | Bins with >0 counts | Bins with >2000 counts | High rate bins dominated by noise | Noise dominated (total time) | Noise dominated (detector-on time) | Marked lightcurve |
|---|---|---|---|---|---|---|---|
| A | 8800 | 7200 | 10 | 10 | 0.11% | 0.14% | 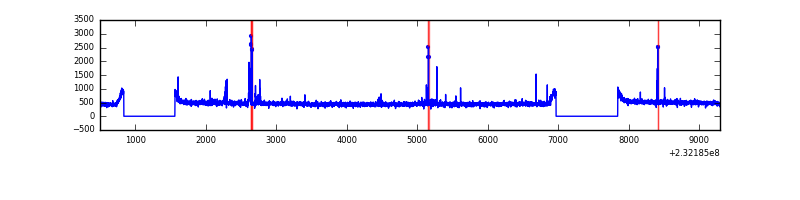 |
| B | 8800 | 7200 | 27 | 27 | 0.31% | 0.38% | 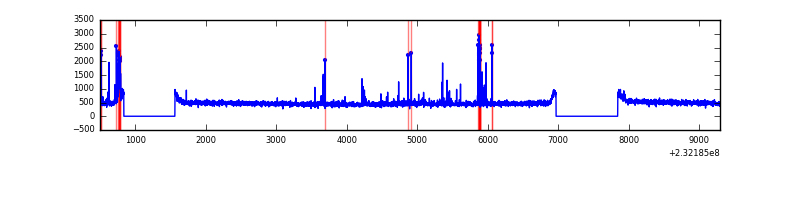 |
| C | 8800 | 7200 | 2 | 2 | 0.02% | 0.03% | 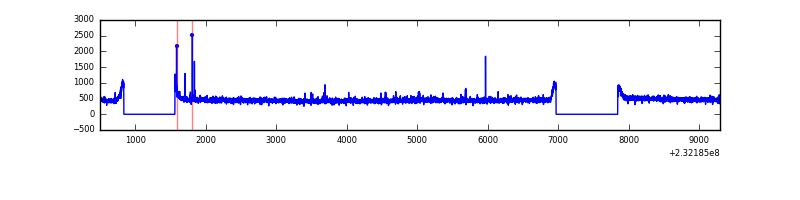 |
| D | 8800 | 7200 | 66 | 66 | 0.75% | 0.92% | 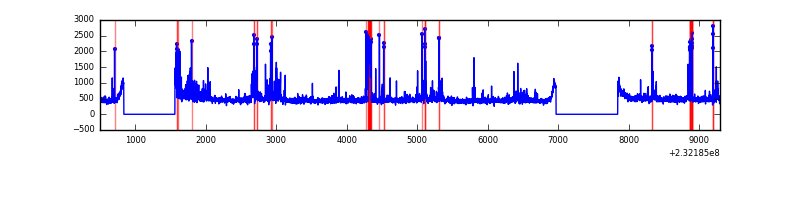 |
Top three noisy pixels from each quadrant. If the there are fewer than three noisy pixels in the level2.evt file, extra rows are filled as -1
| Pixel properties | Quadrant properties | ||||||
|---|---|---|---|---|---|---|---|
| Quadrant | DetID | PixID | Counts | Sigma | Mean | Median | Sigma |
| A | 13 | 251 | 76435 | 419.61 | 869 | 849 | 180.1 |
| A | 5 | 16 | 36035 | 195.33 | 869 | 849 | 180.1 |
| A | 0 | 226 | 7816 | 38.68 | 869 | 849 | 180.1 |
| B | 10 | 16 | 171094 | 1003.74 | 871 | 848 | 169.6 |
| B | 12 | 111 | 18650 | 104.96 | 871 | 848 | 169.6 |
| B | 11 | 111 | 14919 | 82.96 | 871 | 848 | 169.6 |
| C | 1 | 16 | 37714 | 187.1 | 842 | 846 | 197.0 |
| C | 14 | 67 | 6482 | 28.6 | 842 | 846 | 197.0 |
| C | 13 | 61 | 6409 | 28.23 | 842 | 846 | 197.0 |
| D | 2 | 136 | 240045 | 1131.28 | 833 | 812 | 211.5 |
| D | 13 | 122 | 131841 | 619.61 | 833 | 812 | 211.5 |
| D | 1 | 52 | 74538 | 348.63 | 833 | 812 | 211.5 |
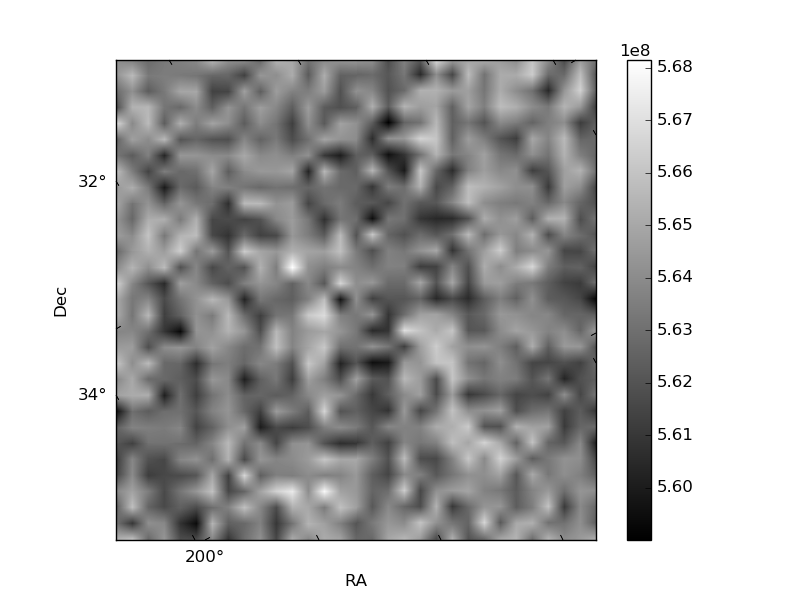
Histogram calculated using DETX and DETY for each event in the final _common_clean file
| Quadrant A | 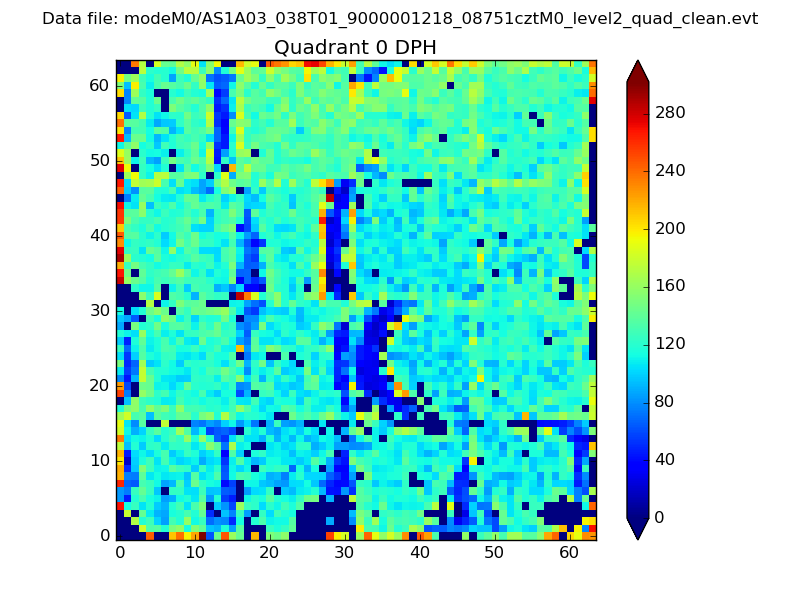 |
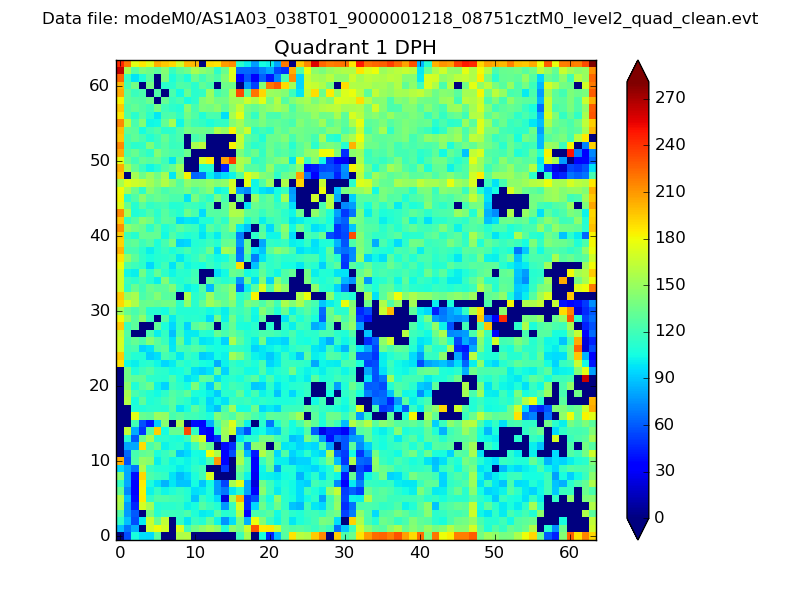 |
Quadrant B |
|---|---|---|---|
| Quadrant D | 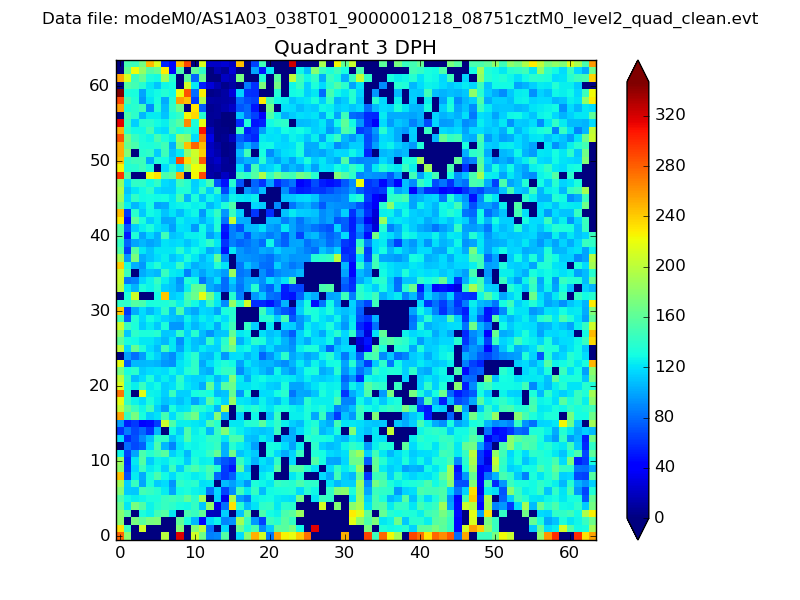 |
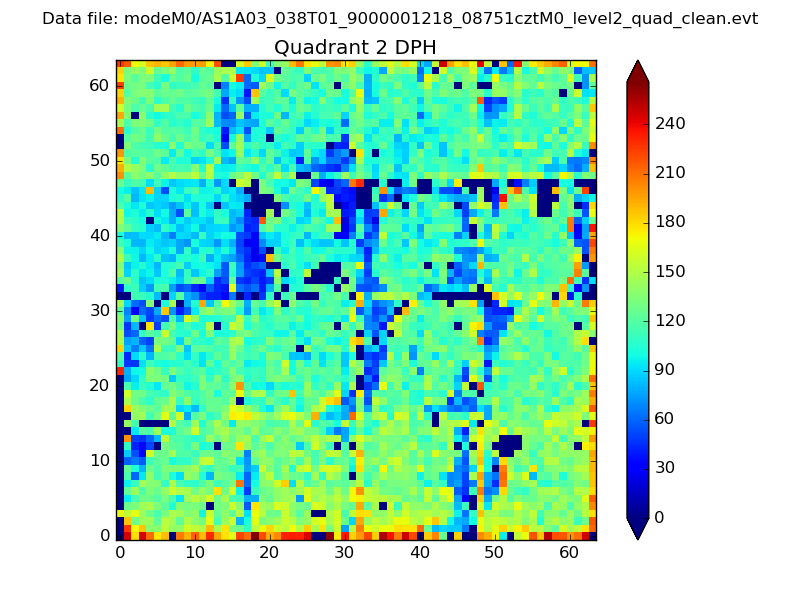 |
Quadrant C |
| Plot type | Count rate plots | Images |
|---|---|---|
| Comparison with Poisson distribution Blue bars denote a histogram of data divided into 1 sec bins. Red curve is a Poisson curve with rate = median count rate of data. |
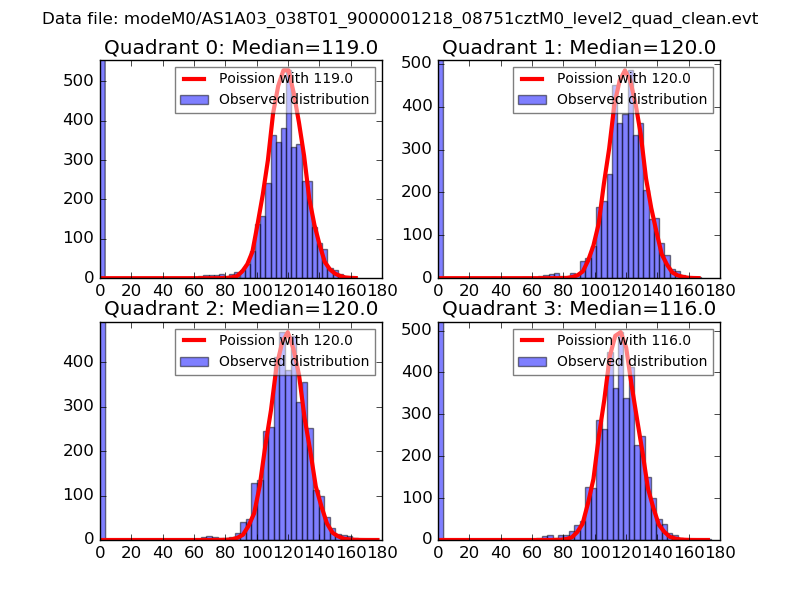 |
 |
| Quadrant-wise count rates Data is divided into 100 sec bins |
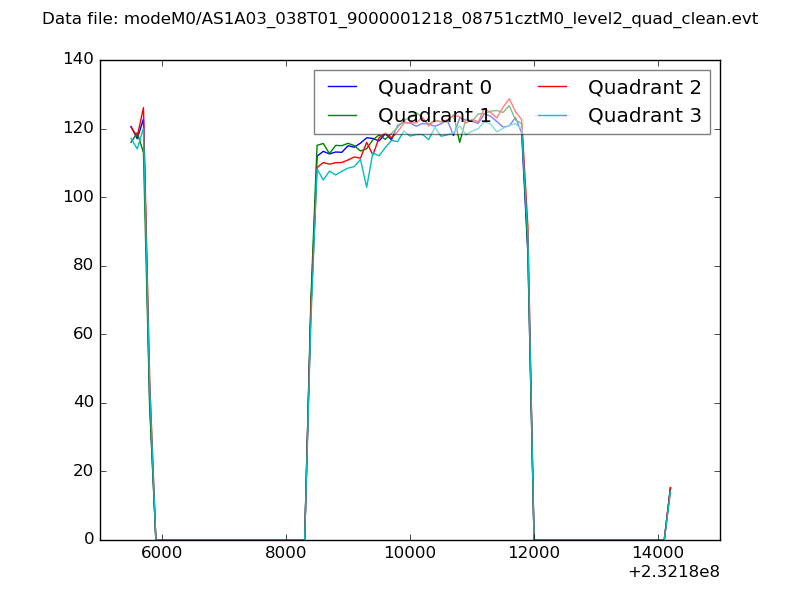 |
|
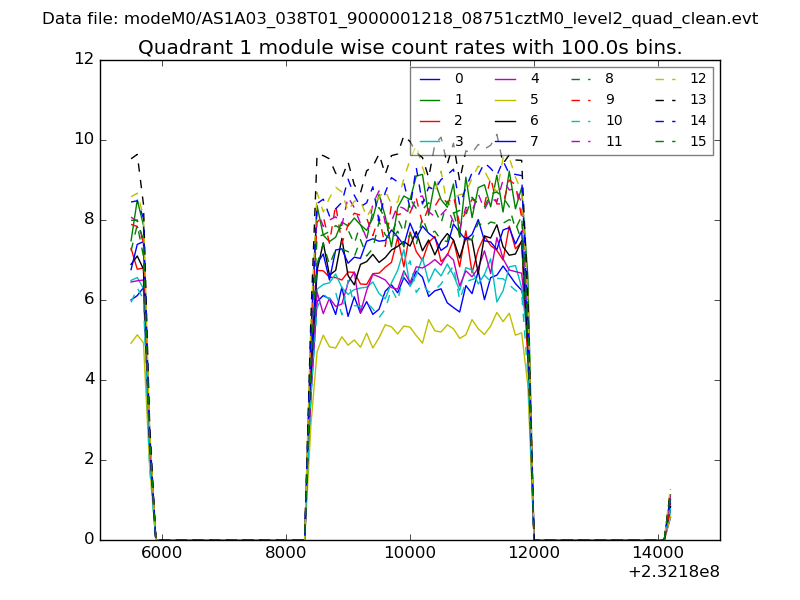
| Module-wise count rates for Quadrant A Data is divided into 100 sec bins |
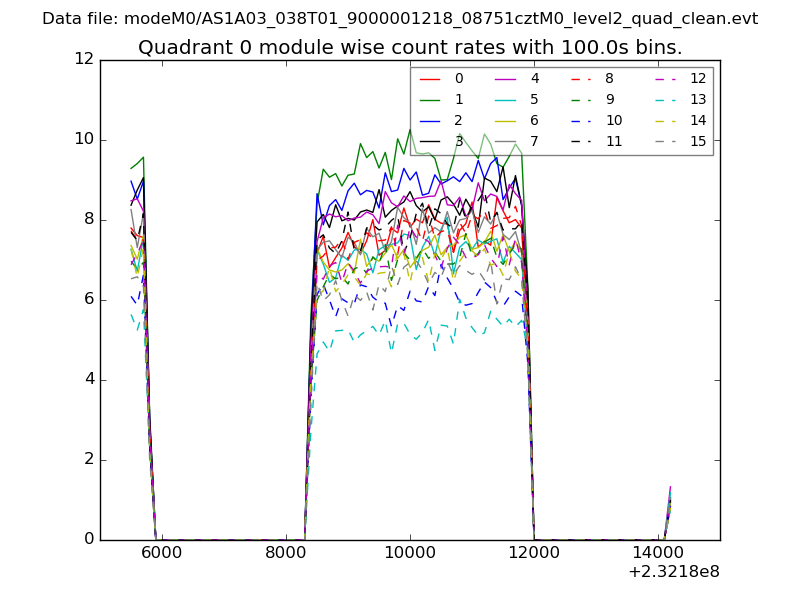 |
 |
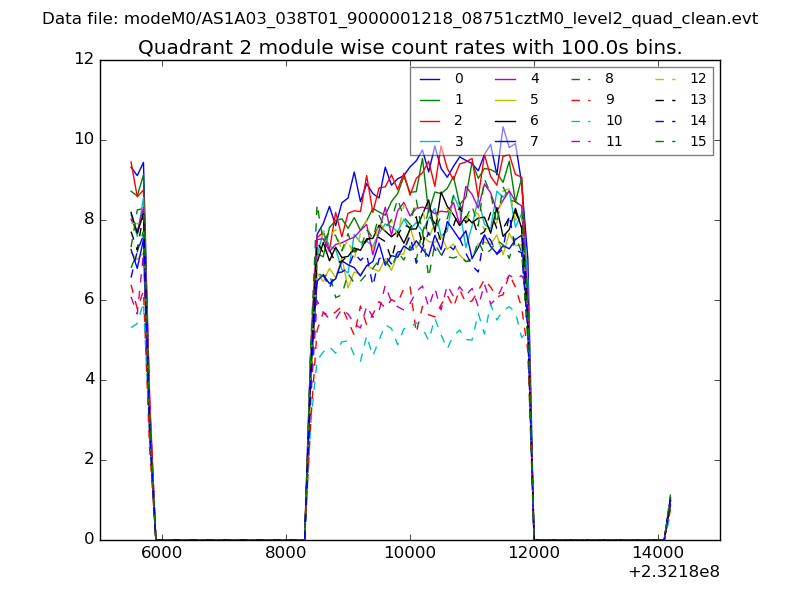
| Module-wise count rates for Quadrant B Data is divided into 100 sec bins |
 |
 |
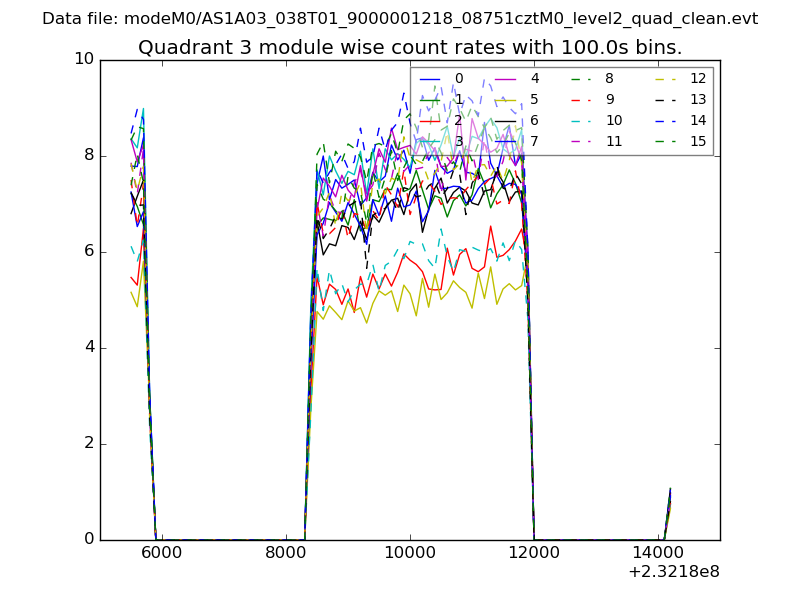
| Module-wise count rates for Quadrant C Data is divided into 100 sec bins |
 |
 |
| Module-wise count rates for Quadrant D Data is divided into 100 sec bins |
 |
 |
| Parameter | Plot |
|---|---|
| CZT HV Monitor | 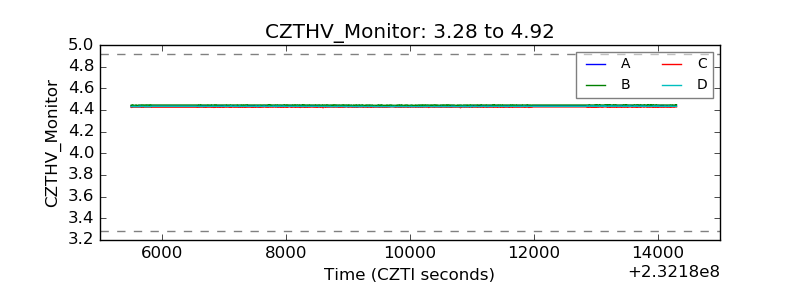 |
| D_VDD |  |
| Temperature 1 |  |
| Veto HV Monitor | 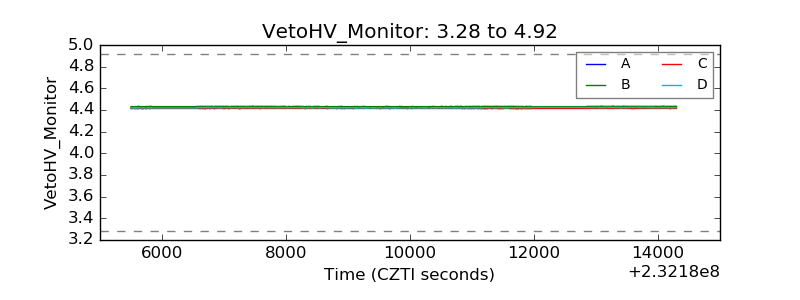 |
| Veto LLD |  |
| Alpha Counter | 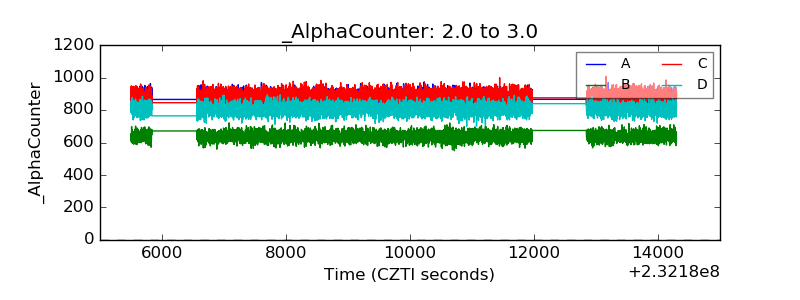 |
| _CPM_Rate | 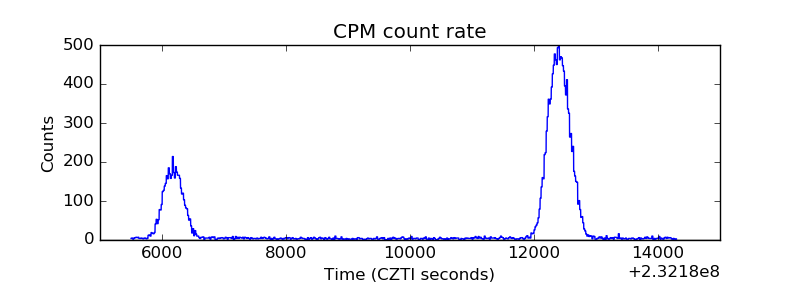 |
| CZT Counter | 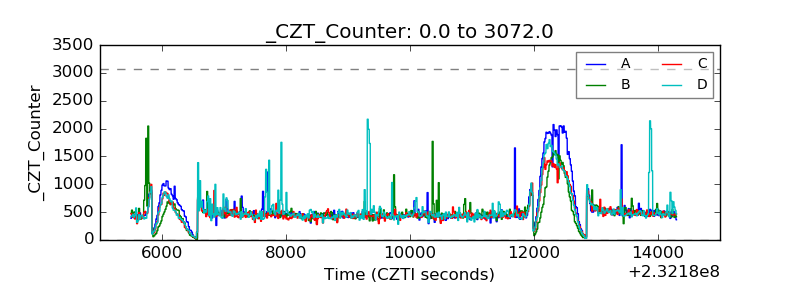 |
| +2.5 Volts monitor |  |
| +5 Volts monitor |  |
| _ROLL_ROT | 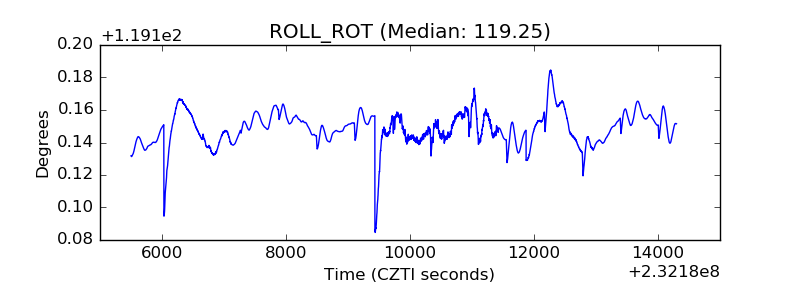 |
| _Roll_DEC | 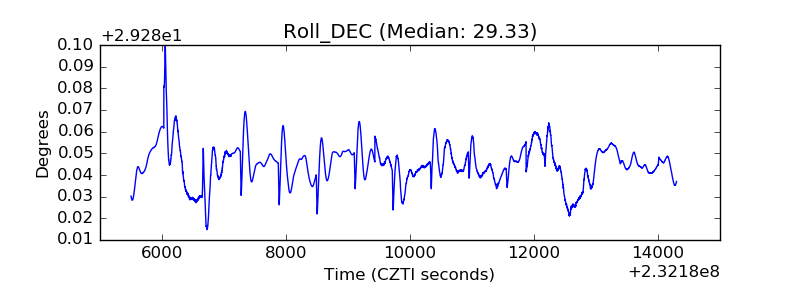 |
| _Roll_RA | 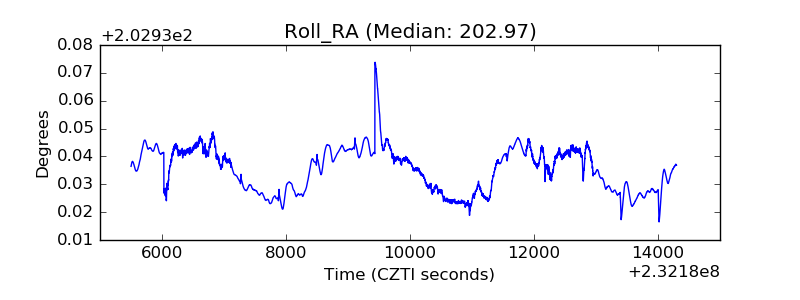 |
| Veto Counter | 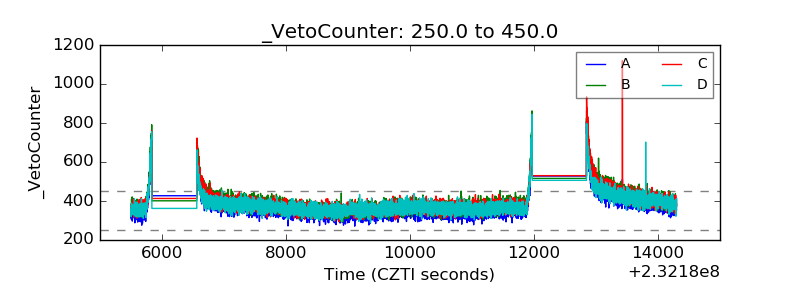 |