| Param | Original file | Final file |
|---|---|---|
| Filename | modeM0/AS1A03_038T01_9000001218_08754cztM0_level2.evt | modeM0/AS1A03_038T01_9000001218_08754cztM0_level2_quad_clean.evt |
| Size (bytes) | 479,954,880 | 92,396,160 |
| Size | 457.7 MB | 88.1 MB |
| Events in quadrant A | 3,444,425 | 587,858 |
| Events in quadrant B | 3,388,465 | 593,892 |
| Events in quadrant C | 3,329,770 | 583,095 |
| Events in quadrant D | 3,910,070 | 558,553 |
| Mode M9 | |||
|---|---|---|---|
| Quadrant | BADHDUFLAG | Total packets | Discarded packets |
| A | 0 | 22 | 0 |
| B | 0 | 22 | 0 |
| C | 0 | 22 | 0 |
| D | 0 | 22 | 0 |
| Mode M0 | |||
|---|---|---|---|
| Quadrant | BADHDUFLAG | Total packets | Discarded packets |
| A | 0 | 14744 | 3 |
| B | 0 | 14478 | 2 |
| C | 0 | 14342 | 2 |
| D | 0 | 16234 | 2 |
| Mode SS | |||
|---|---|---|---|
| Quadrant | BADHDUFLAG | Total packets | Discarded packets |
| A | 0 | 140 | 0 |
| B | 0 | 140 | 0 |
| C | 0 | 140 | 0 |
| D | 0 | 140 | 0 |
| Quadrant | Total seconds | Saturated seconds | Saturation percentage |
|---|---|---|---|
| A | 6812 | 143 | 2.099237% |
| B | 6812 | 122 | 1.790957% |
| C | 6812 | 106 | 1.556078% |
| D | 6812 | 199 | 2.921315% |
Noise dominated data is calculated using 1-second bins in cleaned event files. If a bin has >2000 counts, and if more than 50% of those come from <1% of pixels, then it is considered to be noise-dominated and hence unusable.
| Quadrant | # 1 sec bins | Bins with >0 counts | Bins with >2000 counts | High rate bins dominated by noise | Noise dominated (total time) | Noise dominated (detector-on time) | Marked lightcurve |
|---|---|---|---|---|---|---|---|
| A | 9007 | 6812 | 14 | 14 | 0.16% | 0.21% | 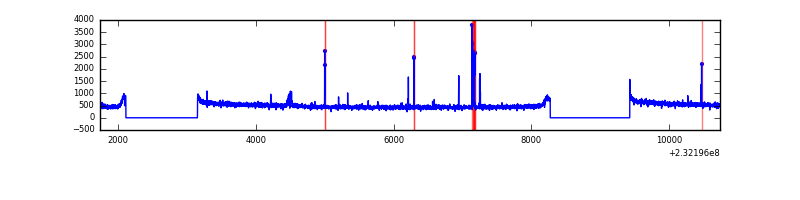 |
| B | 9007 | 6812 | 0 | 0 | 0.00% | 0.00% | 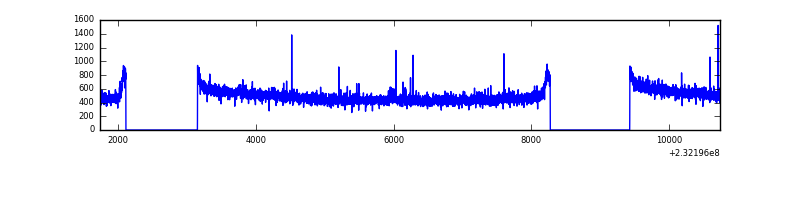 |
| C | 9007 | 6812 | 0 | 0 | 0.00% | 0.00% | 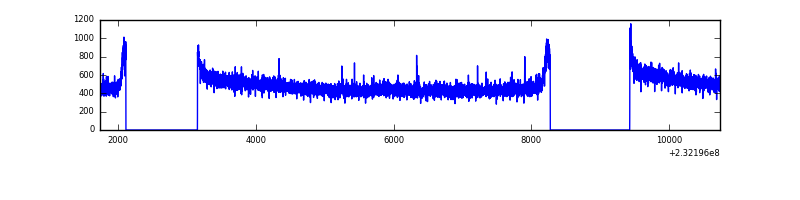 |
| D | 9007 | 6812 | 89 | 89 | 0.99% | 1.31% | 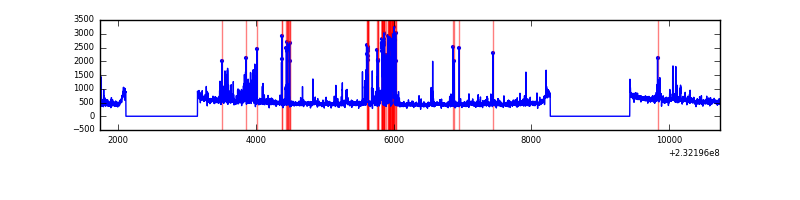 |
Top three noisy pixels from each quadrant. If the there are fewer than three noisy pixels in the level2.evt file, extra rows are filled as -1
| Pixel properties | Quadrant properties | ||||||
|---|---|---|---|---|---|---|---|
| Quadrant | DetID | PixID | Counts | Sigma | Mean | Median | Sigma |
| A | 5 | 16 | 65179 | 366.11 | 871 | 853 | 175.7 |
| A | 13 | 248 | 26093 | 143.65 | 871 | 853 | 175.7 |
| A | 0 | 226 | 8143 | 41.49 | 871 | 853 | 175.7 |
| B | 12 | 111 | 18288 | 105.02 | 868 | 846 | 166.1 |
| B | 11 | 111 | 14713 | 83.49 | 868 | 846 | 166.1 |
| B | 14 | 111 | 10912 | 60.61 | 868 | 846 | 166.1 |
| C | 14 | 64 | 24341 | 119.61 | 846 | 851 | 196.4 |
| C | 13 | 61 | 6358 | 28.04 | 846 | 851 | 196.4 |
| C | 8 | 222 | 3129 | 11.6 | 846 | 851 | 196.4 |
| D | 2 | 152 | 351904 | 1676.94 | 837 | 815 | 209.4 |
| D | 1 | 52 | 148992 | 707.75 | 837 | 815 | 209.4 |
| D | 13 | 122 | 114341 | 542.24 | 837 | 815 | 209.4 |
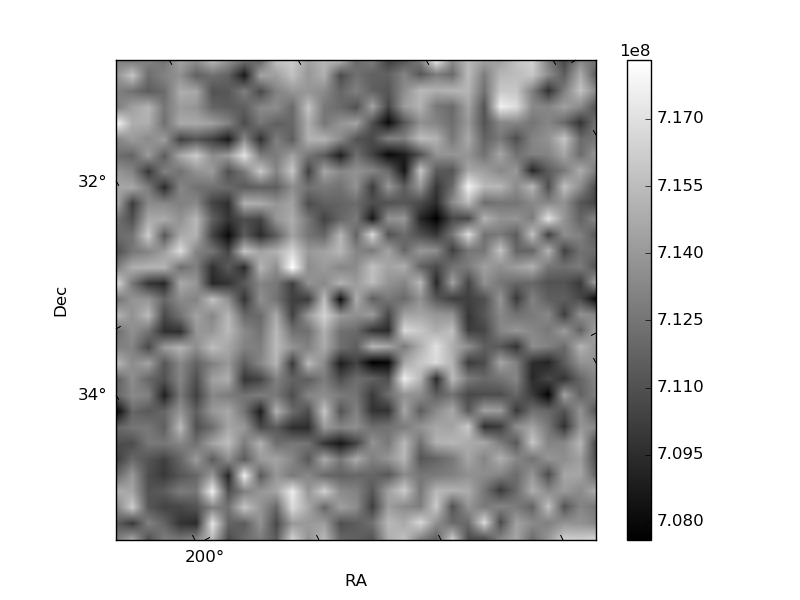
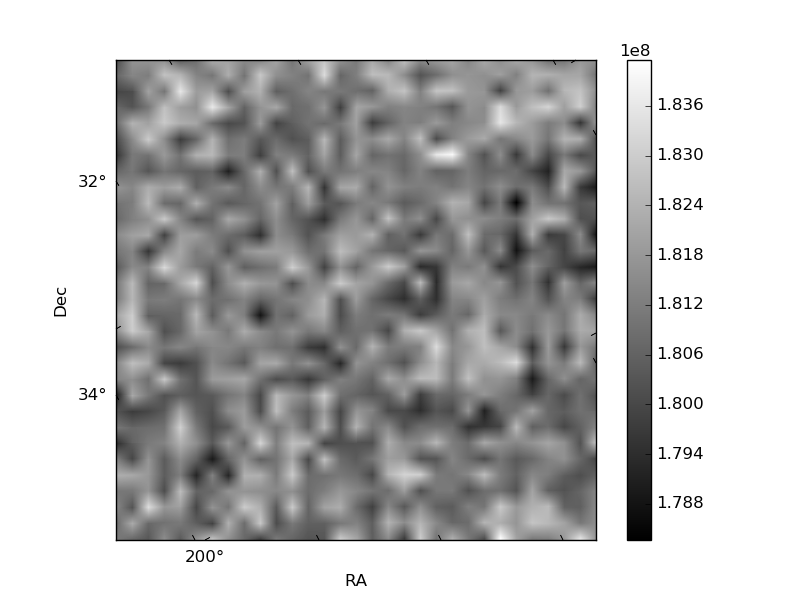
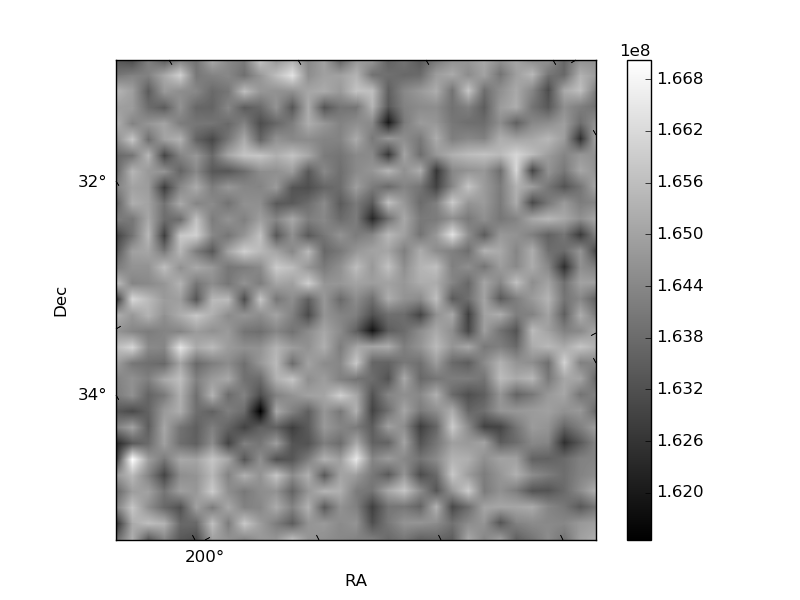
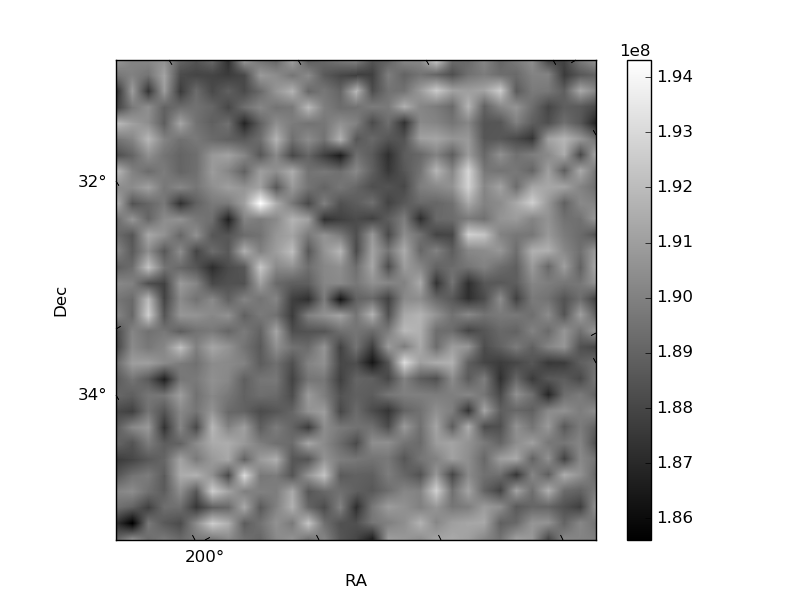
Histogram calculated using DETX and DETY for each event in the final _common_clean file
| Quadrant A | 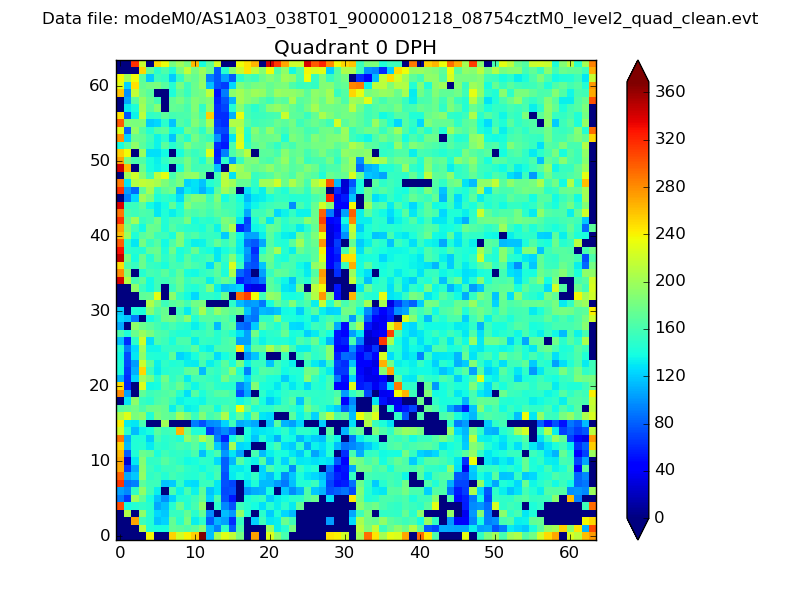 |
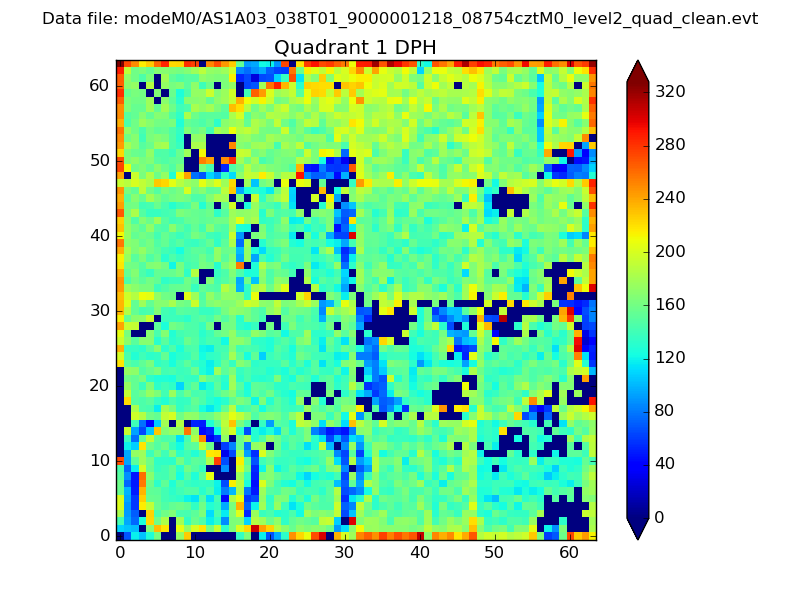 |
Quadrant B |
|---|---|---|---|
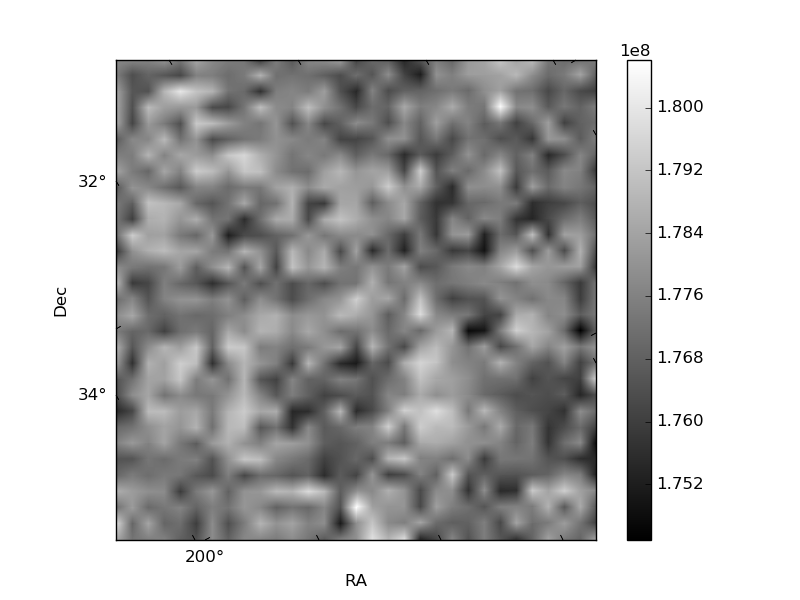
| Quadrant D | 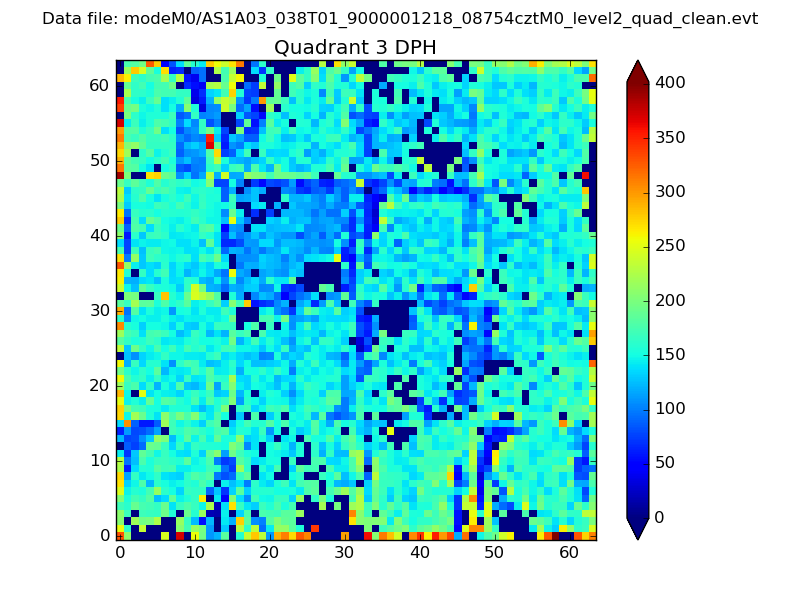 |
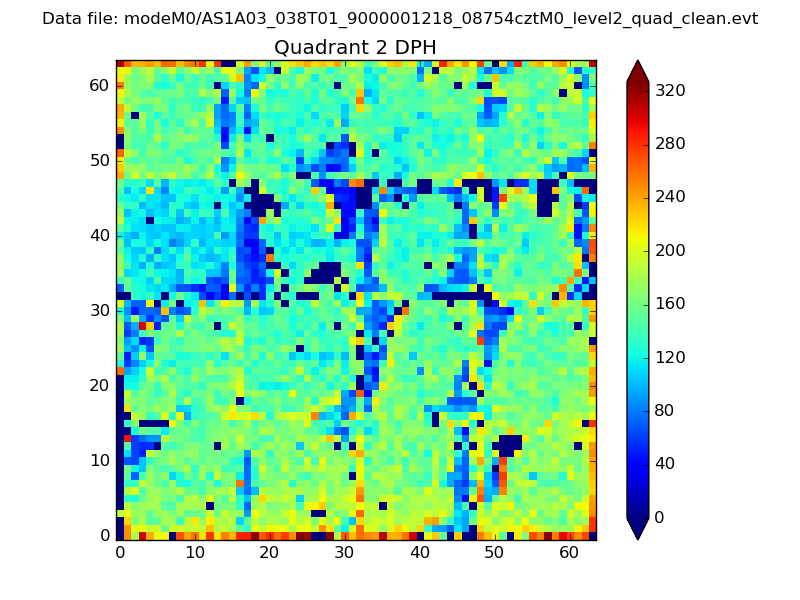 |
Quadrant C |
| Plot type | Count rate plots | Images |
|---|---|---|
| Comparison with Poisson distribution Blue bars denote a histogram of data divided into 1 sec bins. Red curve is a Poisson curve with rate = median count rate of data. |
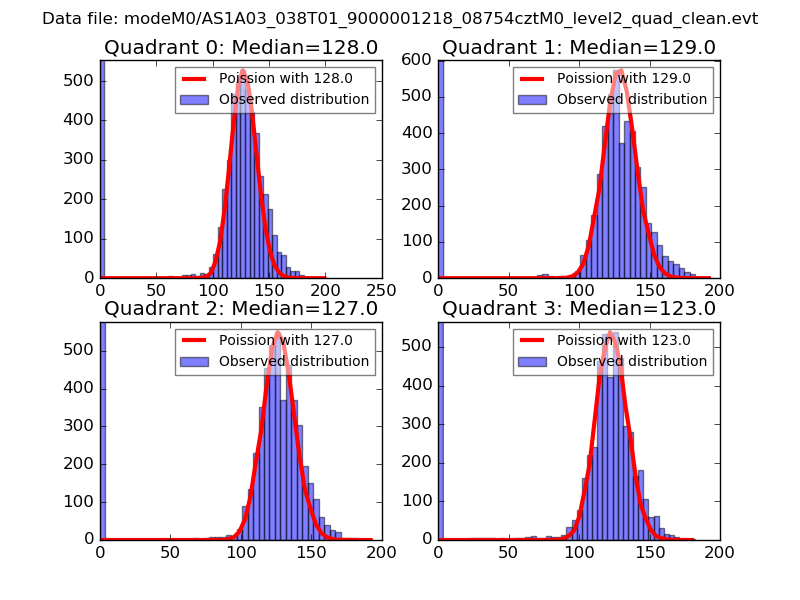 |
 |
| Quadrant-wise count rates Data is divided into 100 sec bins |
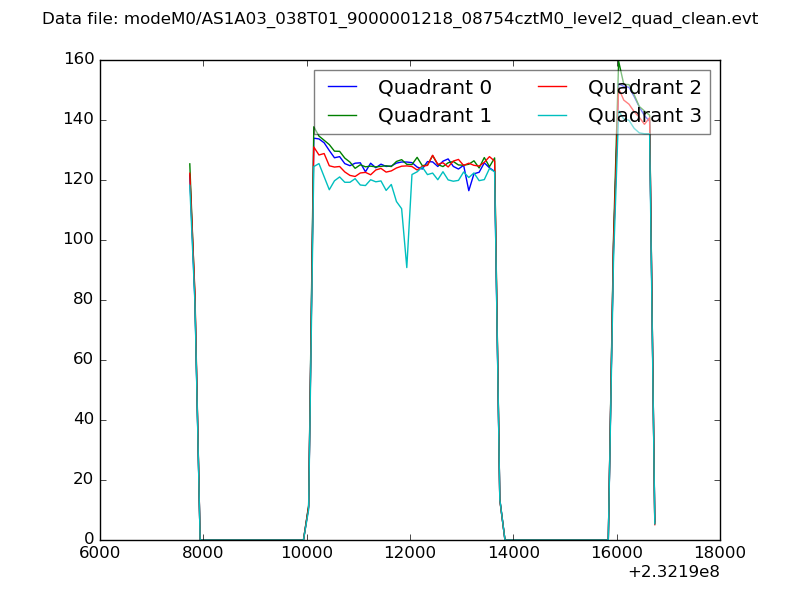 |
|
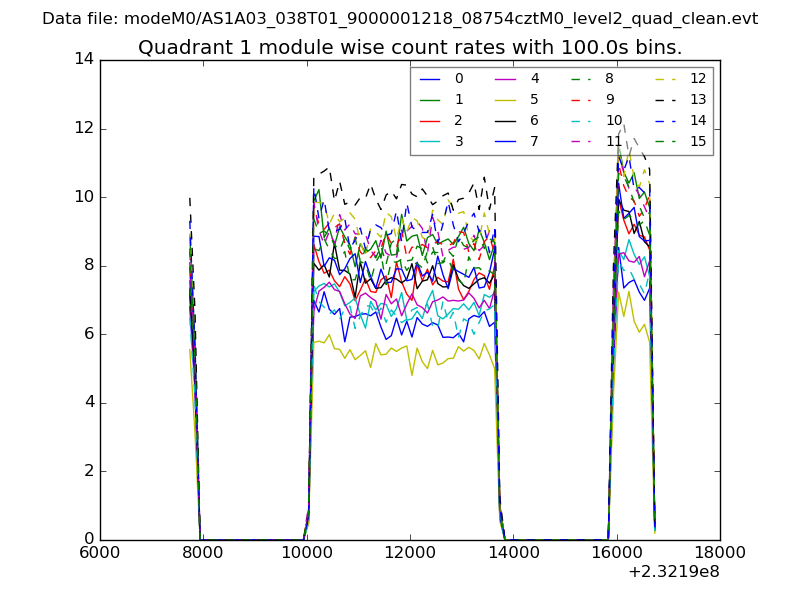
| Module-wise count rates for Quadrant A Data is divided into 100 sec bins |
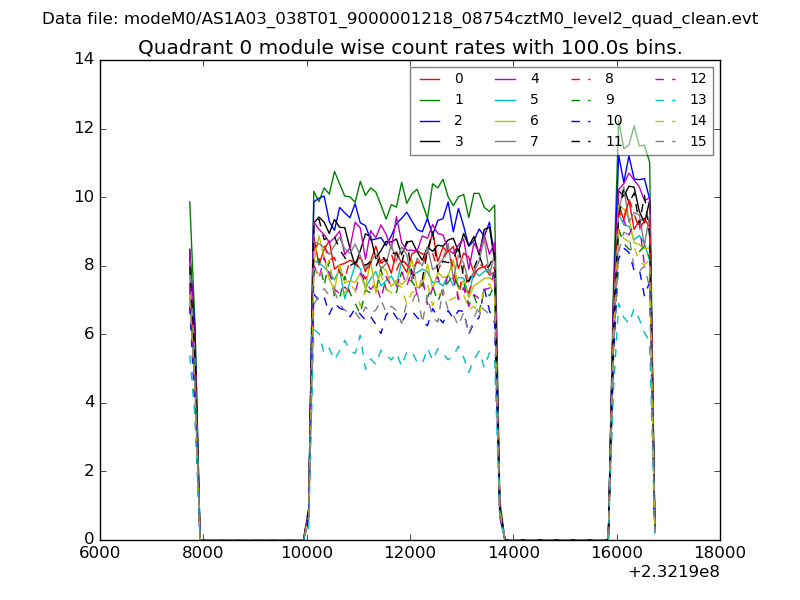 |
 |
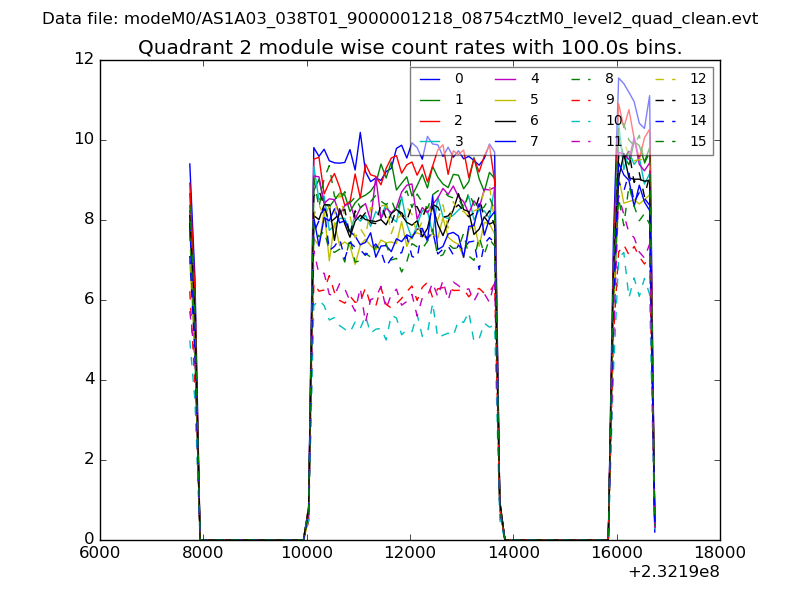
| Module-wise count rates for Quadrant B Data is divided into 100 sec bins |
 |
 |
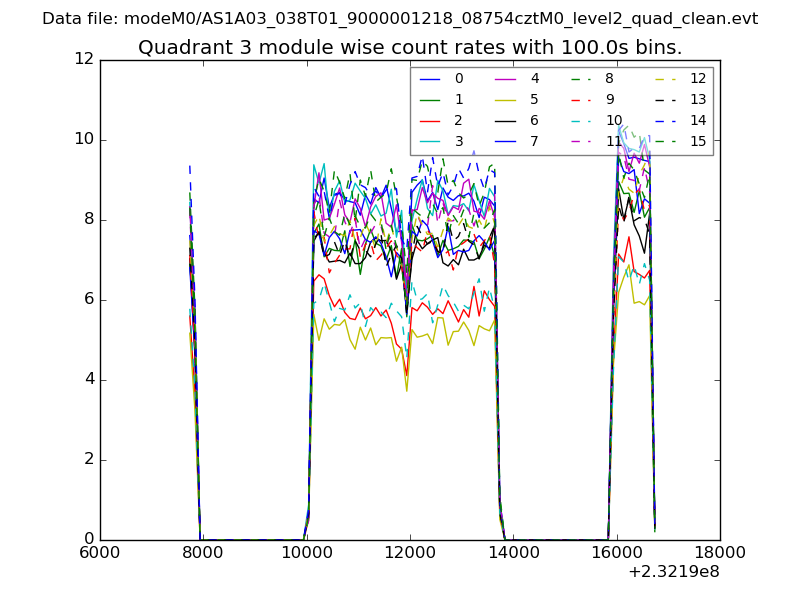
| Module-wise count rates for Quadrant C Data is divided into 100 sec bins |
 |
 |
| Module-wise count rates for Quadrant D Data is divided into 100 sec bins |
 |
 |
| Parameter | Plot |
|---|---|
| CZT HV Monitor | 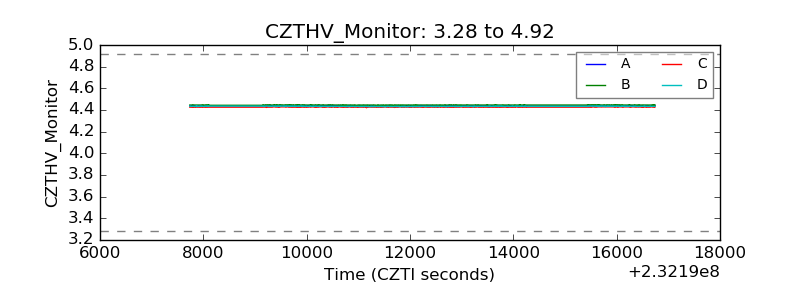 |
| D_VDD | 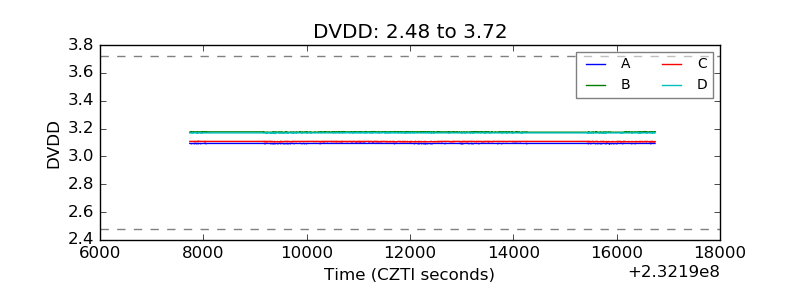 |
| Temperature 1 | 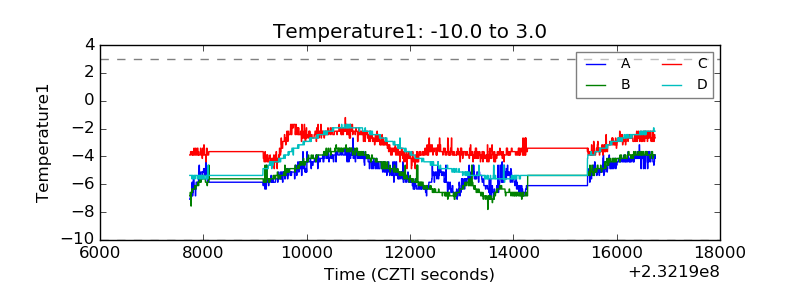 |
| Veto HV Monitor | 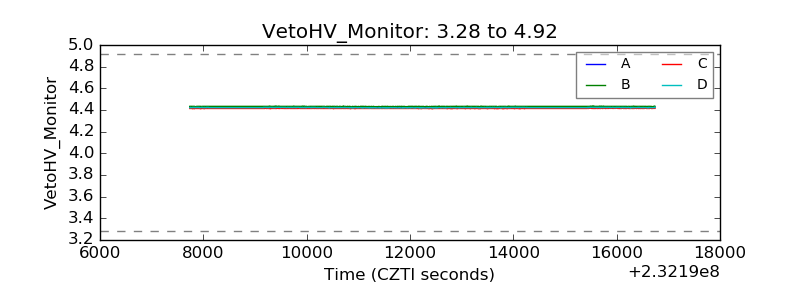 |
| Veto LLD | 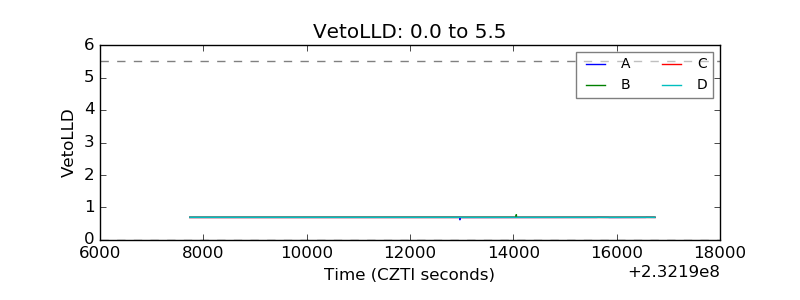 |
| Alpha Counter | 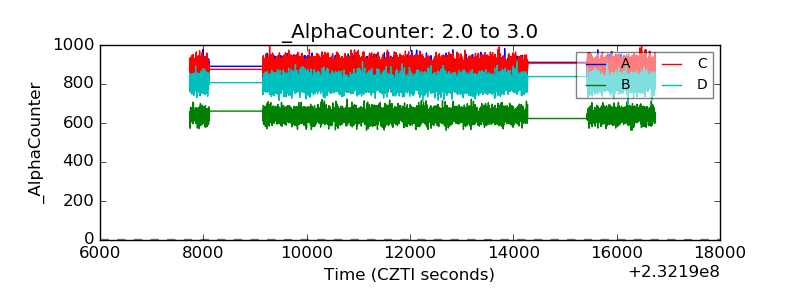 |
| _CPM_Rate | 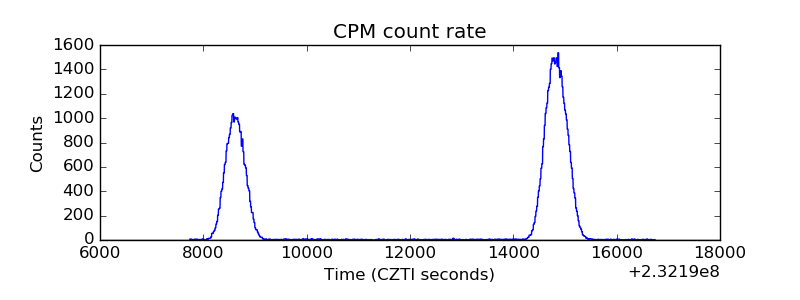 |
| CZT Counter | 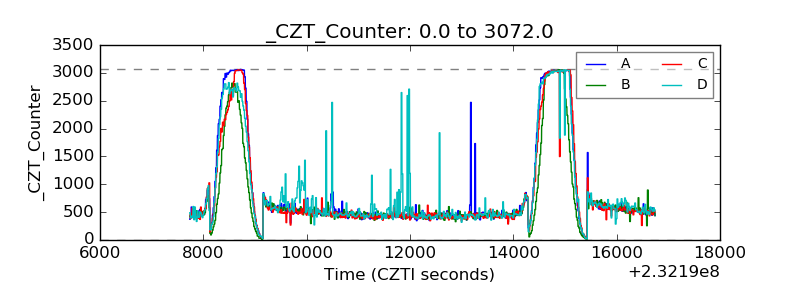 |
| +2.5 Volts monitor |  |
| +5 Volts monitor |  |
| _ROLL_ROT | 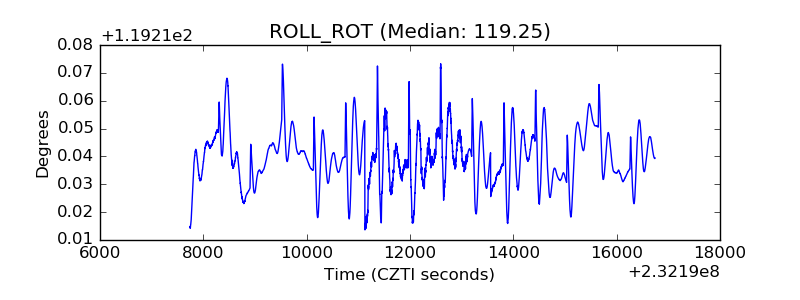 |
| _Roll_DEC | 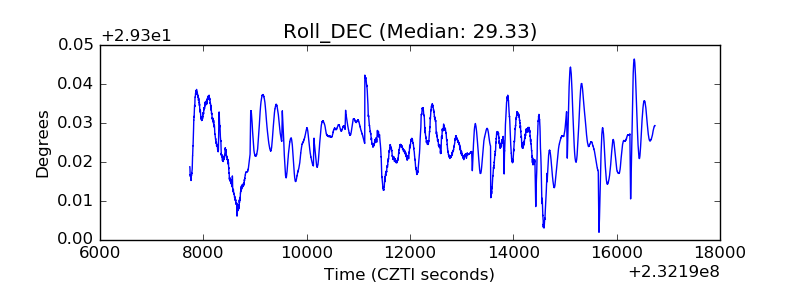 |
| _Roll_RA | 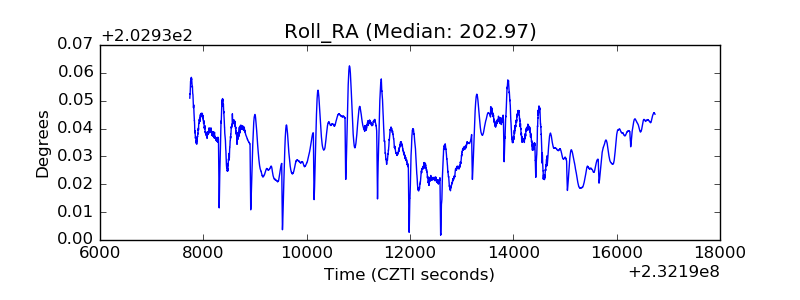 |
| Veto Counter | 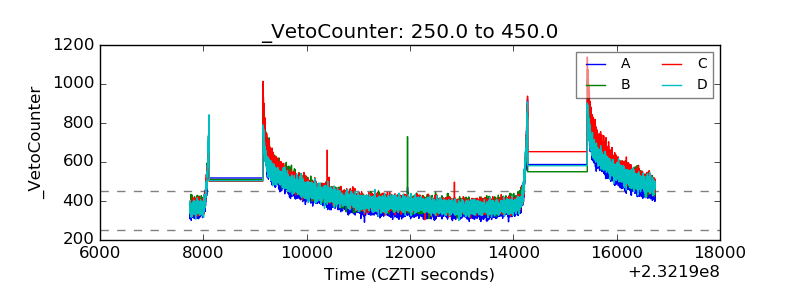 |