| Param | Original file | Final file |
|---|---|---|
| Filename | modeM0/AS1A03_038T01_9000001218_08755cztM0_level2.evt | modeM0/AS1A03_038T01_9000001218_08755cztM0_level2_quad_clean.evt |
| Size (bytes) | 400,409,280 | 101,531,520 |
| Size | 381.9 MB | 96.8 MB |
| Events in quadrant A | 2,919,502 | 673,266 |
| Events in quadrant B | 2,887,120 | 679,630 |
| Events in quadrant C | 2,843,501 | 671,247 |
| Events in quadrant D | 3,083,213 | 646,902 |
| Mode M9 | |||
|---|---|---|---|
| Quadrant | BADHDUFLAG | Total packets | Discarded packets |
| A | 0 | 12 | 0 |
| B | 0 | 12 | 0 |
| C | 0 | 12 | 0 |
| D | 0 | 12 | 0 |
| Mode M0 | |||
|---|---|---|---|
| Quadrant | BADHDUFLAG | Total packets | Discarded packets |
| A | 0 | 12426 | 2 |
| B | 0 | 12309 | 1 |
| C | 0 | 12121 | 1 |
| D | 0 | 13036 | 1 |
| Mode SS | |||
|---|---|---|---|
| Quadrant | BADHDUFLAG | Total packets | Discarded packets |
| A | 0 | 120 | 0 |
| B | 0 | 120 | 0 |
| C | 0 | 120 | 0 |
| D | 0 | 120 | 0 |
| Quadrant | Total seconds | Saturated seconds | Saturation percentage |
|---|---|---|---|
| A | 5770 | 91 | 1.577123% |
| B | 5770 | 73 | 1.265165% |
| C | 5770 | 60 | 1.039861% |
| D | 5770 | 81 | 1.403813% |
Noise dominated data is calculated using 1-second bins in cleaned event files. If a bin has >2000 counts, and if more than 50% of those come from <1% of pixels, then it is considered to be noise-dominated and hence unusable.
| Quadrant | # 1 sec bins | Bins with >0 counts | Bins with >2000 counts | High rate bins dominated by noise | Noise dominated (total time) | Noise dominated (detector-on time) | Marked lightcurve |
|---|---|---|---|---|---|---|---|
| A | 7025 | 5770 | 8 | 8 | 0.11% | 0.14% | 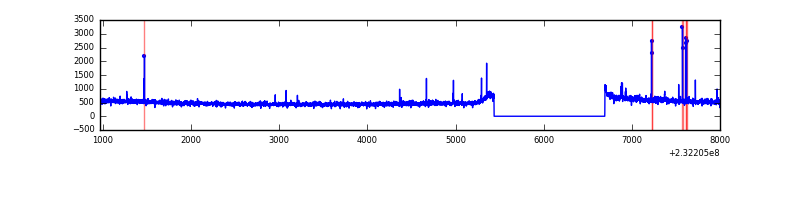 |
| B | 7025 | 5770 | 1 | 1 | 0.01% | 0.02% | 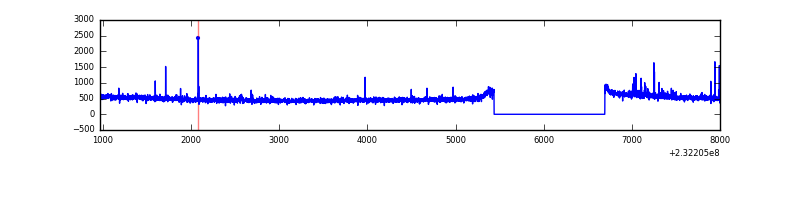 |
| C | 7025 | 5770 | 0 | 0 | 0.00% | 0.00% | 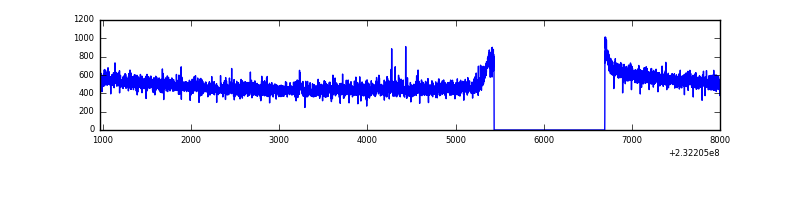 |
| D | 7025 | 5770 | 15 | 15 | 0.21% | 0.26% |  |
Top three noisy pixels from each quadrant. If the there are fewer than three noisy pixels in the level2.evt file, extra rows are filled as -1
| Pixel properties | Quadrant properties | ||||||
|---|---|---|---|---|---|---|---|
| Quadrant | DetID | PixID | Counts | Sigma | Mean | Median | Sigma |
| A | 5 | 16 | 45294 | 301.64 | 734 | 718 | 147.8 |
| A | 3 | 1 | 25409 | 167.08 | 734 | 718 | 147.8 |
| A | 13 | 251 | 17838 | 115.85 | 734 | 718 | 147.8 |
| B | 4 | 80 | 15513 | 107.16 | 732 | 717 | 138.1 |
| B | 12 | 111 | 14605 | 100.58 | 732 | 717 | 138.1 |
| B | 11 | 111 | 11921 | 81.15 | 732 | 717 | 138.1 |
| C | 14 | 64 | 28522 | 166.2 | 721 | 727 | 167.2 |
| C | 13 | 61 | 5361 | 27.71 | 721 | 727 | 167.2 |
| C | 12 | 4 | 2435 | 10.21 | 721 | 727 | 167.2 |
| D | 2 | 152 | 137327 | 762.39 | 717 | 699 | 179.2 |
| D | 1 | 52 | 101228 | 560.96 | 717 | 699 | 179.2 |
| D | 2 | 136 | 39913 | 218.82 | 717 | 699 | 179.2 |
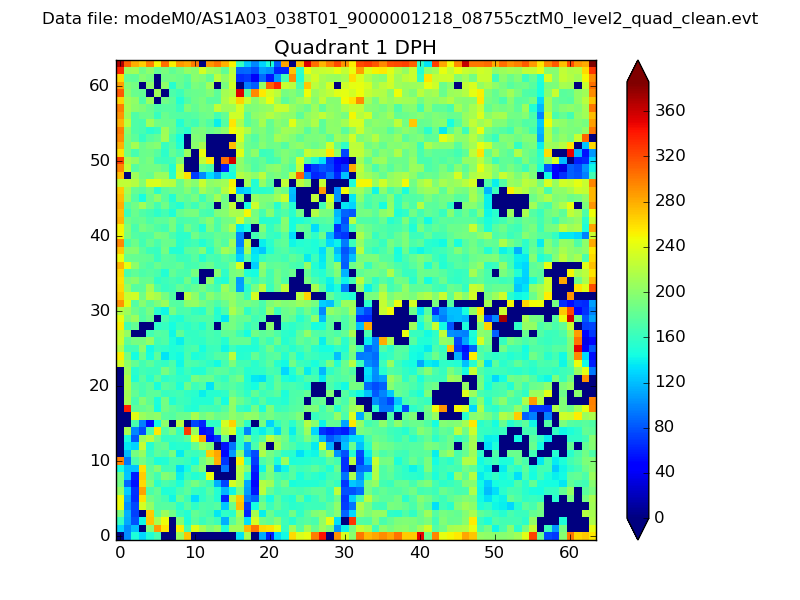
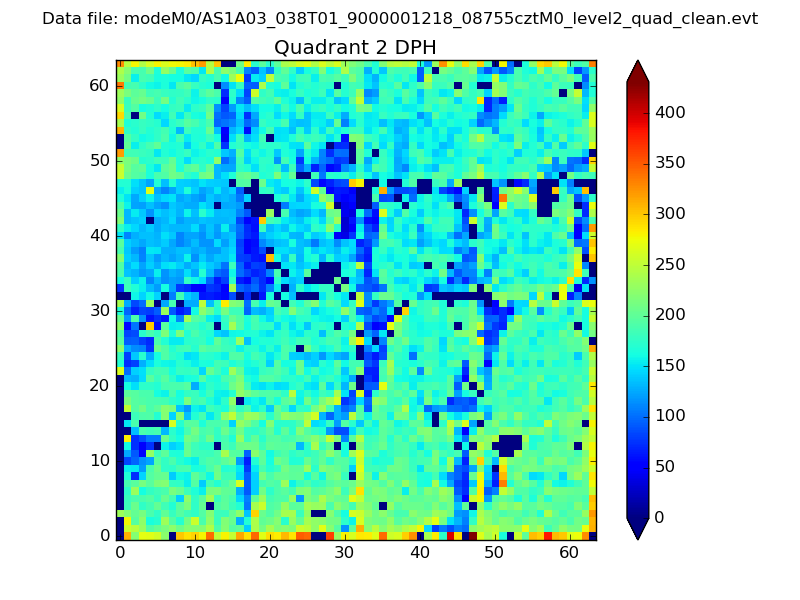
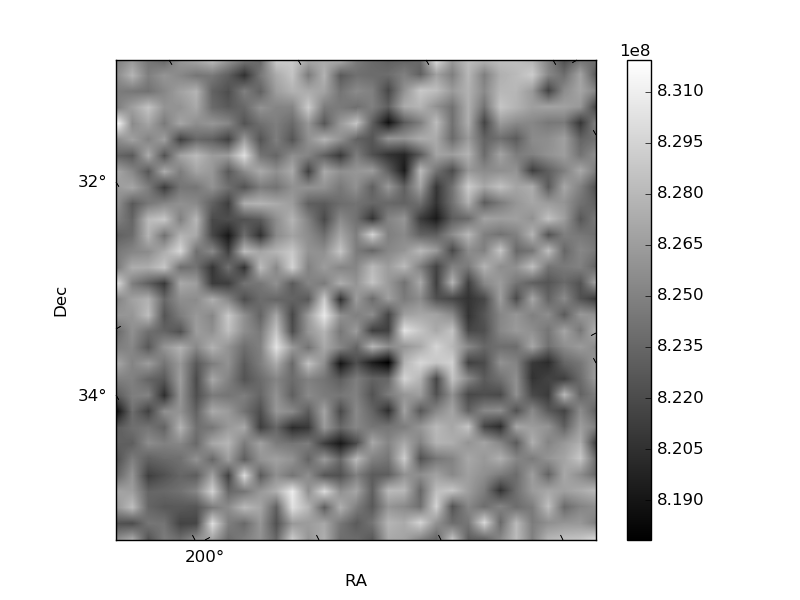
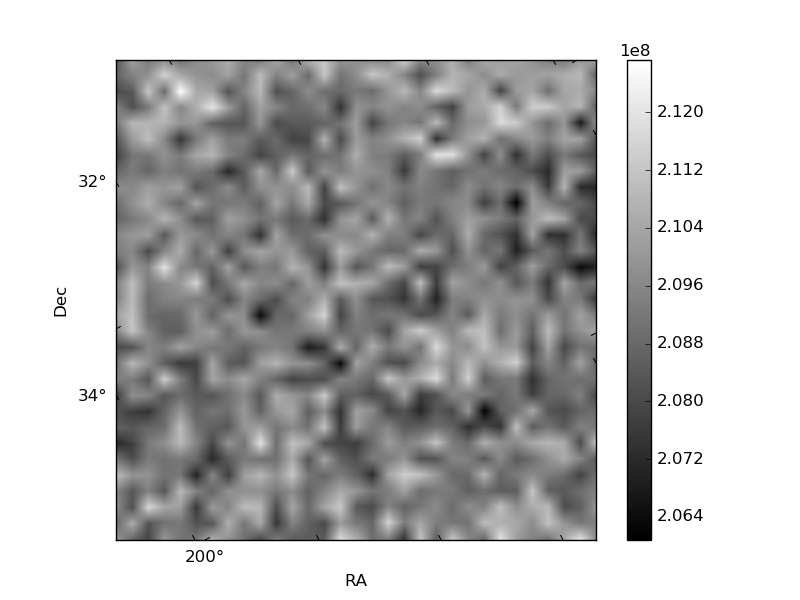
Histogram calculated using DETX and DETY for each event in the final _common_clean file
| Quadrant A | 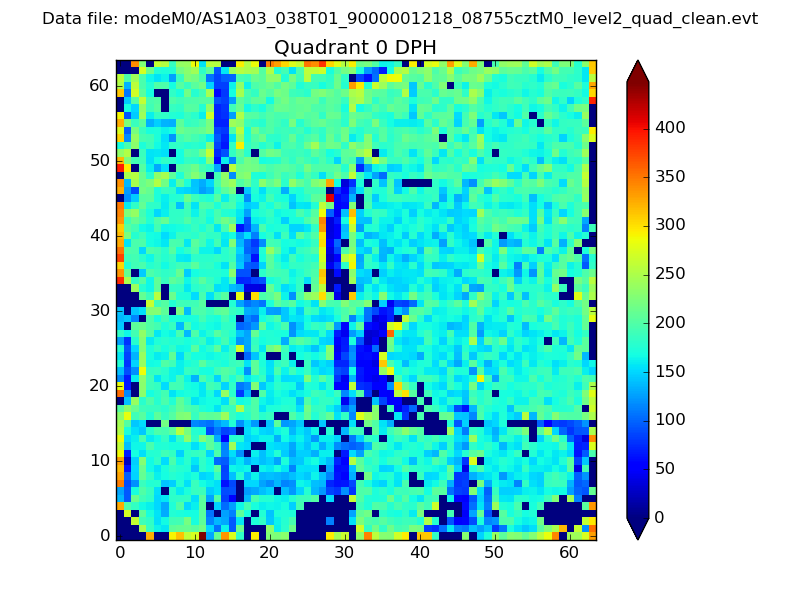 |
 |
Quadrant B |
|---|---|---|---|
| Quadrant D | 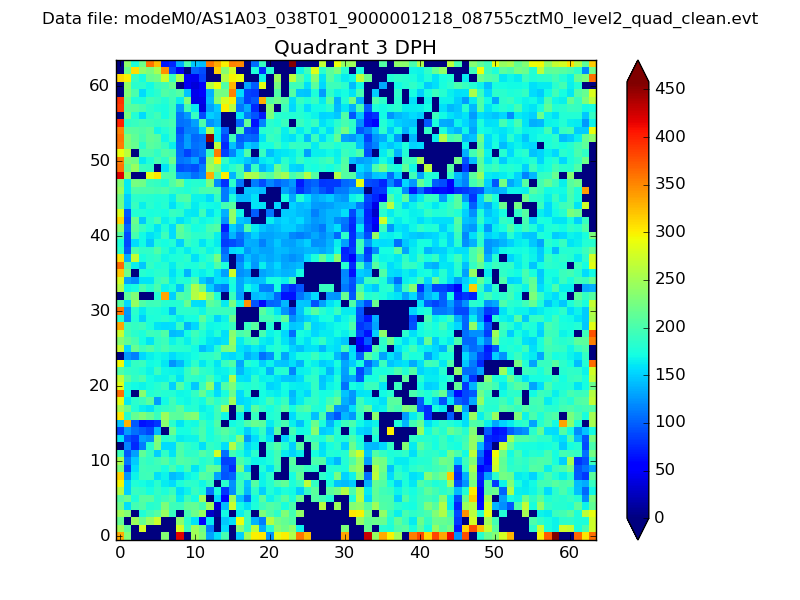 |
 |
Quadrant C |
| Plot type | Count rate plots | Images |
|---|---|---|
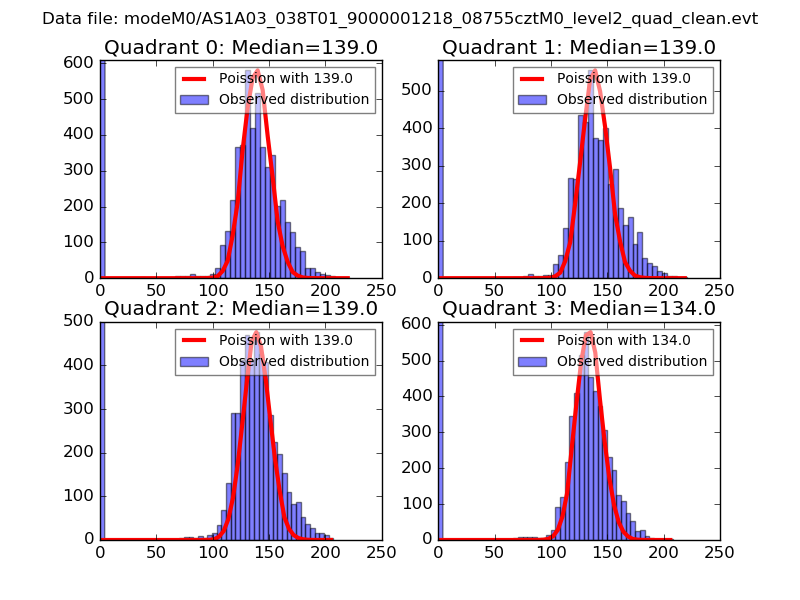
| Comparison with Poisson distribution Blue bars denote a histogram of data divided into 1 sec bins. Red curve is a Poisson curve with rate = median count rate of data. |
 |
 |
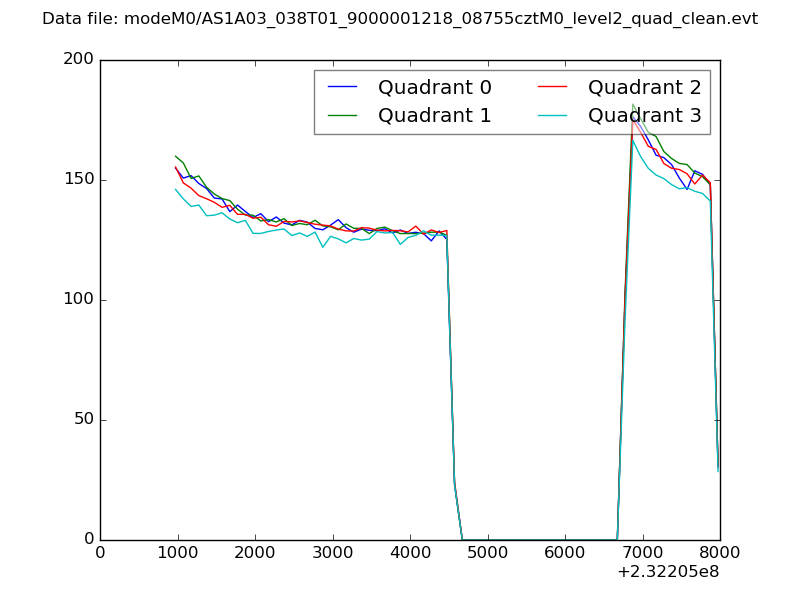
| Quadrant-wise count rates Data is divided into 100 sec bins |
 |
|
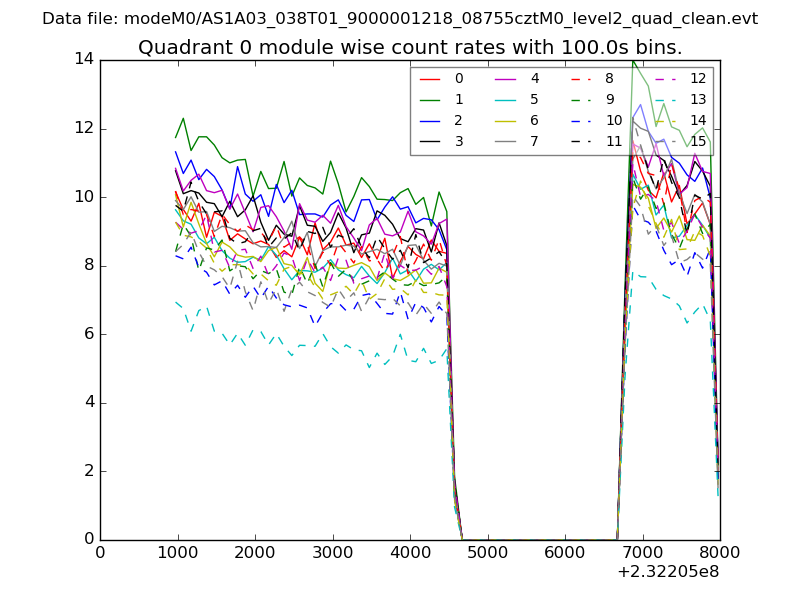
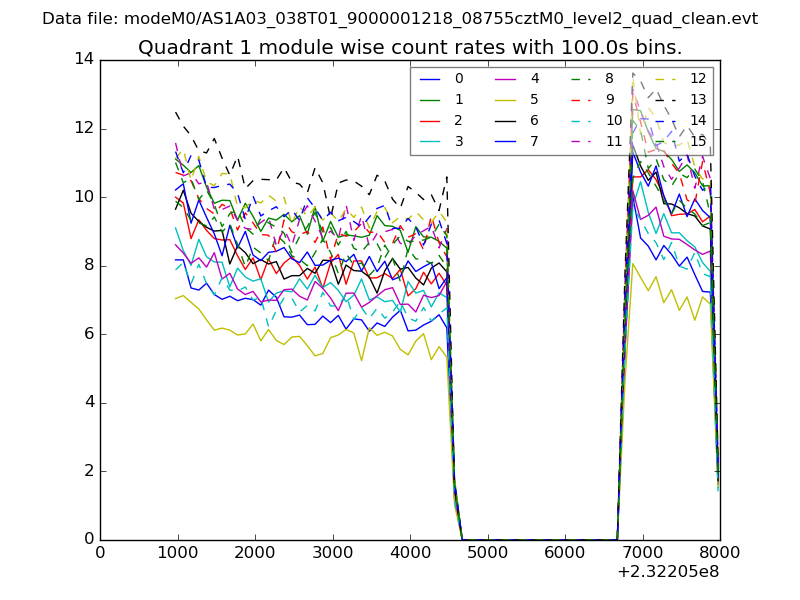
| Module-wise count rates for Quadrant A Data is divided into 100 sec bins |
 |
 |
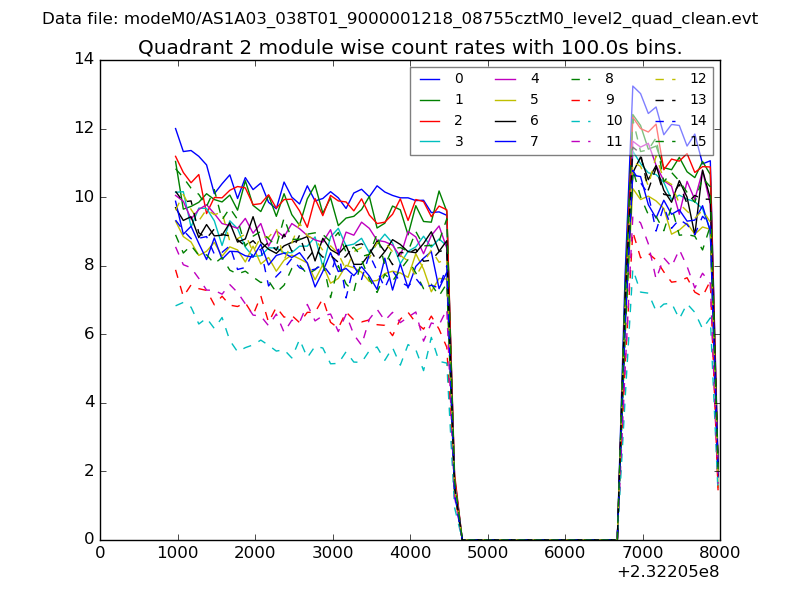
| Module-wise count rates for Quadrant B Data is divided into 100 sec bins |
 |
 |
| Module-wise count rates for Quadrant C Data is divided into 100 sec bins |
 |
 |
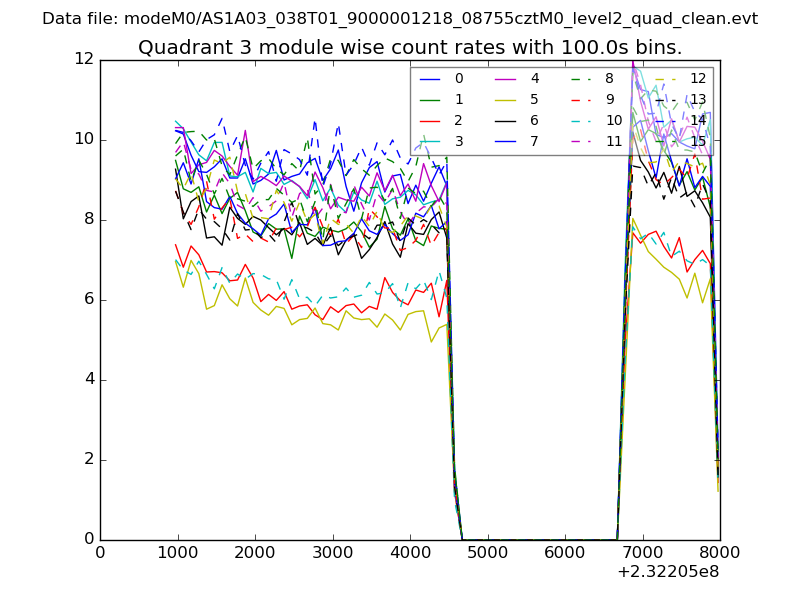
| Module-wise count rates for Quadrant D Data is divided into 100 sec bins |
 |
 |
| Parameter | Plot |
|---|---|
| CZT HV Monitor | 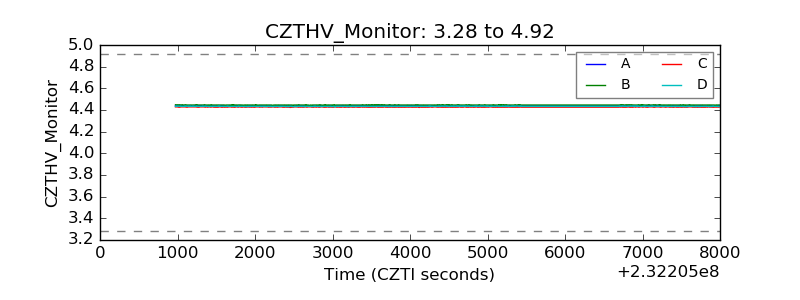 |
| D_VDD | 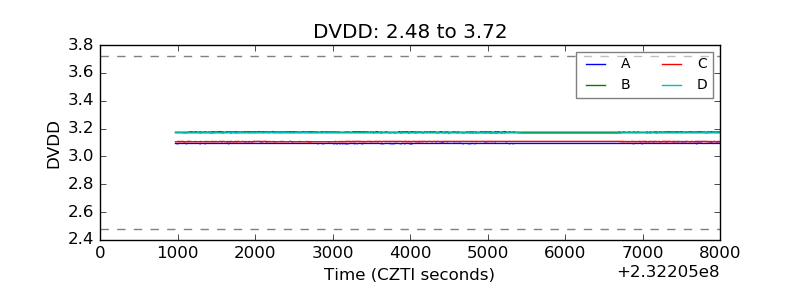 |
| Temperature 1 |  |
| Veto HV Monitor | 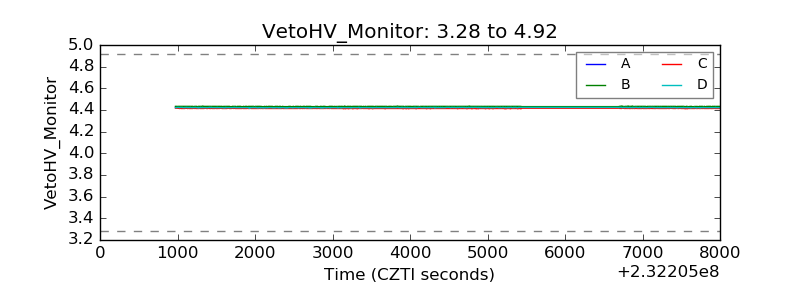 |
| Veto LLD |  |
| Alpha Counter | 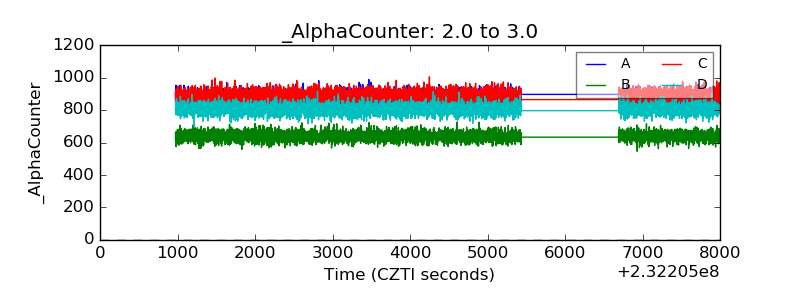 |
| _CPM_Rate | 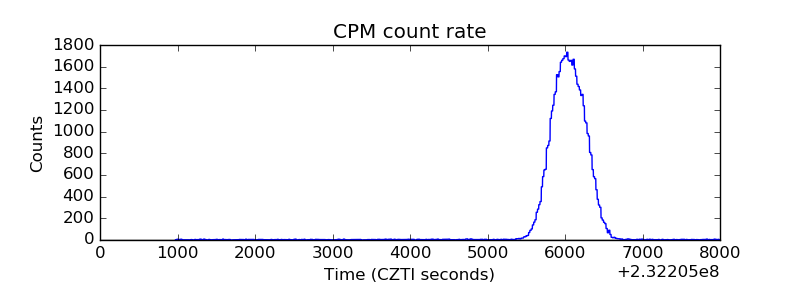 |
| CZT Counter | 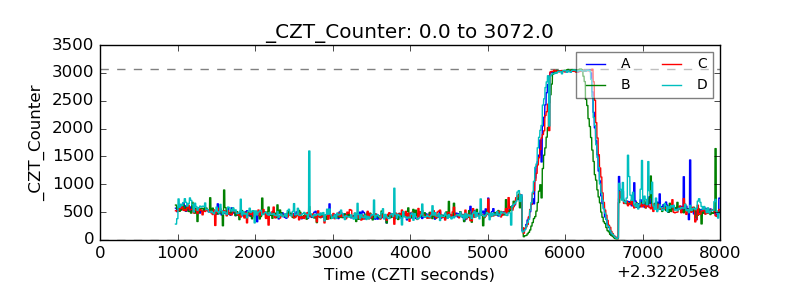 |
| +2.5 Volts monitor |  |
| +5 Volts monitor |  |
| _ROLL_ROT | 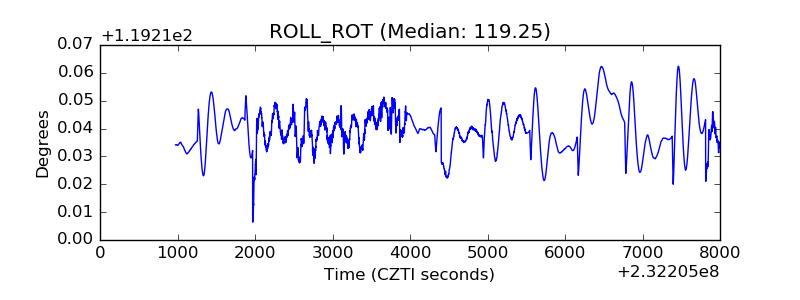 |
| _Roll_DEC | 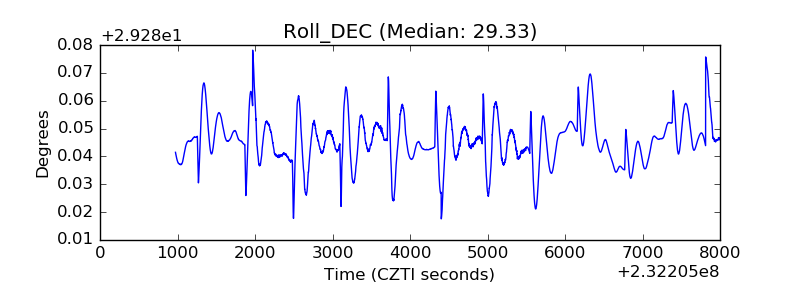 |
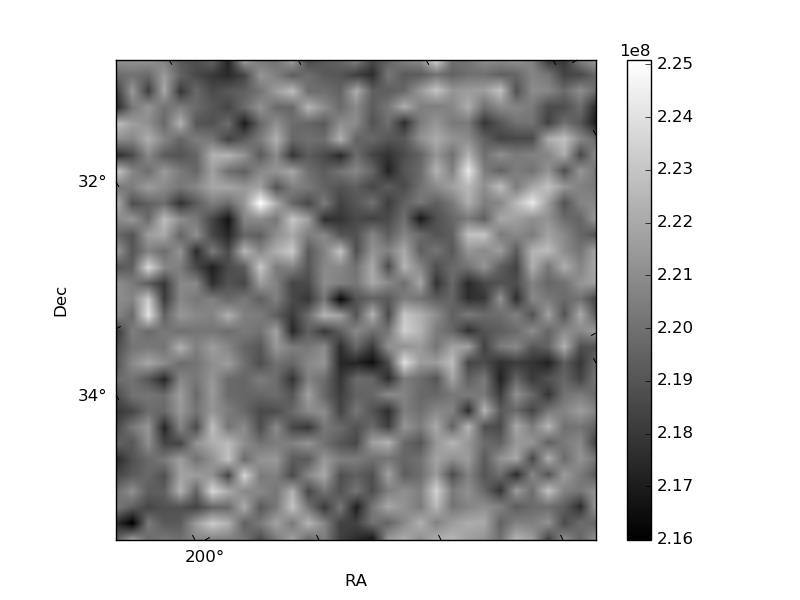
| _Roll_RA | 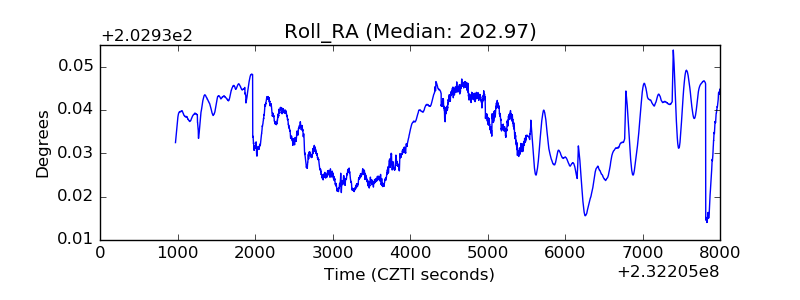 |
| Veto Counter | 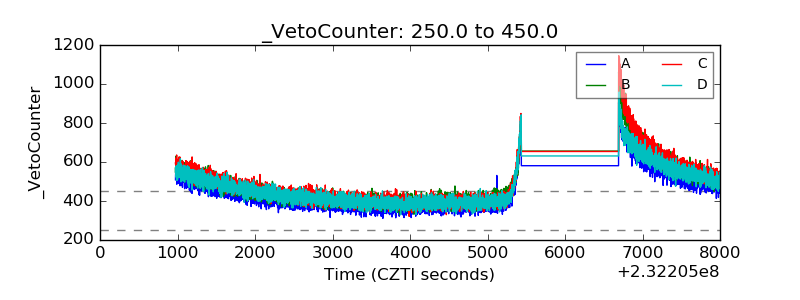 |