| Param | Original file | Final file |
|---|---|---|
| Filename | modeM0/AS1A03_038T01_9000001218_08757cztM0_level2.evt | modeM0/AS1A03_038T01_9000001218_08757cztM0_level2_quad_clean.evt |
| Size (bytes) | 443,808,000 | 100,546,560 |
| Size | 423.2 MB | 95.9 MB |
| Events in quadrant A | 3,250,281 | 654,865 |
| Events in quadrant B | 3,112,945 | 666,060 |
| Events in quadrant C | 3,040,962 | 661,945 |
| Events in quadrant D | 3,615,431 | 629,731 |
| Mode M9 | |||
|---|---|---|---|
| Quadrant | BADHDUFLAG | Total packets | Discarded packets |
| A | 0 | 13 | 0 |
| B | 0 | 13 | 0 |
| C | 0 | 13 | 0 |
| D | 0 | 13 | 0 |
| Mode M0 | |||
|---|---|---|---|
| Quadrant | BADHDUFLAG | Total packets | Discarded packets |
| A | 0 | 13573 | 2 |
| B | 0 | 13182 | 1 |
| C | 0 | 12994 | 1 |
| D | 0 | 14804 | 1 |
| Mode SS | |||
|---|---|---|---|
| Quadrant | BADHDUFLAG | Total packets | Discarded packets |
| A | 0 | 126 | 0 |
| B | 0 | 126 | 0 |
| C | 0 | 126 | 0 |
| D | 0 | 126 | 0 |
| Quadrant | Total seconds | Saturated seconds | Saturation percentage |
|---|---|---|---|
| A | 6198 | 108 | 1.742498% |
| B | 6198 | 98 | 1.581155% |
| C | 6198 | 76 | 1.226202% |
| D | 6198 | 171 | 2.758955% |
Noise dominated data is calculated using 1-second bins in cleaned event files. If a bin has >2000 counts, and if more than 50% of those come from <1% of pixels, then it is considered to be noise-dominated and hence unusable.
| Quadrant | # 1 sec bins | Bins with >0 counts | Bins with >2000 counts | High rate bins dominated by noise | Noise dominated (total time) | Noise dominated (detector-on time) | Marked lightcurve |
|---|---|---|---|---|---|---|---|
| A | 7488 | 6198 | 11 | 11 | 0.15% | 0.18% | 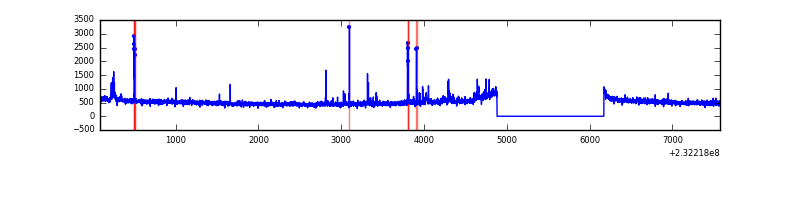 |
| B | 7488 | 6198 | 4 | 4 | 0.05% | 0.06% |  |
| C | 7488 | 6198 | 0 | 0 | 0.00% | 0.00% | 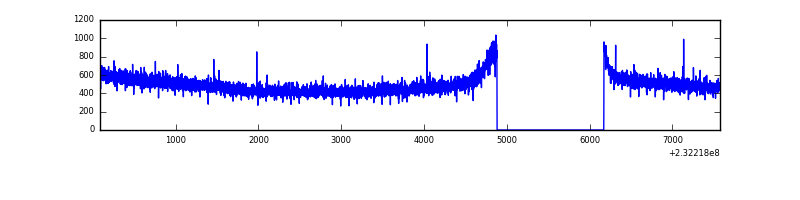 |
| D | 7488 | 6198 | 80 | 80 | 1.07% | 1.29% | 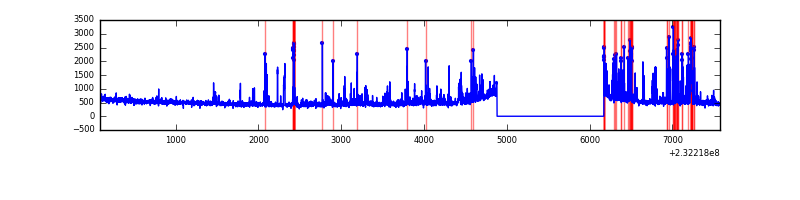 |
Top three noisy pixels from each quadrant. If the there are fewer than three noisy pixels in the level2.evt file, extra rows are filled as -1
| Pixel properties | Quadrant properties | ||||||
|---|---|---|---|---|---|---|---|
| Quadrant | DetID | PixID | Counts | Sigma | Mean | Median | Sigma |
| A | 13 | 251 | 84402 | 527.98 | 786 | 772 | 158.4 |
| A | 3 | 1 | 56275 | 350.41 | 786 | 772 | 158.4 |
| A | 5 | 16 | 51468 | 320.06 | 786 | 772 | 158.4 |
| B | 10 | 16 | 27806 | 181.83 | 786 | 768 | 148.7 |
| B | 0 | 198 | 19619 | 126.78 | 786 | 768 | 148.7 |
| B | 4 | 173 | 15824 | 101.25 | 786 | 768 | 148.7 |
| C | 13 | 61 | 5777 | 27.84 | 778 | 783 | 179.4 |
| C | 12 | 4 | 3833 | 17.0 | 778 | 783 | 179.4 |
| C | 8 | 222 | 2673 | 10.53 | 778 | 783 | 179.4 |
| D | 1 | 52 | 529175 | 2696.33 | 766 | 751 | 196.0 |
| D | 2 | 152 | 151347 | 768.43 | 766 | 751 | 196.0 |
| D | 2 | 234 | 19637 | 96.37 | 766 | 751 | 196.0 |
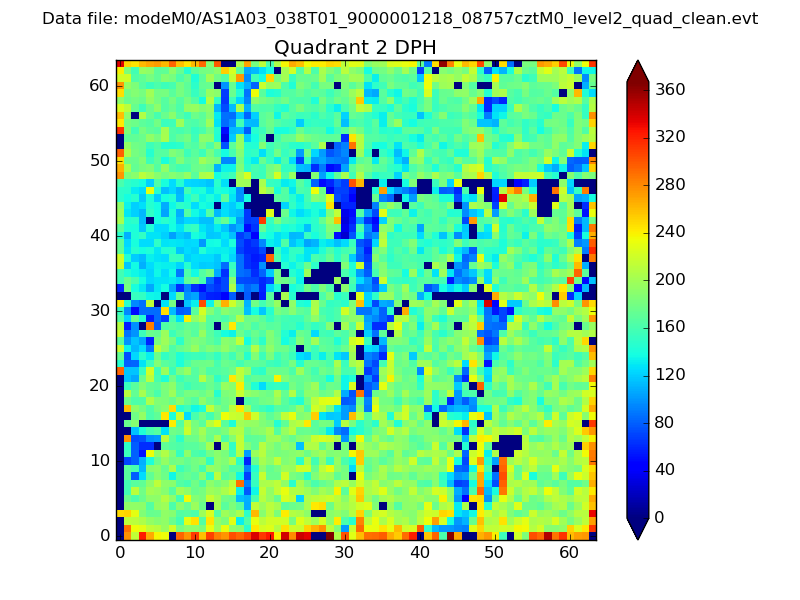
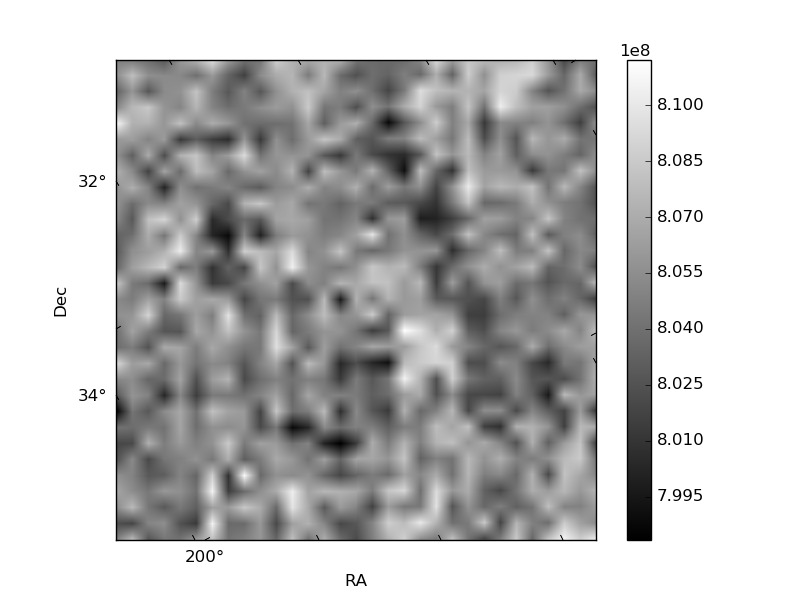
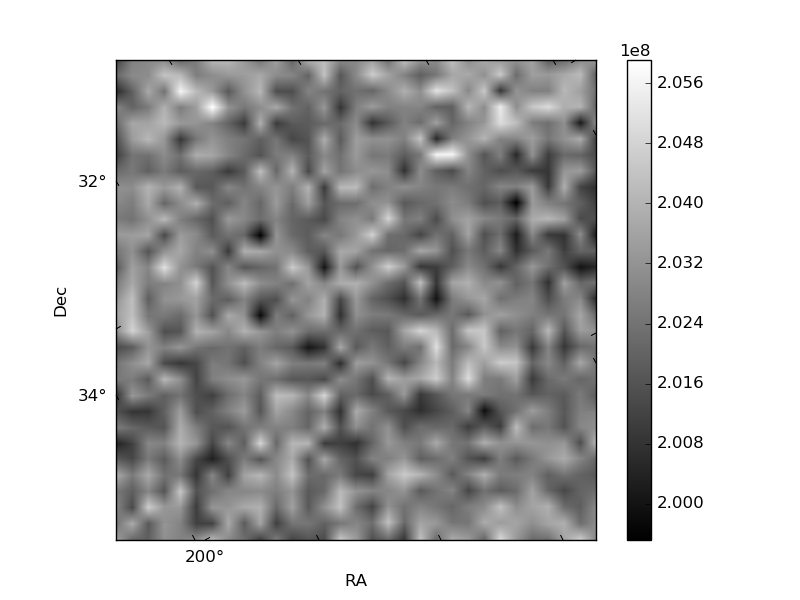
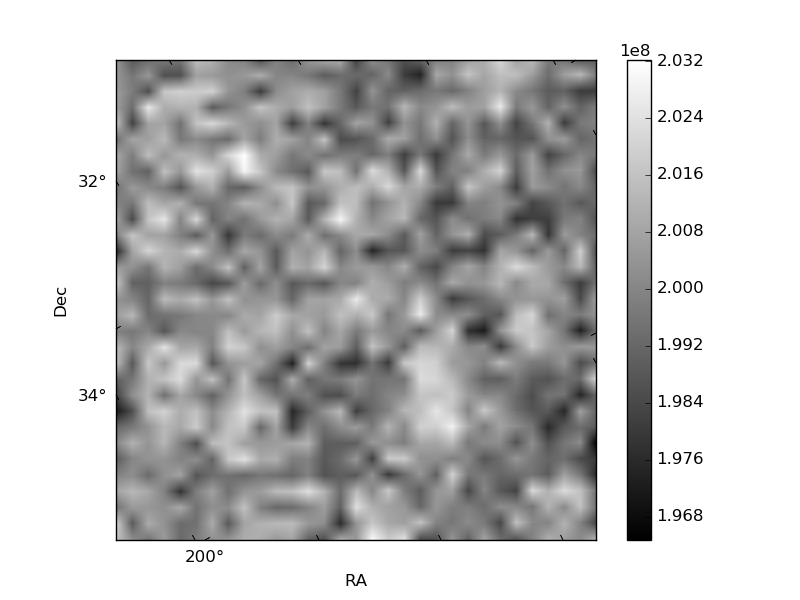
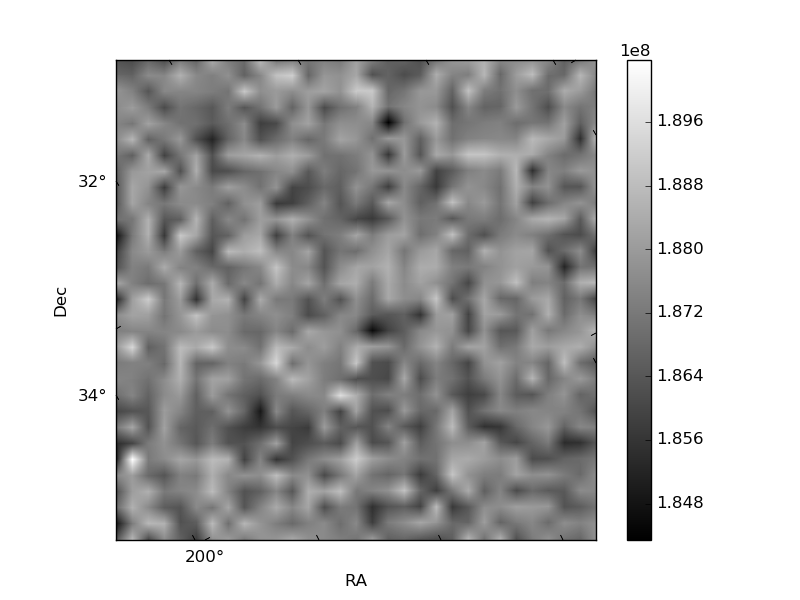
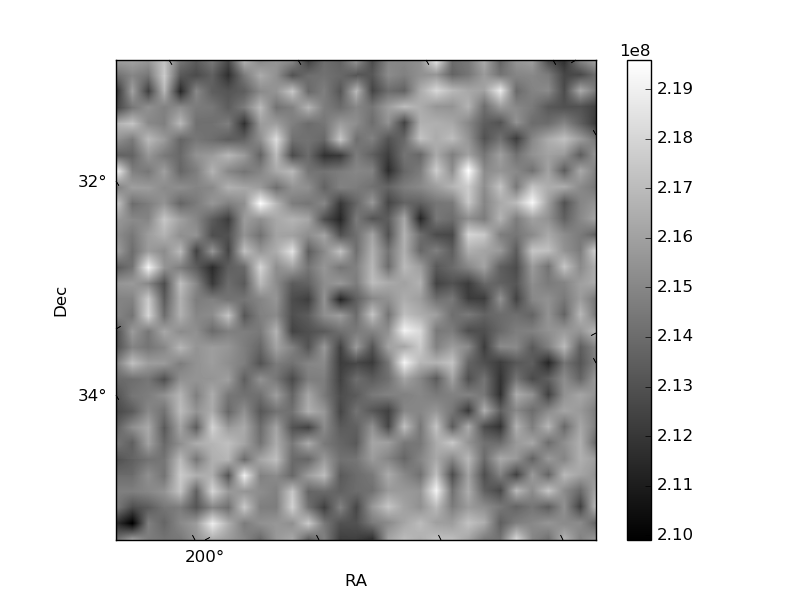
Histogram calculated using DETX and DETY for each event in the final _common_clean file
| Quadrant A | 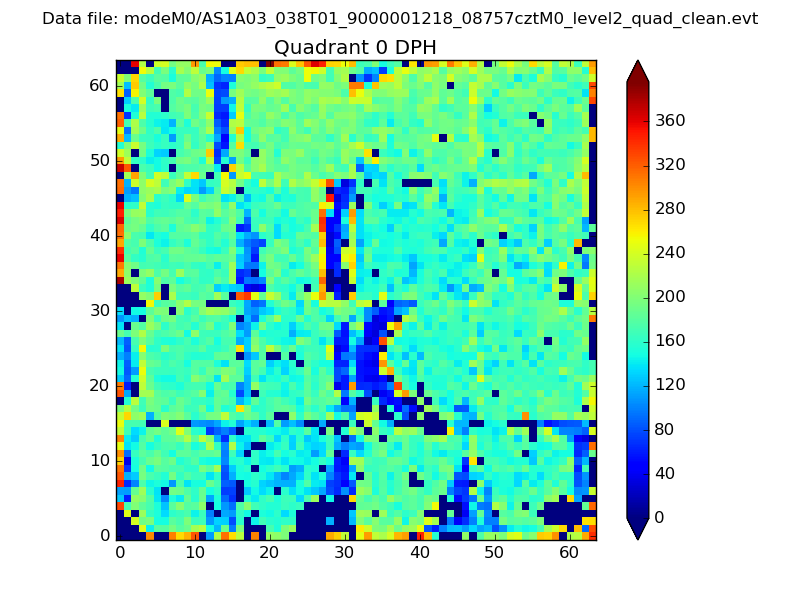 |
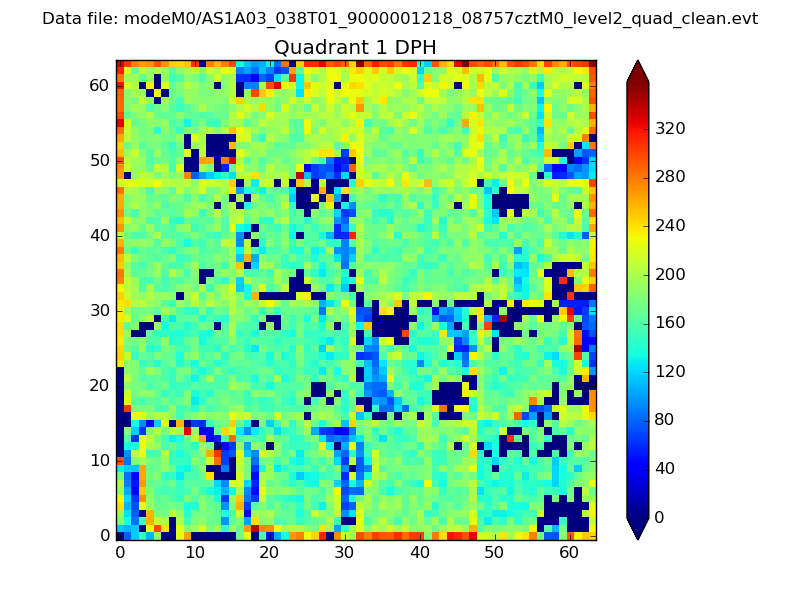 |
Quadrant B |
|---|---|---|---|
| Quadrant D | 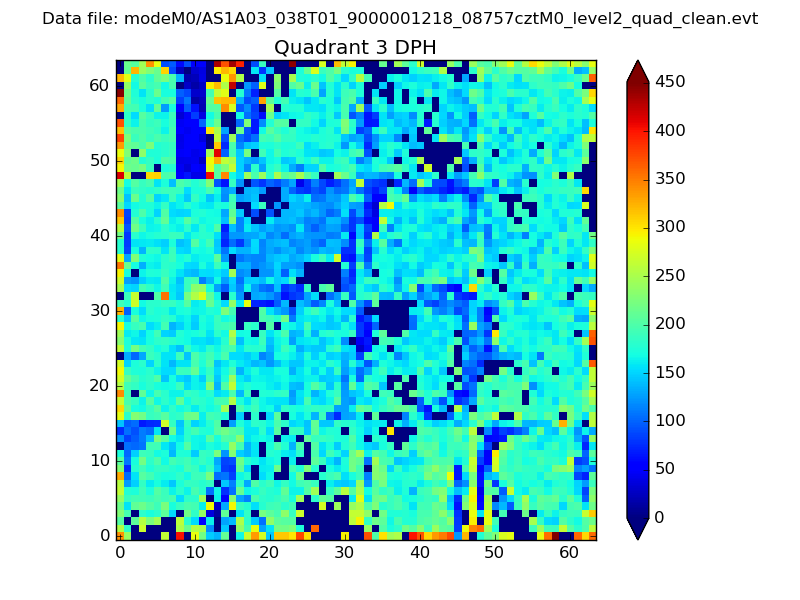 |
 |
Quadrant C |
| Plot type | Count rate plots | Images |
|---|---|---|
| Comparison with Poisson distribution Blue bars denote a histogram of data divided into 1 sec bins. Red curve is a Poisson curve with rate = median count rate of data. |
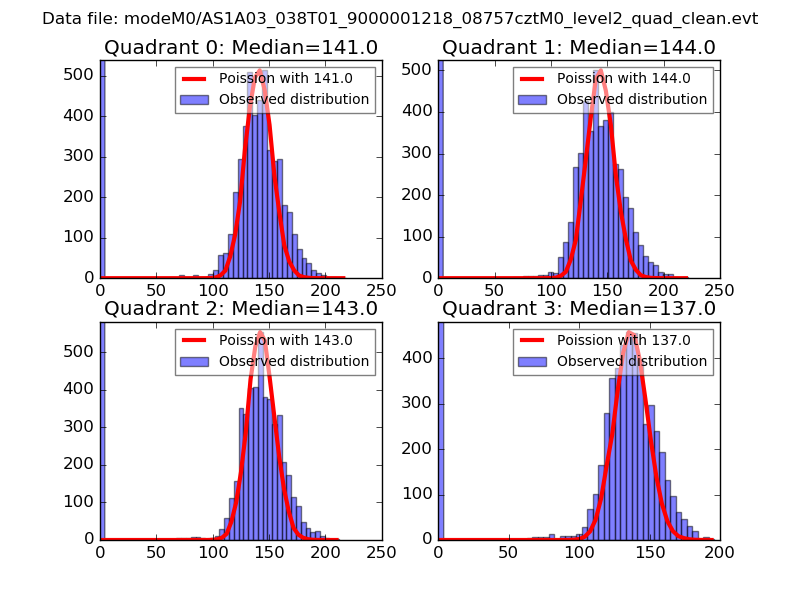 |
 |
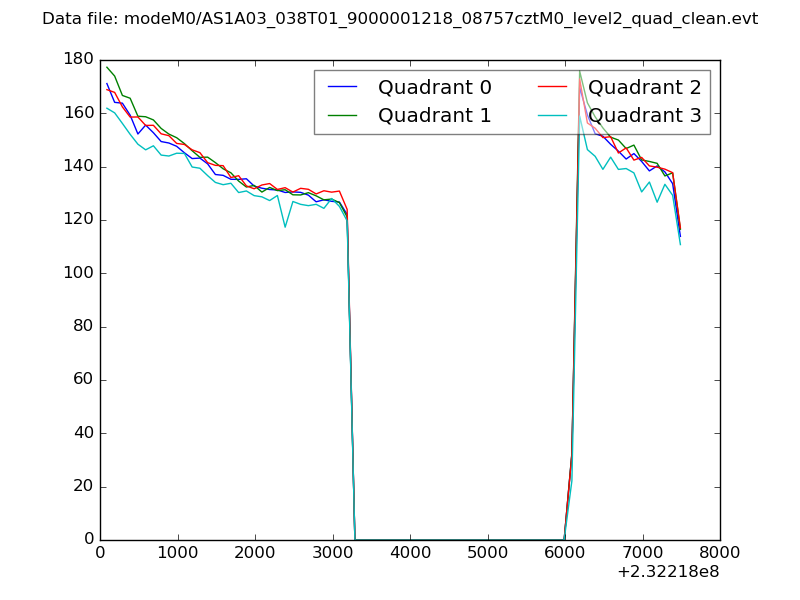
| Quadrant-wise count rates Data is divided into 100 sec bins |
 |
|
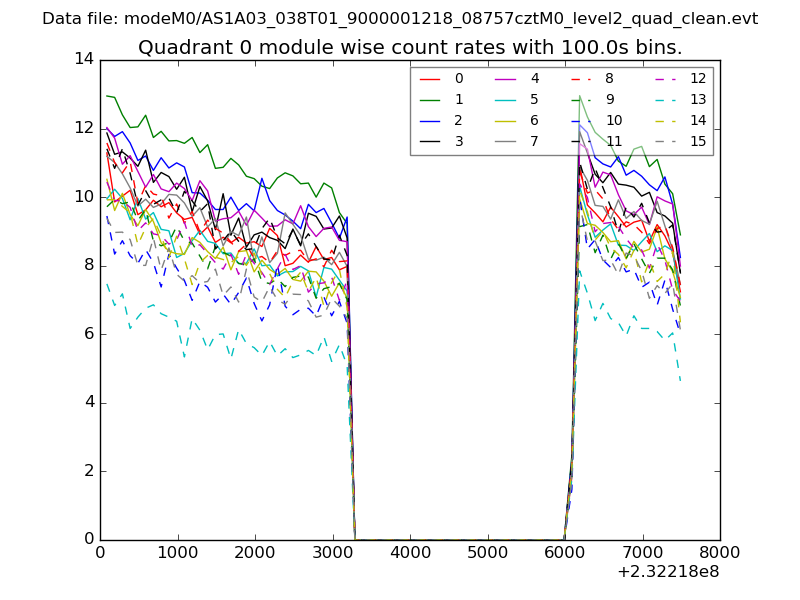
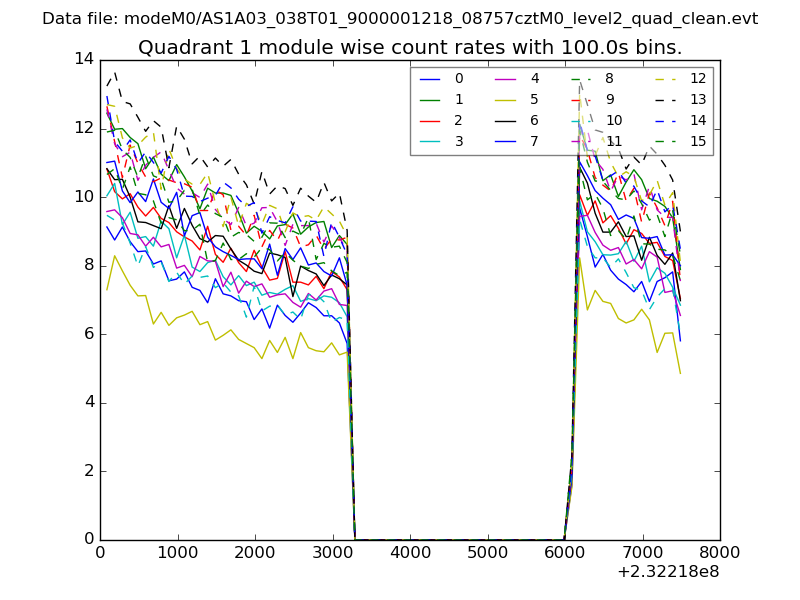
| Module-wise count rates for Quadrant A Data is divided into 100 sec bins |
 |
 |
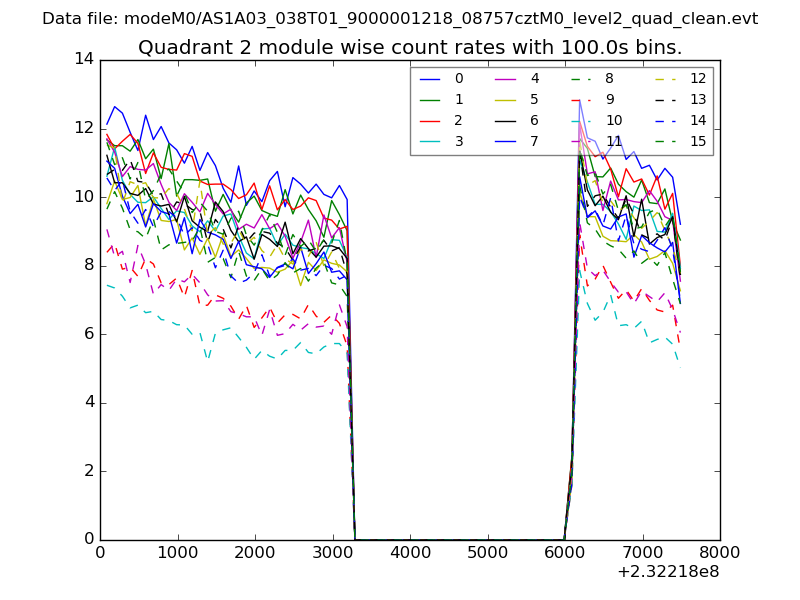
| Module-wise count rates for Quadrant B Data is divided into 100 sec bins |
 |
 |
| Module-wise count rates for Quadrant C Data is divided into 100 sec bins |
 |
 |
| Module-wise count rates for Quadrant D Data is divided into 100 sec bins |
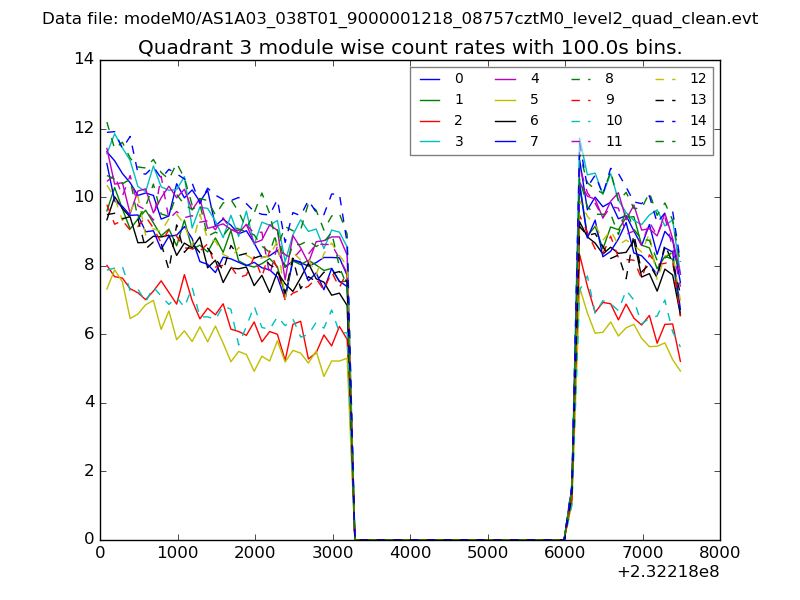 |
 |
| Parameter | Plot |
|---|---|
| CZT HV Monitor | 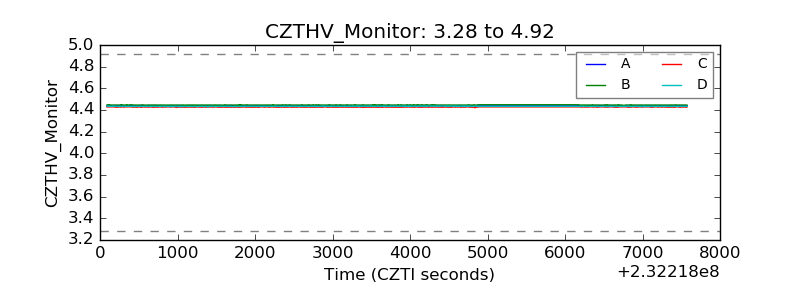 |
| D_VDD | 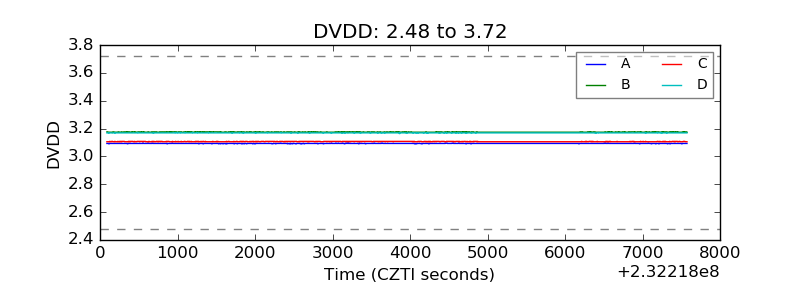 |
| Temperature 1 |  |
| Veto HV Monitor | 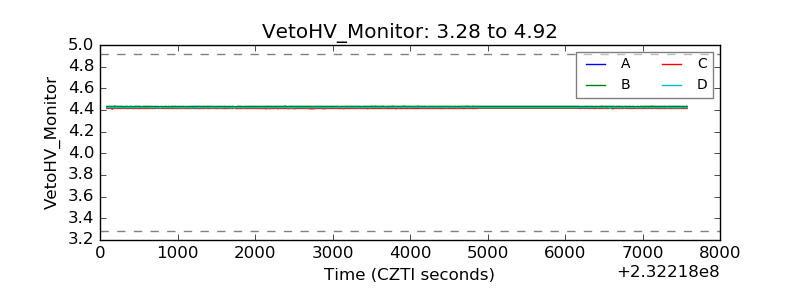 |
| Veto LLD |  |
| Alpha Counter | 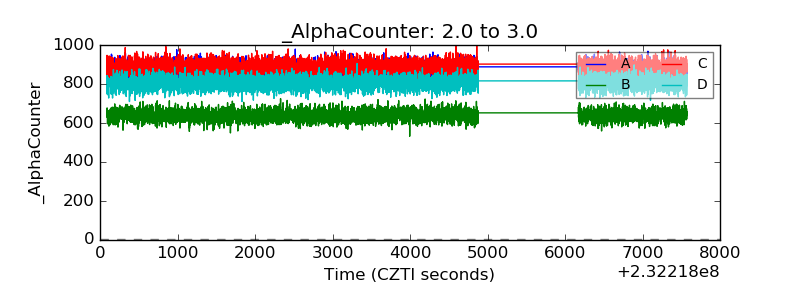 |
| _CPM_Rate | 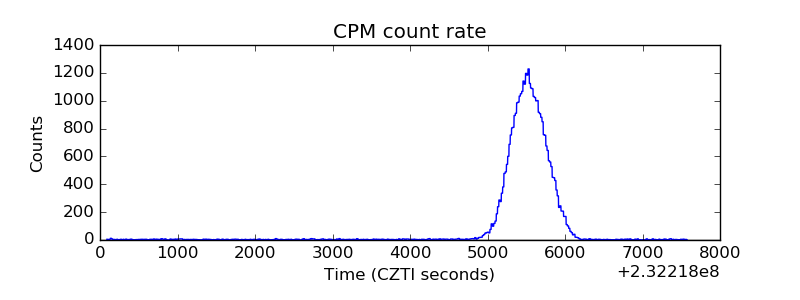 |
| CZT Counter | 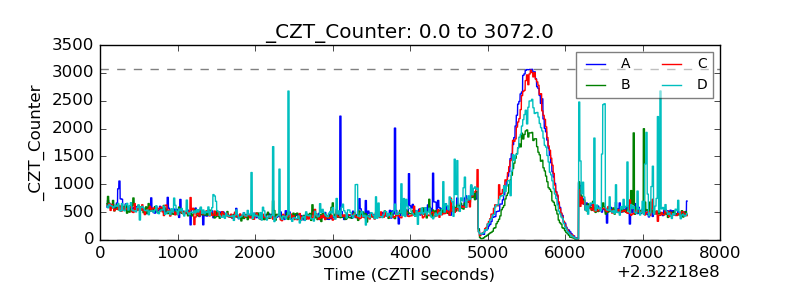 |
| +2.5 Volts monitor |  |
| +5 Volts monitor |  |
| _ROLL_ROT | 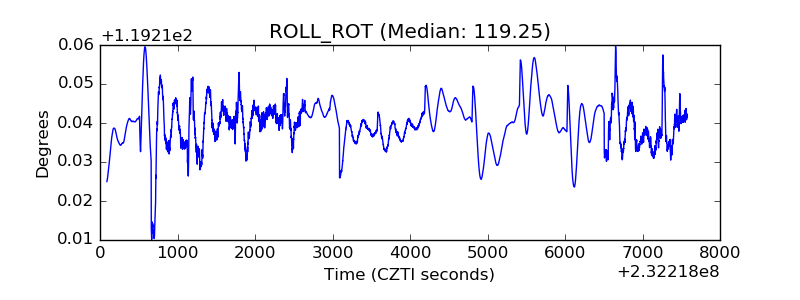 |
| _Roll_DEC | 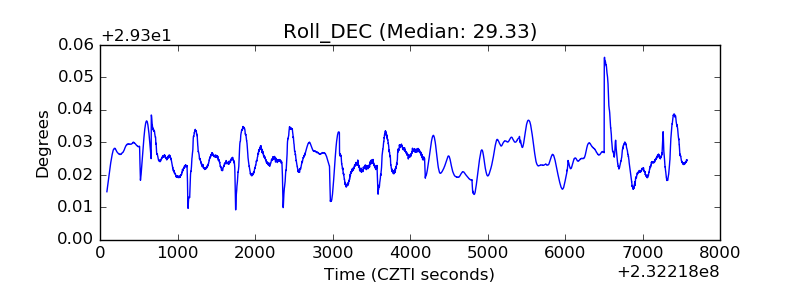 |
| _Roll_RA | 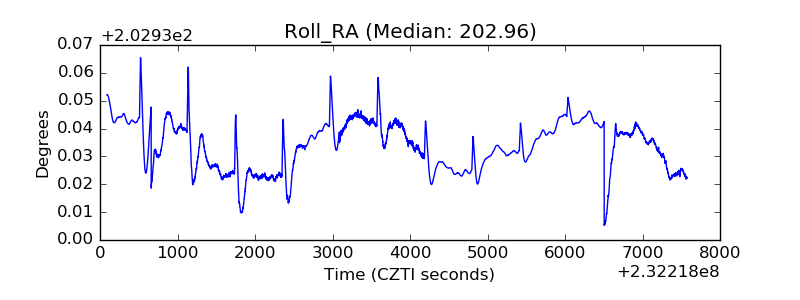 |
| Veto Counter | 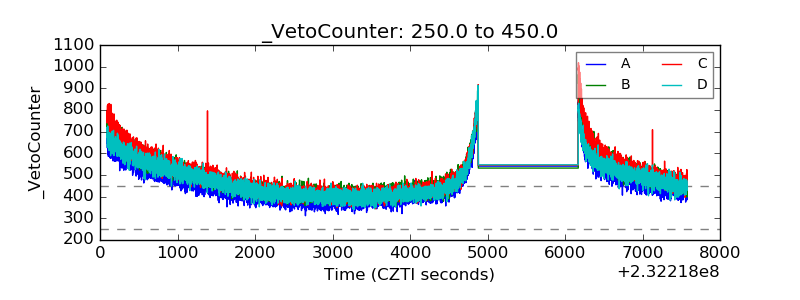 |