| Param | Original file | Final file |
|---|---|---|
| Filename | modeM0/AS1A03_038T01_9000001218_08758cztM0_level2.evt | modeM0/AS1A03_038T01_9000001218_08758cztM0_level2_quad_clean.evt |
| Size (bytes) | 432,057,600 | 88,914,240 |
| Size | 412.0 MB | 84.8 MB |
| Events in quadrant A | 3,093,773 | 564,290 |
| Events in quadrant B | 3,056,970 | 575,622 |
| Events in quadrant C | 3,013,863 | 570,005 |
| Events in quadrant D | 3,493,577 | 544,715 |
| Mode M9 | |||
|---|---|---|---|
| Quadrant | BADHDUFLAG | Total packets | Discarded packets |
| A | 0 | 12 | 0 |
| B | 0 | 12 | 0 |
| C | 0 | 12 | 0 |
| D | 0 | 12 | 0 |
| Mode M0 | |||
|---|---|---|---|
| Quadrant | BADHDUFLAG | Total packets | Discarded packets |
| A | 0 | 13305 | 3 |
| B | 0 | 13256 | 2 |
| C | 0 | 13148 | 2 |
| D | 0 | 14723 | 2 |
| Mode SS | |||
|---|---|---|---|
| Quadrant | BADHDUFLAG | Total packets | Discarded packets |
| A | 0 | 128 | 0 |
| B | 0 | 128 | 0 |
| C | 0 | 128 | 0 |
| D | 0 | 128 | 0 |
| Quadrant | Total seconds | Saturated seconds | Saturation percentage |
|---|---|---|---|
| A | 6274 | 52 | 0.828817% |
| B | 6274 | 54 | 0.860695% |
| C | 6274 | 34 | 0.541919% |
| D | 6275 | 147 | 2.342629% |
Noise dominated data is calculated using 1-second bins in cleaned event files. If a bin has >2000 counts, and if more than 50% of those come from <1% of pixels, then it is considered to be noise-dominated and hence unusable.
| Quadrant | # 1 sec bins | Bins with >0 counts | Bins with >2000 counts | High rate bins dominated by noise | Noise dominated (total time) | Noise dominated (detector-on time) | Marked lightcurve |
|---|---|---|---|---|---|---|---|
| A | 7489 | 6275 | 3 | 3 | 0.04% | 0.05% | 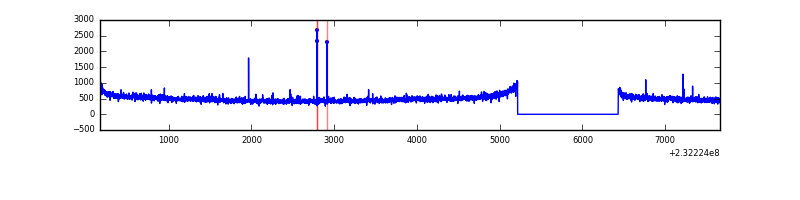 |
| B | 7489 | 6274 | 4 | 4 | 0.05% | 0.06% | 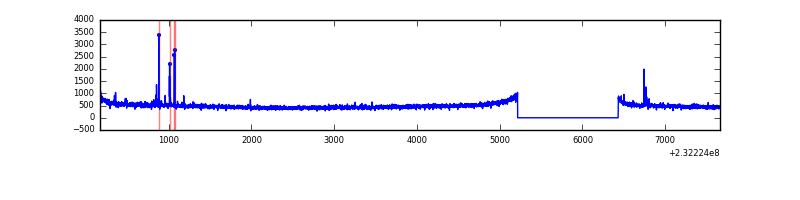 |
| C | 7489 | 6274 | 3 | 3 | 0.04% | 0.05% | 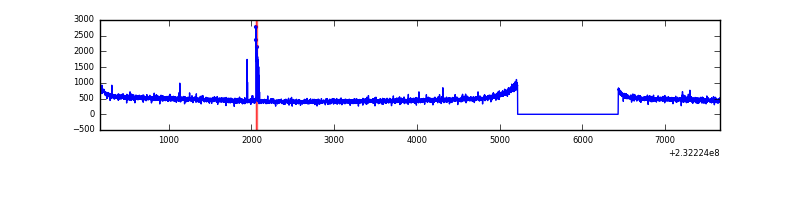 |
| D | 7490 | 6275 | 84 | 84 | 1.12% | 1.34% | 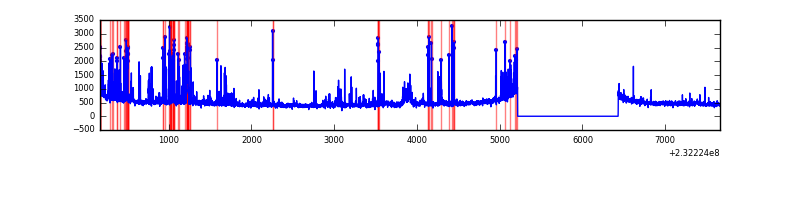 |
Top three noisy pixels from each quadrant. If the there are fewer than three noisy pixels in the level2.evt file, extra rows are filled as -1
| Pixel properties | Quadrant properties | ||||||
|---|---|---|---|---|---|---|---|
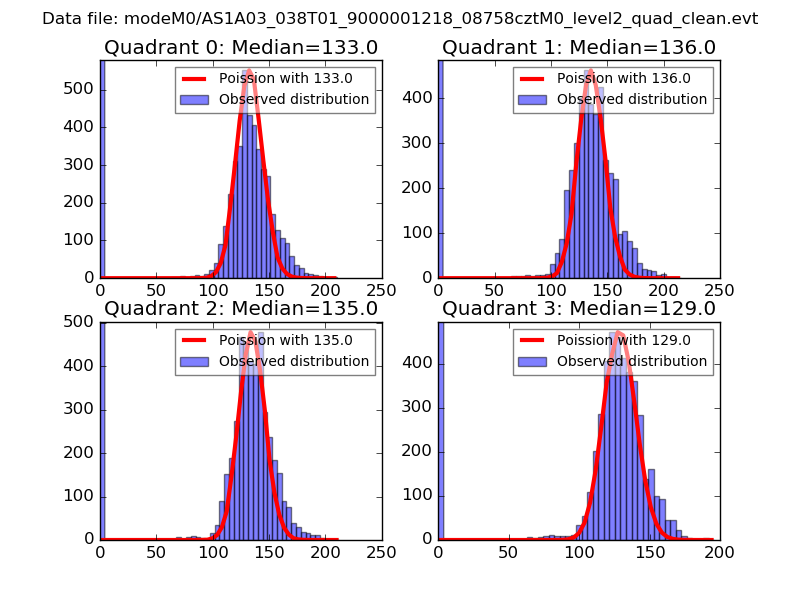
| Quadrant | DetID | PixID | Counts | Sigma | Mean | Median | Sigma |
| A | 13 | 251 | 98800 | 629.3 | 773 | 760 | 155.8 |
| A | 5 | 16 | 14622 | 88.98 | 773 | 760 | 155.8 |
| A | 0 | 226 | 7121 | 40.83 | 773 | 760 | 155.8 |
| B | 10 | 16 | 37585 | 249.37 | 776 | 758 | 147.7 |
| B | 12 | 111 | 16030 | 103.41 | 776 | 758 | 147.7 |
| B | 4 | 173 | 14117 | 90.46 | 776 | 758 | 147.7 |
| C | 14 | 234 | 31072 | 171.11 | 762 | 768 | 177.1 |
| C | 13 | 61 | 5669 | 27.67 | 762 | 768 | 177.1 |
| C | 12 | 4 | 4518 | 21.17 | 762 | 768 | 177.1 |
| D | 1 | 52 | 454123 | 2348.79 | 750 | 734 | 193.0 |
| D | 2 | 152 | 147671 | 761.21 | 750 | 734 | 193.0 |
| D | 2 | 234 | 19196 | 95.64 | 750 | 734 | 193.0 |
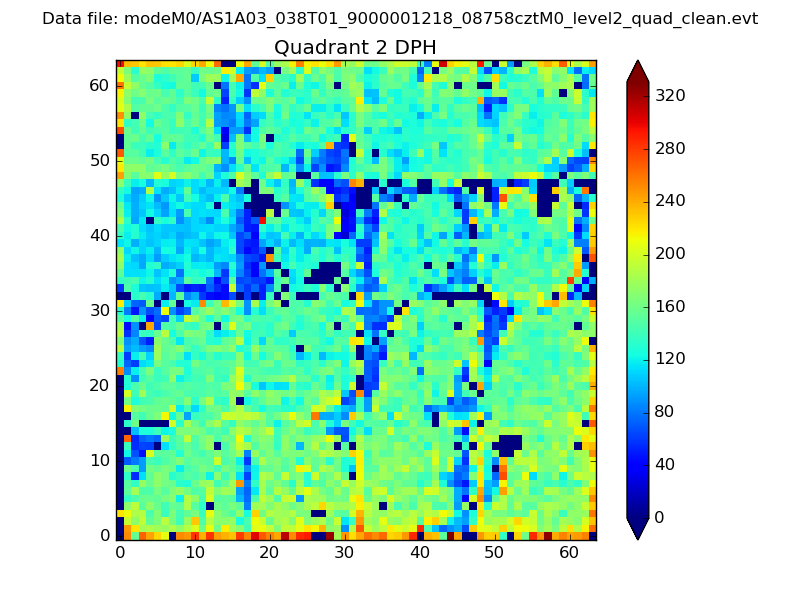
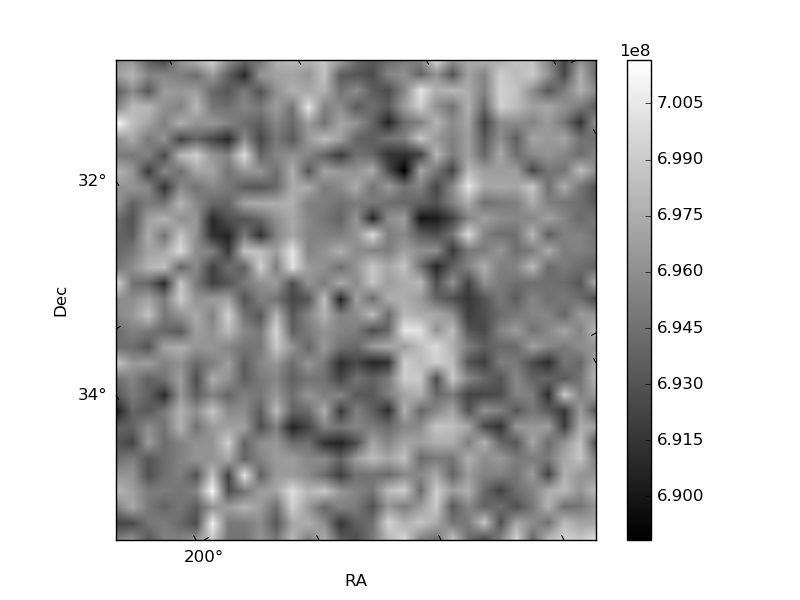
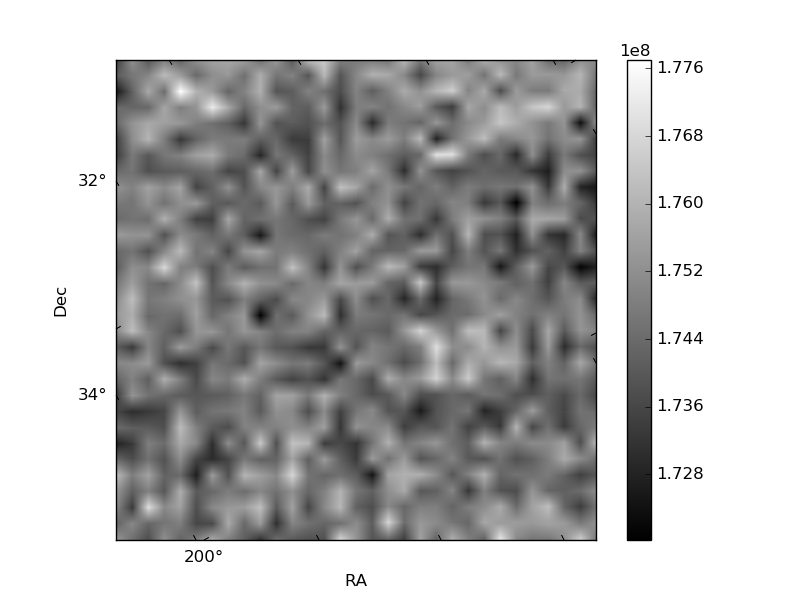
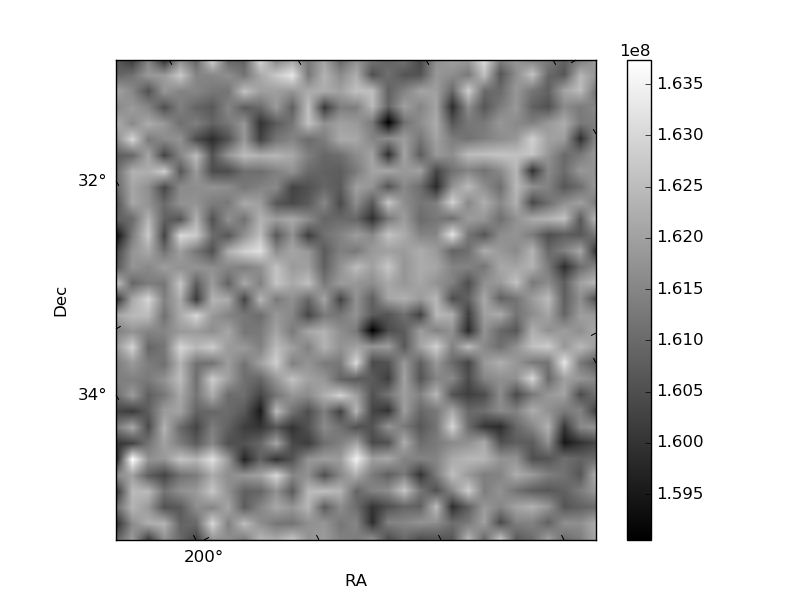
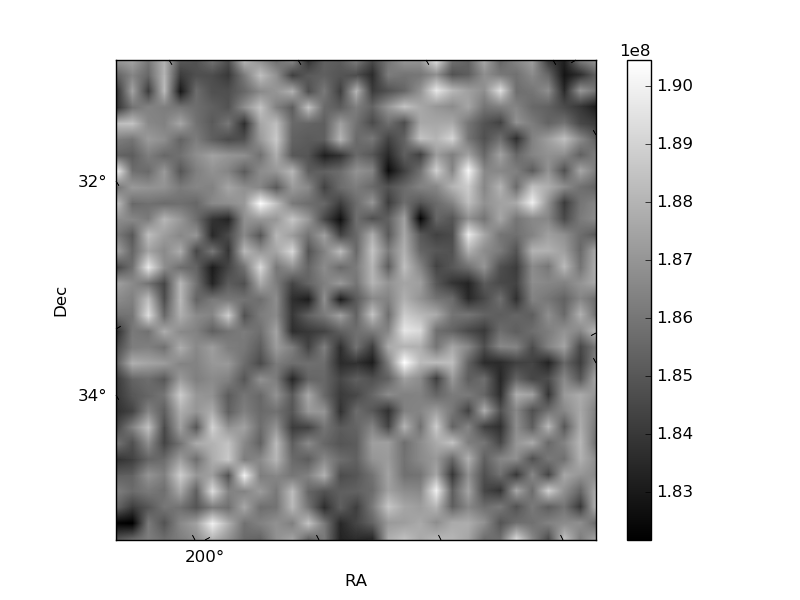
Histogram calculated using DETX and DETY for each event in the final _common_clean file
| Quadrant A | 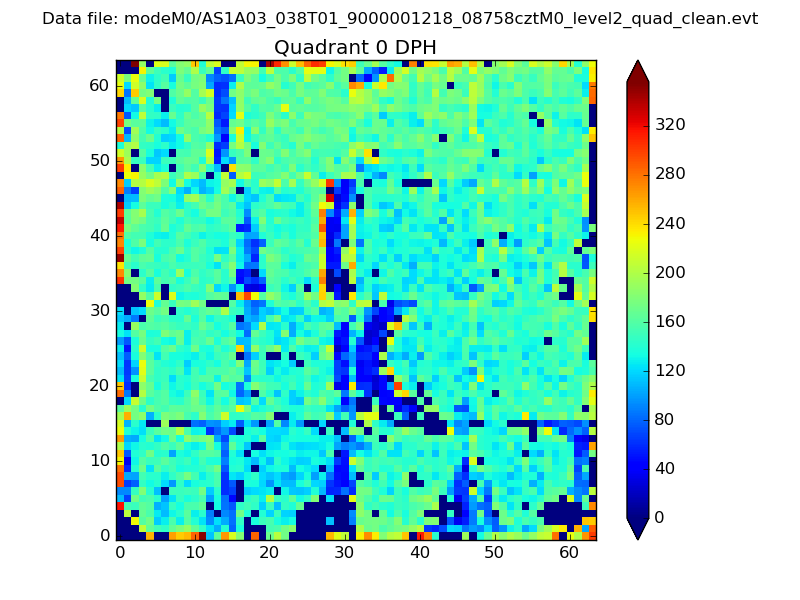 |
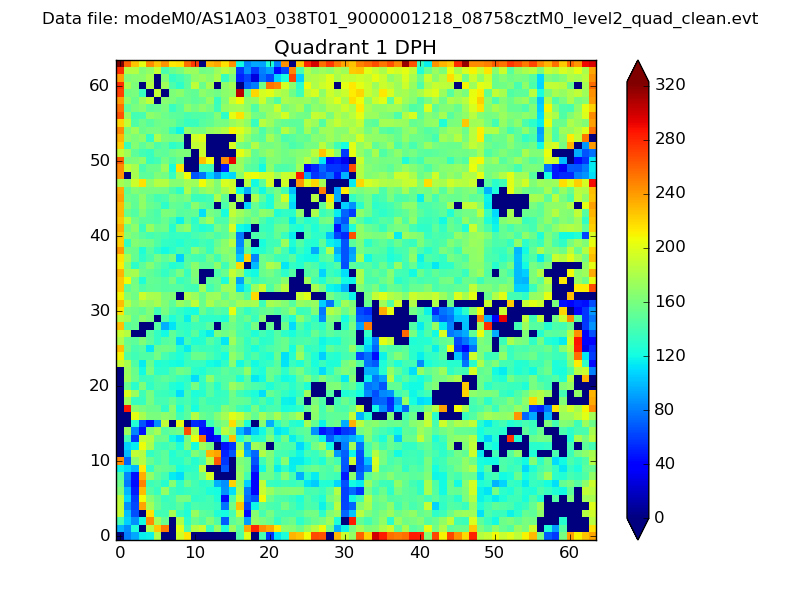 |
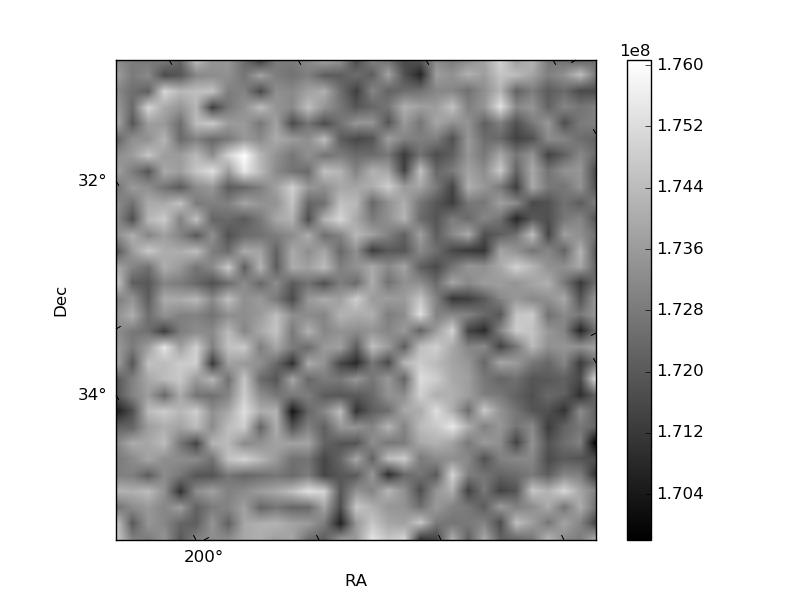
Quadrant B |
|---|---|---|---|
| Quadrant D | 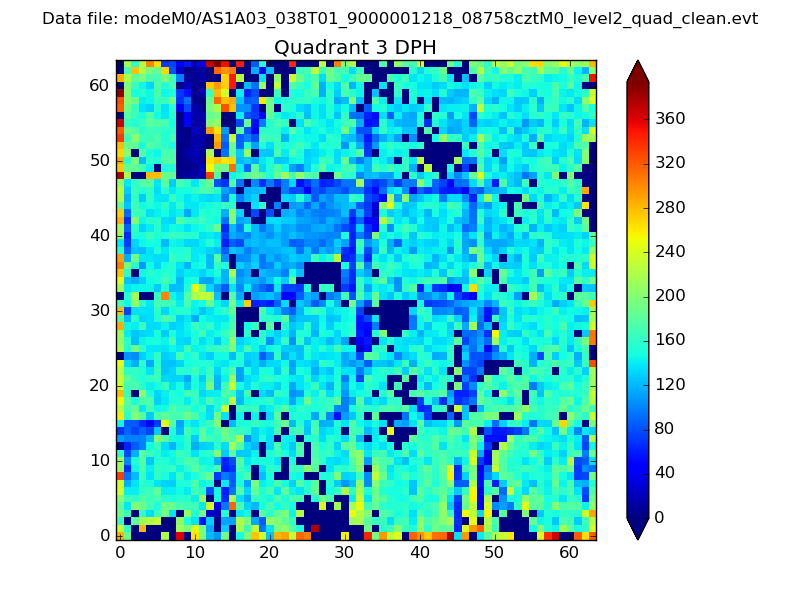 |
 |
Quadrant C |
| Plot type | Count rate plots | Images |
|---|---|---|
| Comparison with Poisson distribution Blue bars denote a histogram of data divided into 1 sec bins. Red curve is a Poisson curve with rate = median count rate of data. |
 |
 |
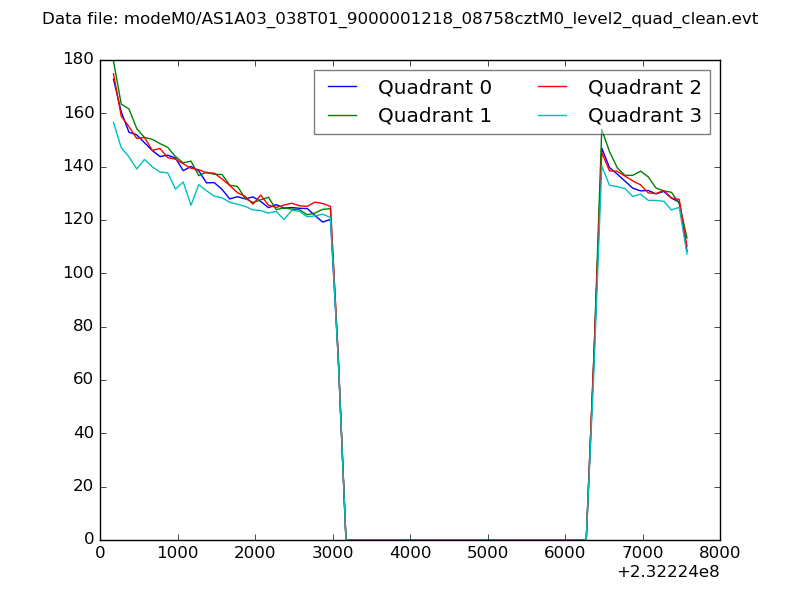
| Quadrant-wise count rates Data is divided into 100 sec bins |
 |
|
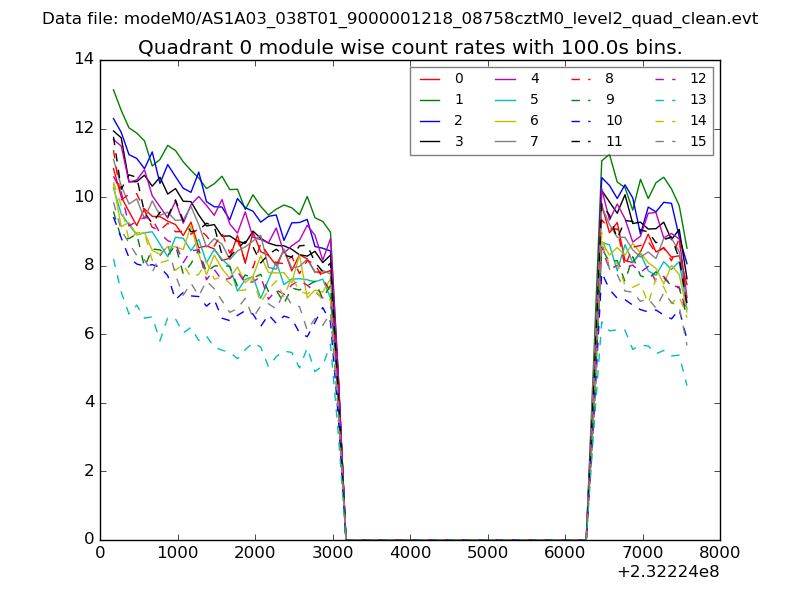
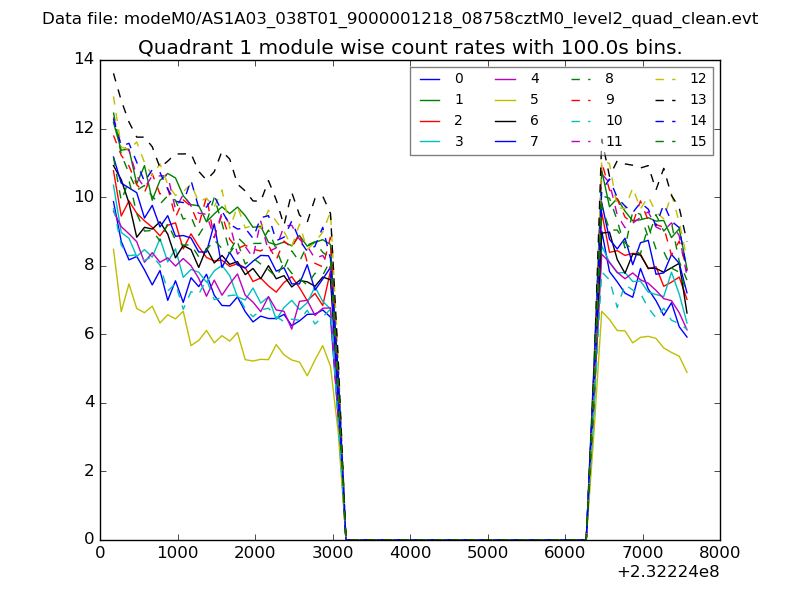
| Module-wise count rates for Quadrant A Data is divided into 100 sec bins |
 |
 |
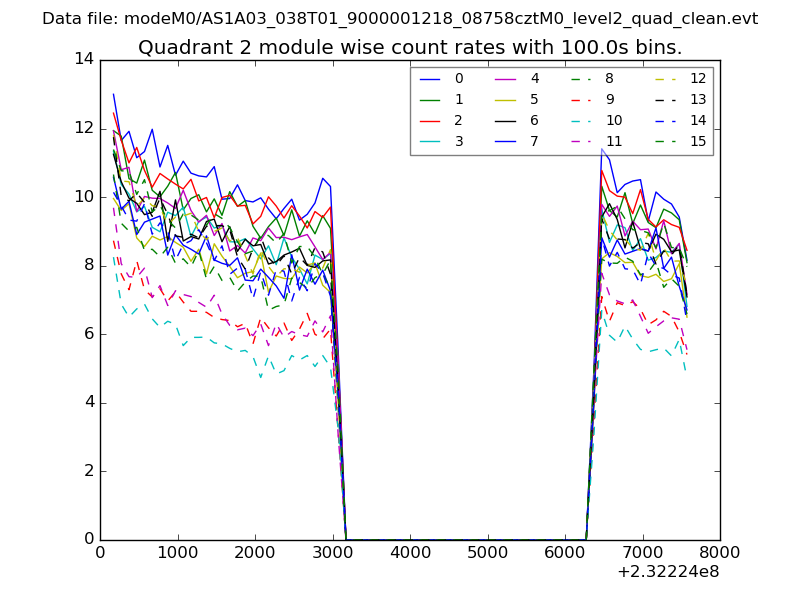
| Module-wise count rates for Quadrant B Data is divided into 100 sec bins |
 |
 |
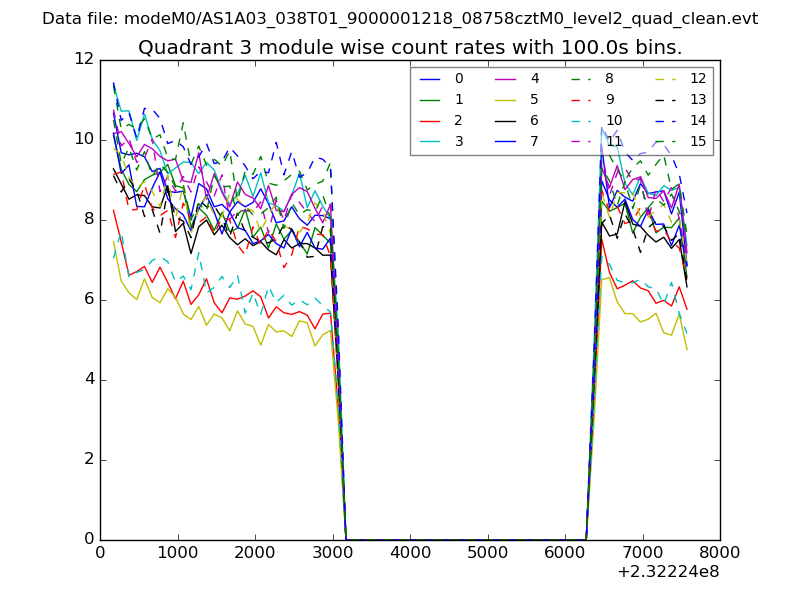
| Module-wise count rates for Quadrant C Data is divided into 100 sec bins |
 |
 |
| Module-wise count rates for Quadrant D Data is divided into 100 sec bins |
 |
 |
| Parameter | Plot |
|---|---|
| CZT HV Monitor | 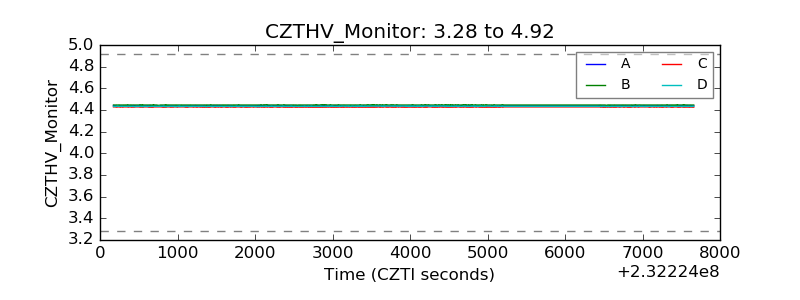 |
| D_VDD | 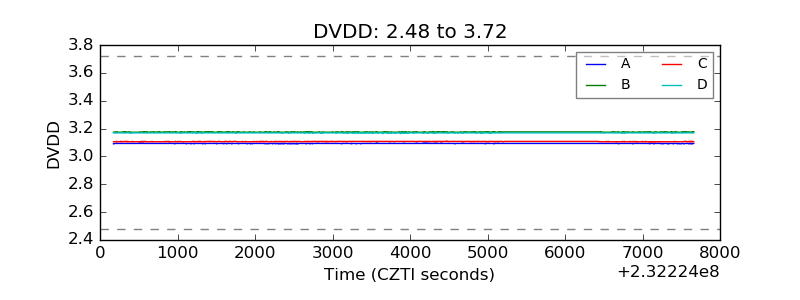 |
| Temperature 1 | 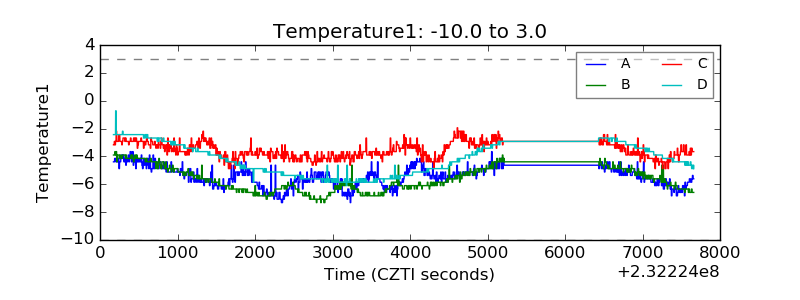 |
| Veto HV Monitor | 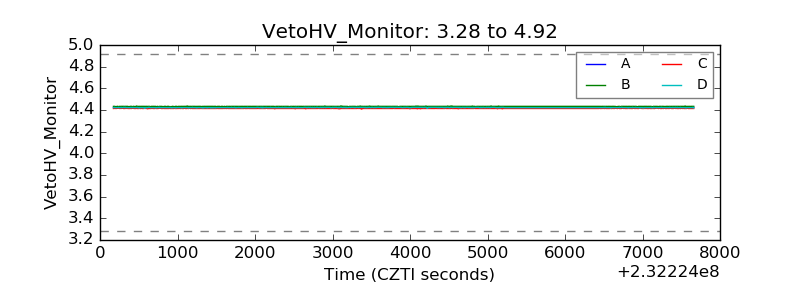 |
| Veto LLD | 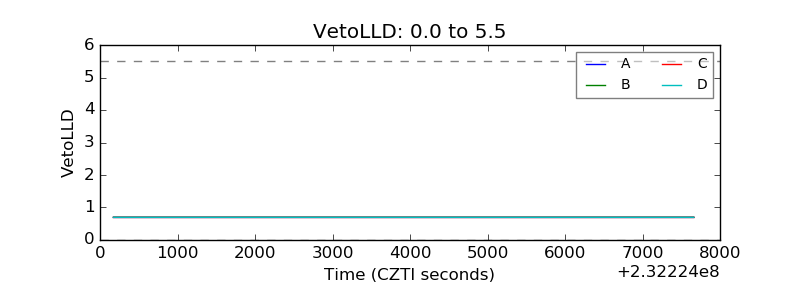 |
| Alpha Counter | 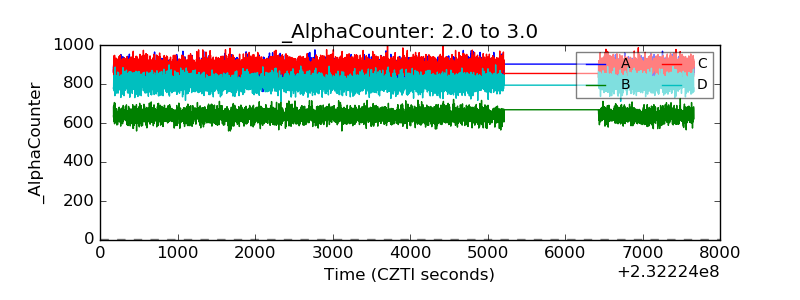 |
| _CPM_Rate | 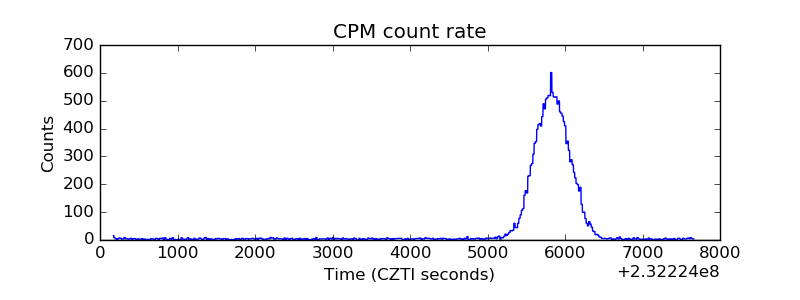 |
| CZT Counter | 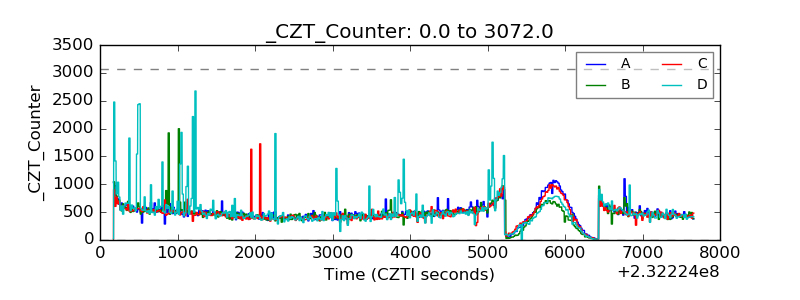 |
| +2.5 Volts monitor | 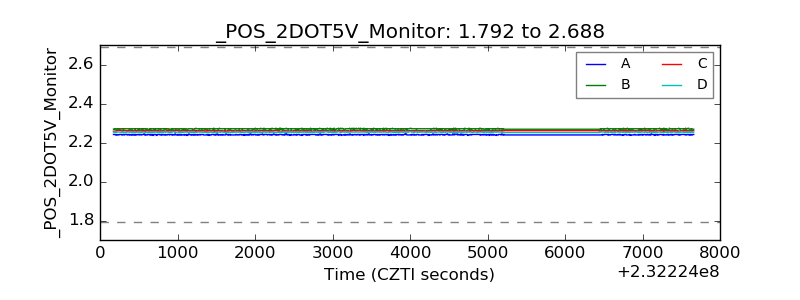 |
| +5 Volts monitor | 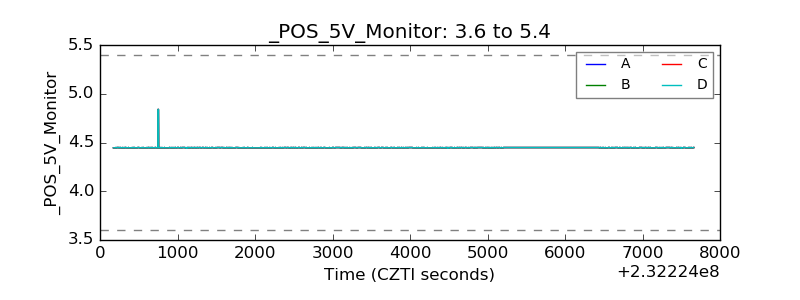 |
| _ROLL_ROT | 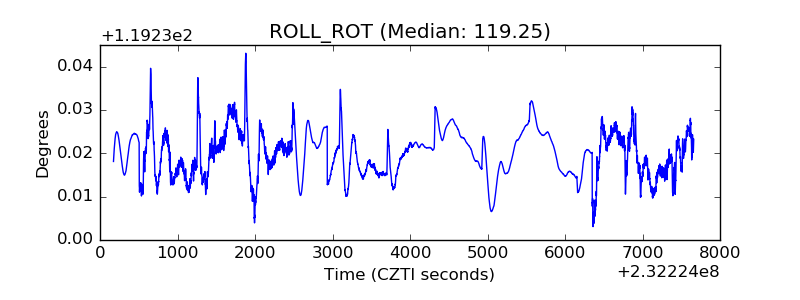 |
| _Roll_DEC | 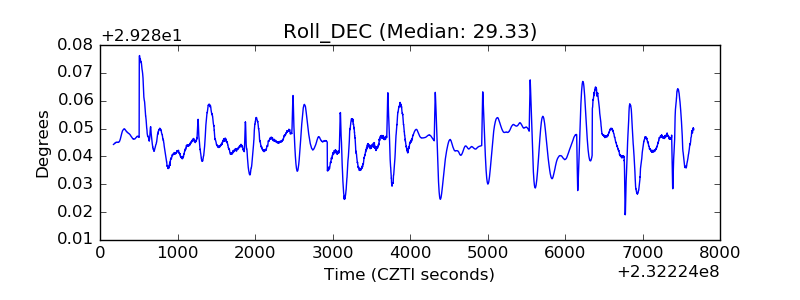 |
| _Roll_RA | 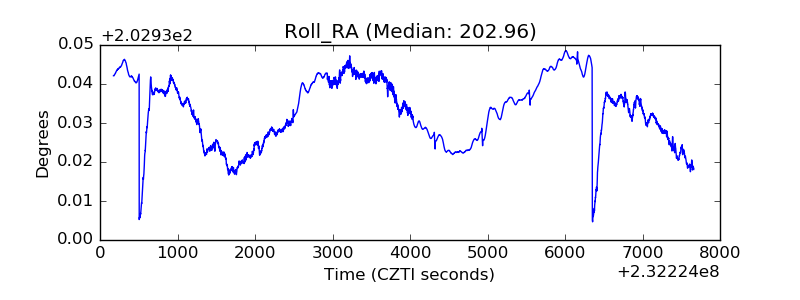 |
| Veto Counter | 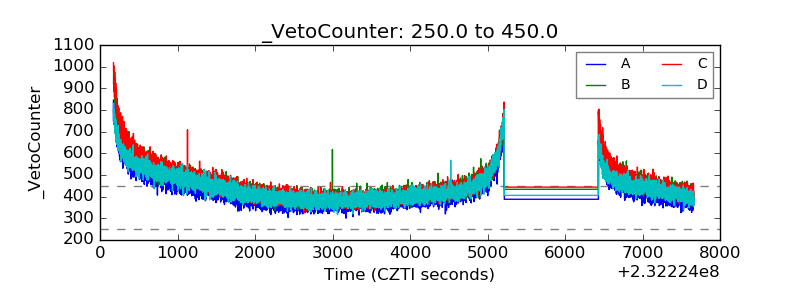 |