| Param | Original file | Final file |
|---|---|---|
| Filename | modeM0/AS1A03_038T01_9000001218_08760cztM0_level2.evt | modeM0/AS1A03_038T01_9000001218_08760cztM0_level2_quad_clean.evt |
| Size (bytes) | 481,950,720 | 97,894,080 |
| Size | 459.6 MB | 93.4 MB |
| Events in quadrant A | 3,422,113 | 618,514 |
| Events in quadrant B | 3,314,678 | 627,931 |
| Events in quadrant C | 3,245,526 | 622,242 |
| Events in quadrant D | 4,122,388 | 592,501 |
| Mode M9 | |||
|---|---|---|---|
| Quadrant | BADHDUFLAG | Total packets | Discarded packets |
| A | 0 | 11 | 0 |
| B | 0 | 11 | 0 |
| C | 0 | 11 | 0 |
| D | 0 | 12 | 0 |
| Mode M0 | |||
|---|---|---|---|
| Quadrant | BADHDUFLAG | Total packets | Discarded packets |
| A | 0 | 15076 | 3 |
| B | 0 | 14874 | 2 |
| C | 0 | 14810 | 2 |
| D | 0 | 17543 | 2 |
| Mode SS | |||
|---|---|---|---|
| Quadrant | BADHDUFLAG | Total packets | Discarded packets |
| A | 0 | 146 | 0 |
| B | 0 | 146 | 0 |
| C | 0 | 146 | 0 |
| D | 0 | 146 | 0 |
| Quadrant | Total seconds | Saturated seconds | Saturation percentage |
|---|---|---|---|
| A | 7230 | 26 | 0.359613% |
| B | 7230 | 25 | 0.345781% |
| C | 7230 | 11 | 0.152144% |
| D | 7230 | 167 | 2.309820% |
Noise dominated data is calculated using 1-second bins in cleaned event files. If a bin has >2000 counts, and if more than 50% of those come from <1% of pixels, then it is considered to be noise-dominated and hence unusable.
| Quadrant | # 1 sec bins | Bins with >0 counts | Bins with >2000 counts | High rate bins dominated by noise | Noise dominated (total time) | Noise dominated (detector-on time) | Marked lightcurve |
|---|---|---|---|---|---|---|---|
| A | 7710 | 7231 | 8 | 8 | 0.10% | 0.11% | 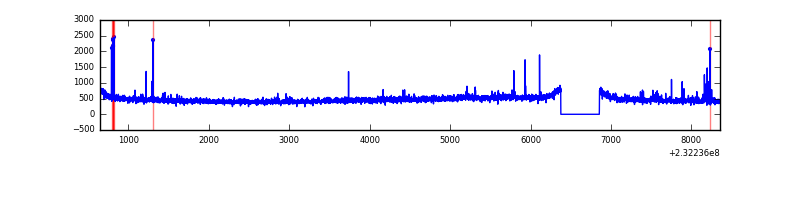 |
| B | 7710 | 7231 | 2 | 2 | 0.03% | 0.03% | 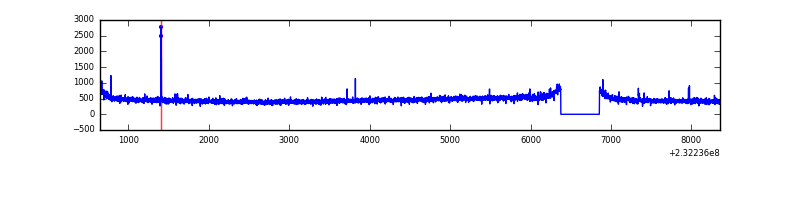 |
| C | 7710 | 7231 | 1 | 1 | 0.01% | 0.01% | 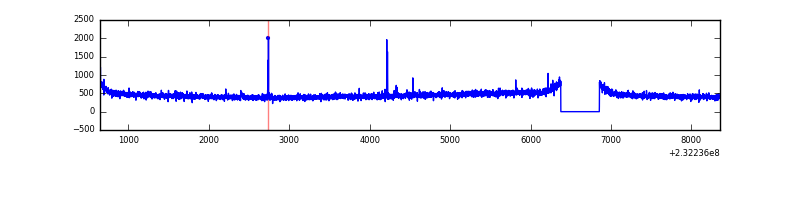 |
| D | 7710 | 7231 | 131 | 131 | 1.70% | 1.81% | 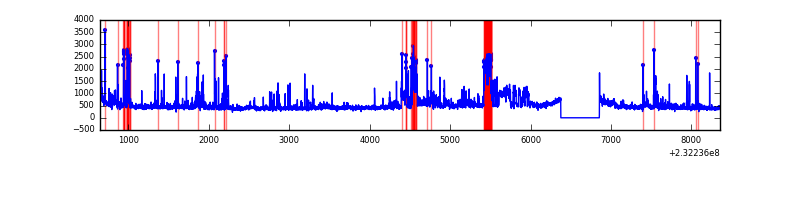 |
Top three noisy pixels from each quadrant. If the there are fewer than three noisy pixels in the level2.evt file, extra rows are filled as -1
| Pixel properties | Quadrant properties | ||||||
|---|---|---|---|---|---|---|---|
| Quadrant | DetID | PixID | Counts | Sigma | Mean | Median | Sigma |
| A | 13 | 251 | 109299 | 631.33 | 841 | 822 | 171.8 |
| A | 5 | 16 | 42307 | 241.44 | 841 | 822 | 171.8 |
| A | 13 | 14 | 20005 | 111.64 | 841 | 822 | 171.8 |
| B | 12 | 111 | 18199 | 107.09 | 845 | 825 | 162.2 |
| B | 11 | 111 | 14841 | 86.39 | 845 | 825 | 162.2 |
| B | 4 | 80 | 11592 | 66.37 | 845 | 825 | 162.2 |
| C | 9 | 54 | 21054 | 104.66 | 824 | 829 | 193.2 |
| C | 13 | 61 | 6056 | 27.05 | 824 | 829 | 193.2 |
| C | 14 | 64 | 5486 | 24.1 | 824 | 829 | 193.2 |
| D | 1 | 52 | 832374 | 3980.62 | 807 | 791 | 208.9 |
| D | 2 | 152 | 143270 | 682.02 | 807 | 791 | 208.9 |
| D | 2 | 14 | 34474 | 161.23 | 807 | 791 | 208.9 |
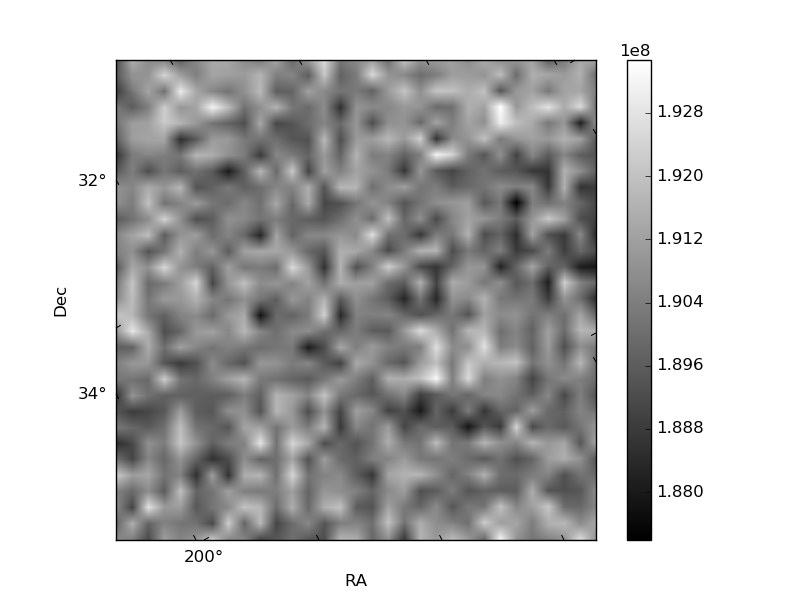
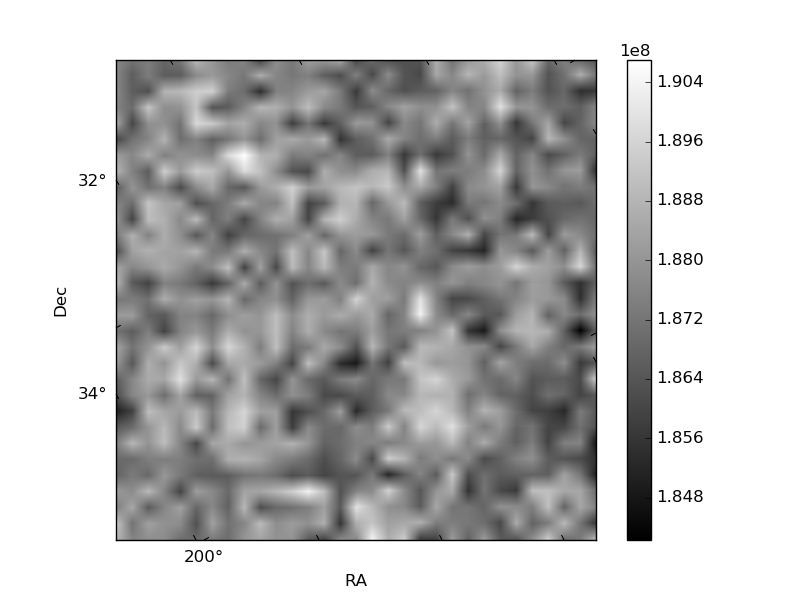
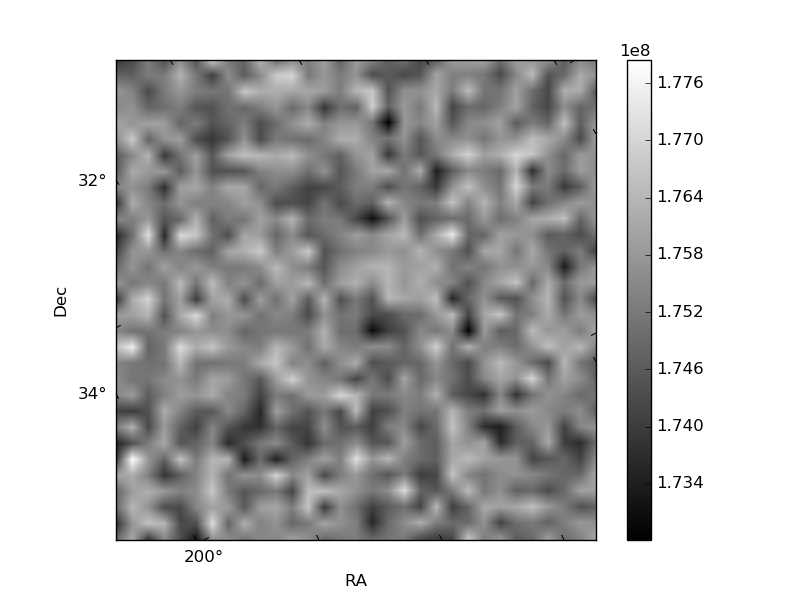
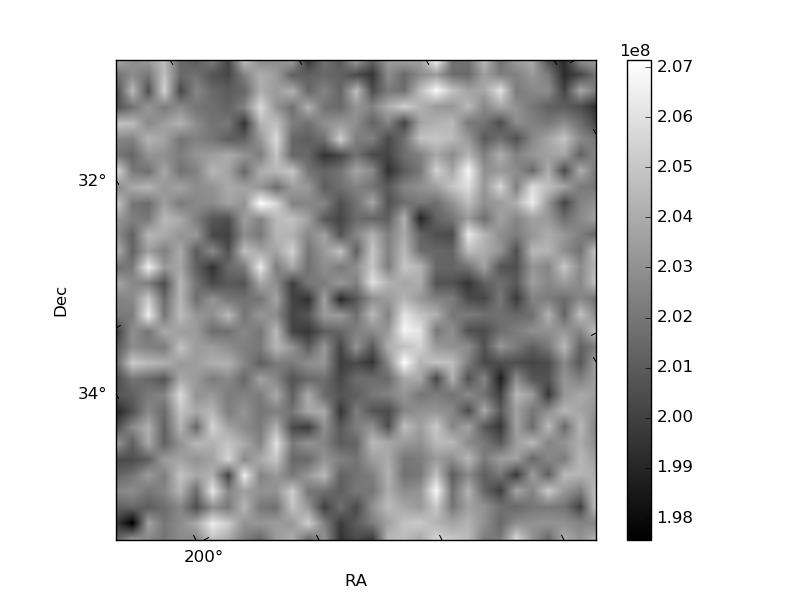
Histogram calculated using DETX and DETY for each event in the final _common_clean file
| Quadrant A | 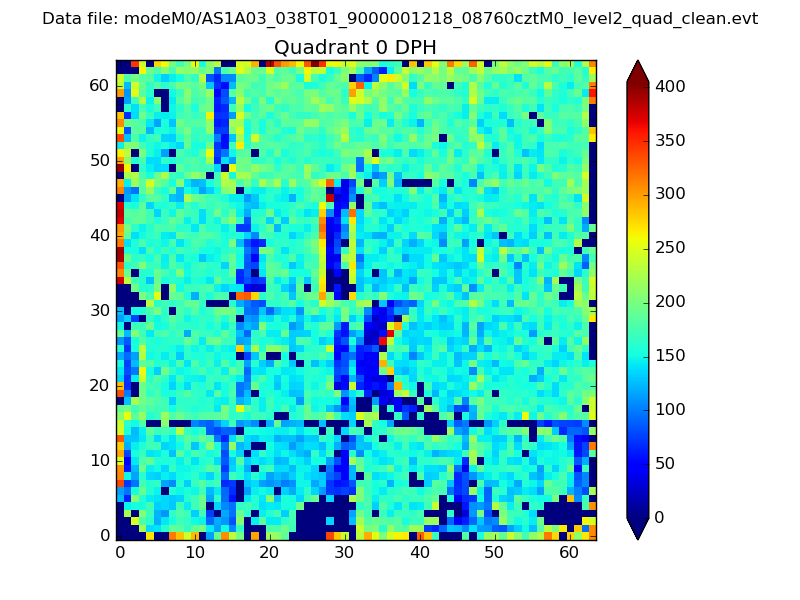 |
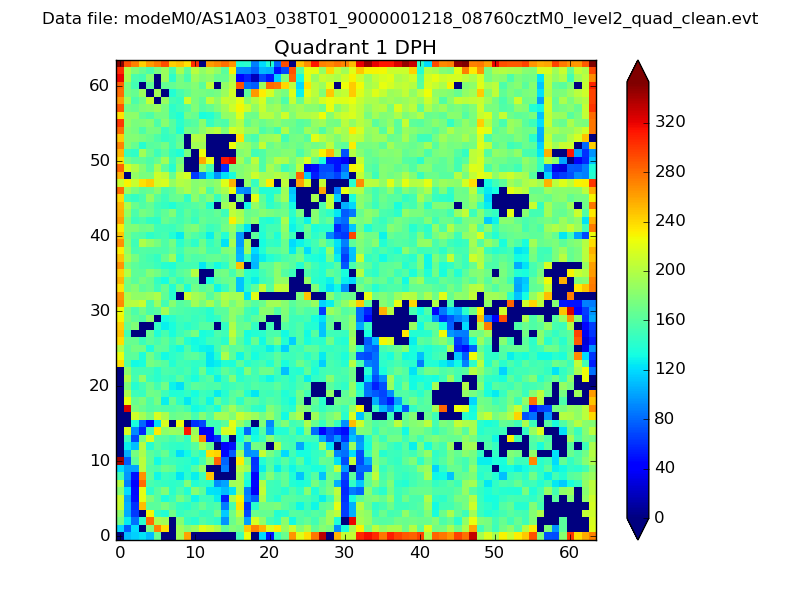 |
Quadrant B |
|---|---|---|---|
| Quadrant D | 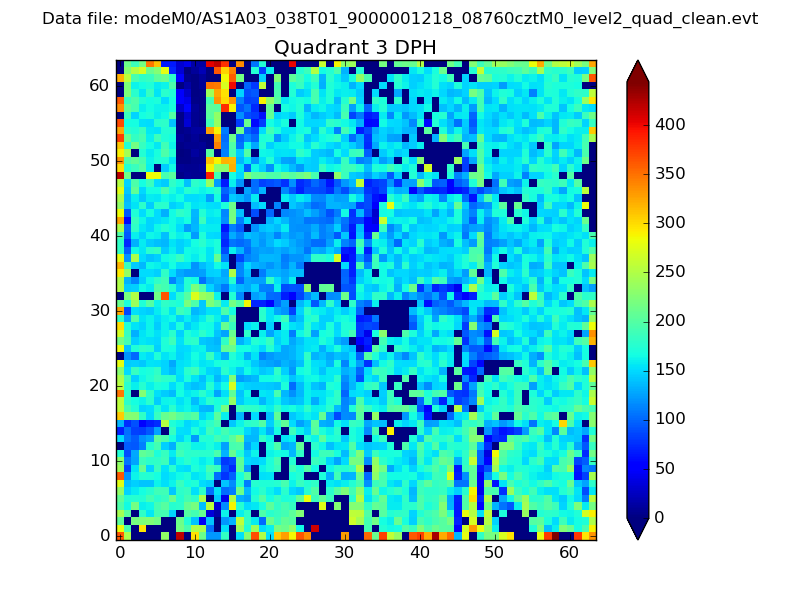 |
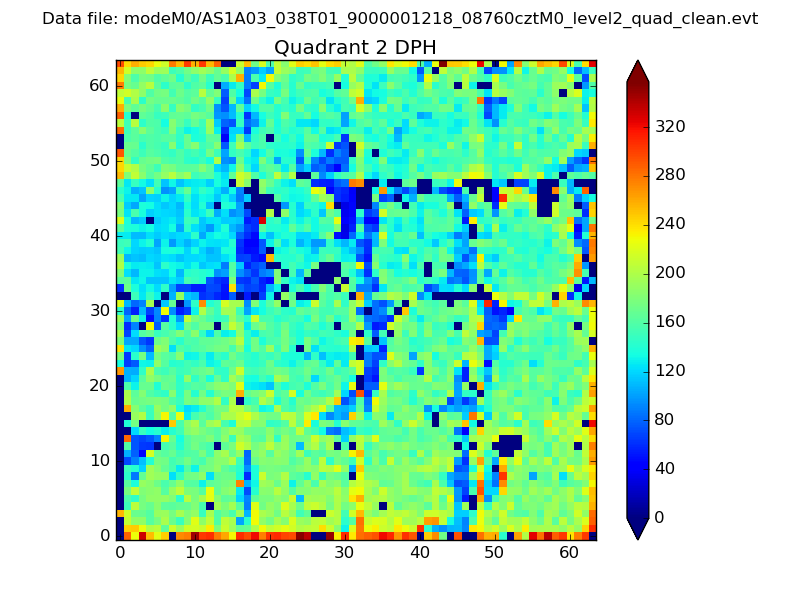 |
Quadrant C |
| Plot type | Count rate plots | Images |
|---|---|---|
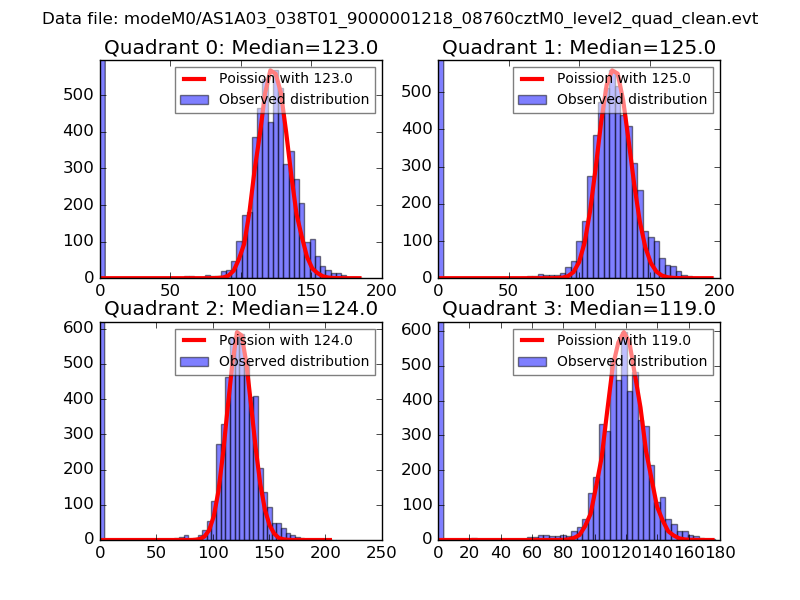
| Comparison with Poisson distribution Blue bars denote a histogram of data divided into 1 sec bins. Red curve is a Poisson curve with rate = median count rate of data. |
 |
 |
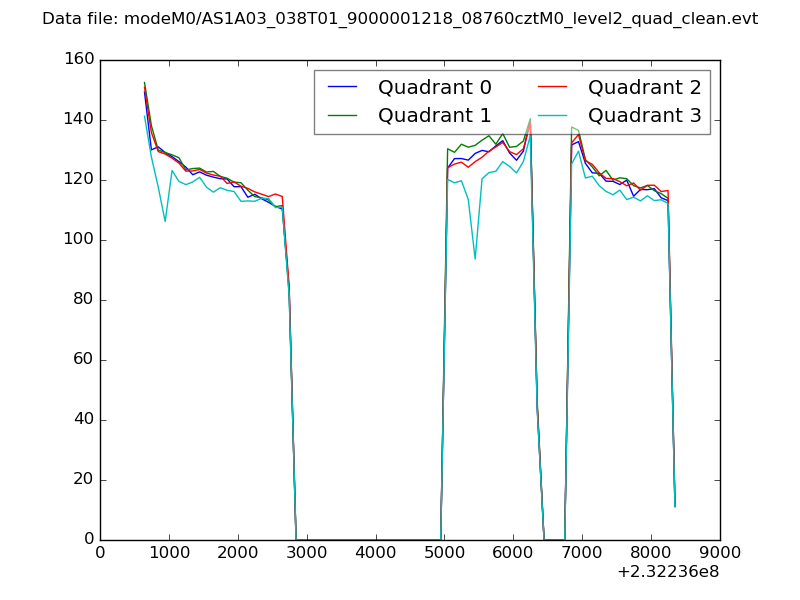
| Quadrant-wise count rates Data is divided into 100 sec bins |
 |
|
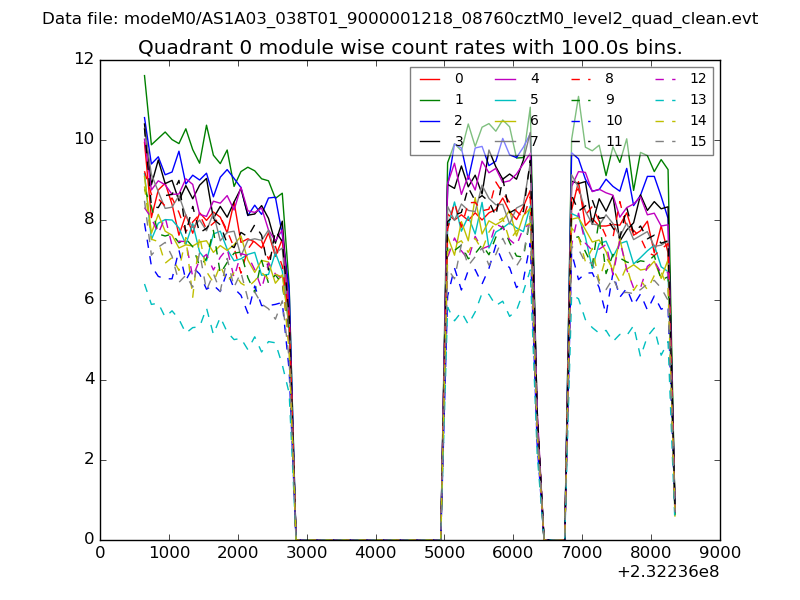
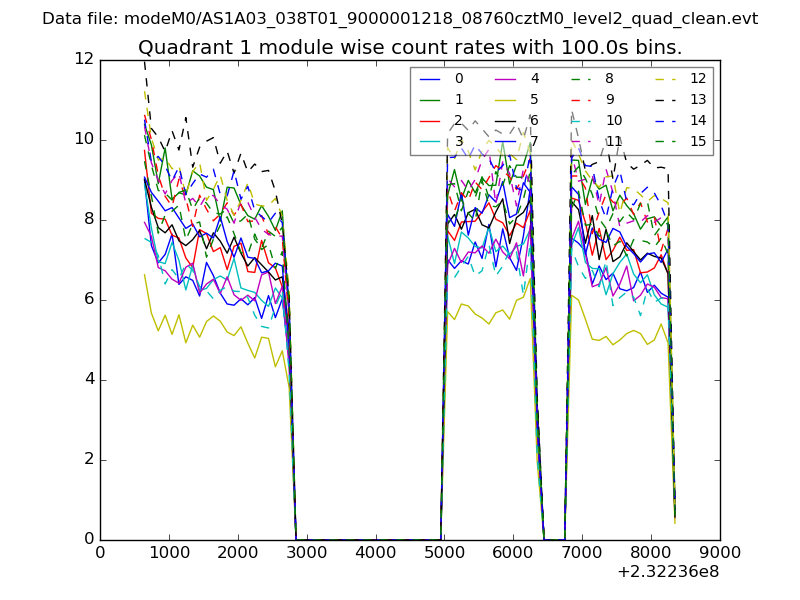
| Module-wise count rates for Quadrant A Data is divided into 100 sec bins |
 |
 |
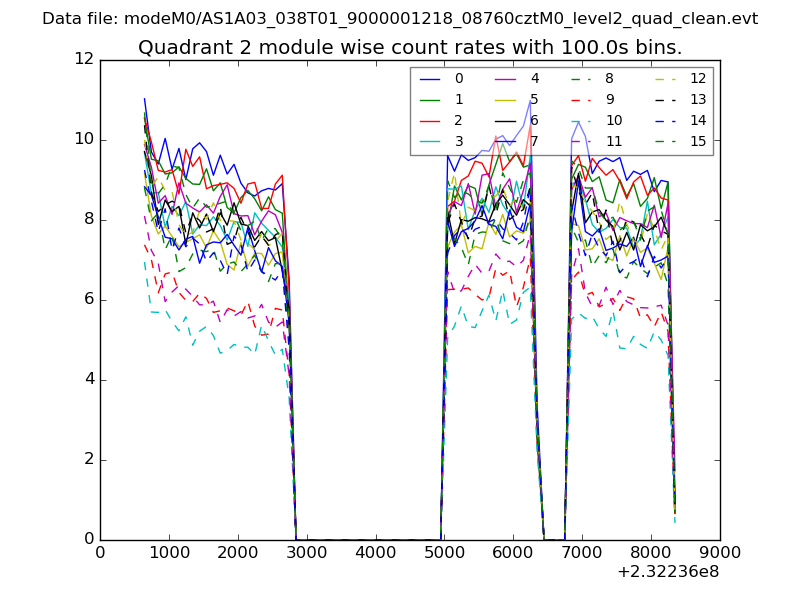
| Module-wise count rates for Quadrant B Data is divided into 100 sec bins |
 |
 |
| Module-wise count rates for Quadrant C Data is divided into 100 sec bins |
 |
 |
| Module-wise count rates for Quadrant D Data is divided into 100 sec bins |
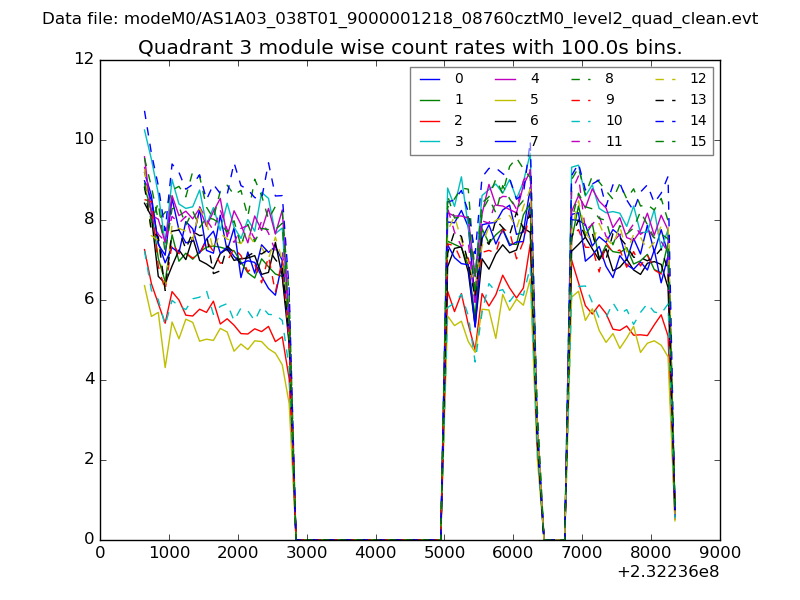 |
 |
| Parameter | Plot |
|---|---|
| CZT HV Monitor | 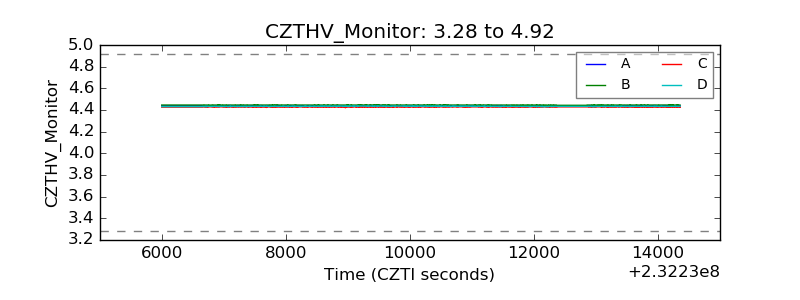 |
| D_VDD | 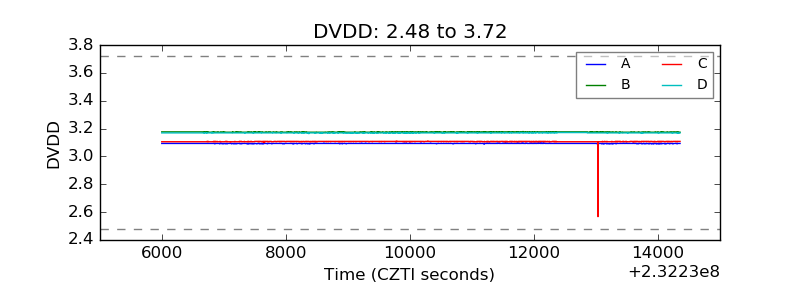 |
| Temperature 1 | 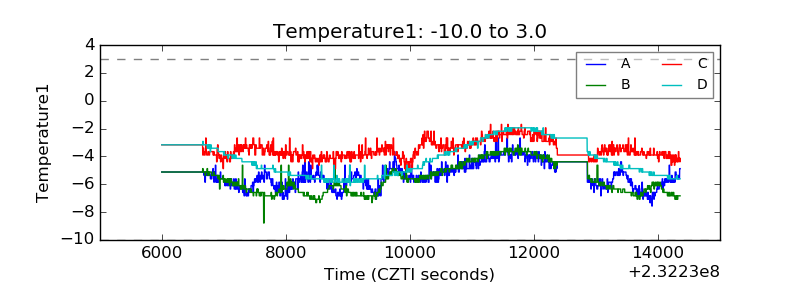 |
| Veto HV Monitor | 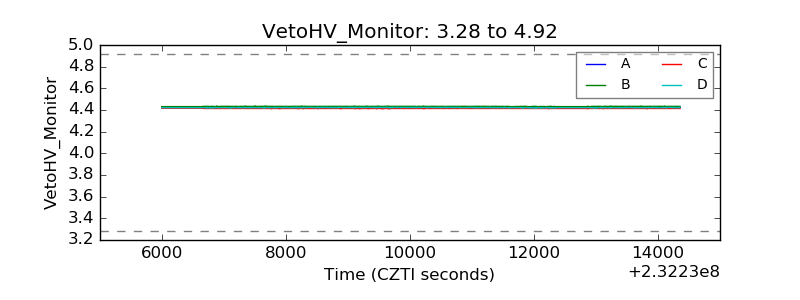 |
| Veto LLD | 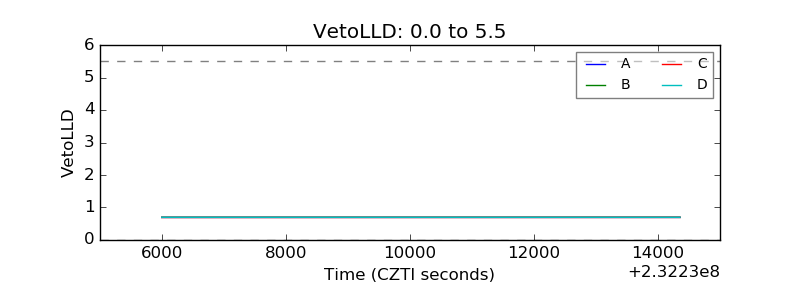 |
| Alpha Counter | 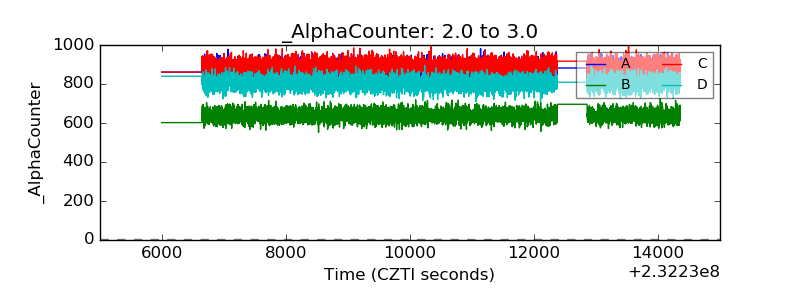 |
| _CPM_Rate | 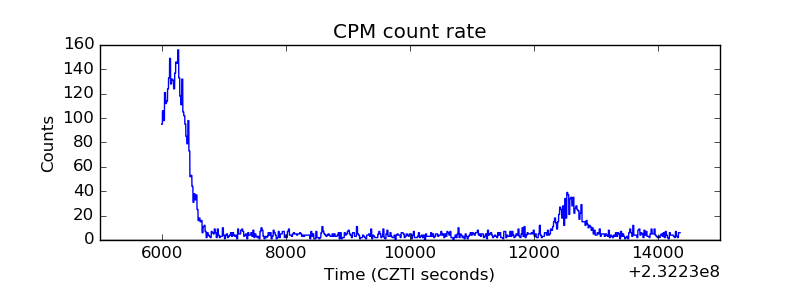 |
| CZT Counter | 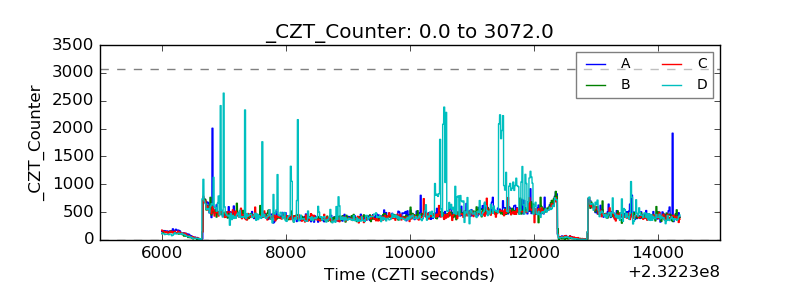 |
| +2.5 Volts monitor |  |
| +5 Volts monitor |  |
| _ROLL_ROT | 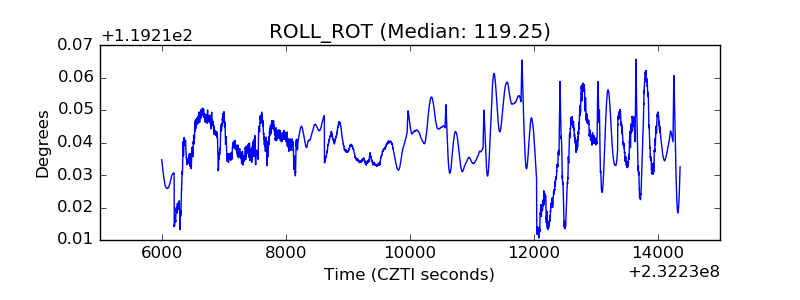 |
| _Roll_DEC | 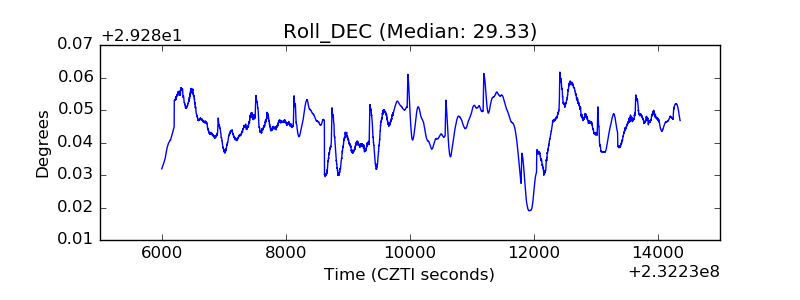 |
| _Roll_RA | 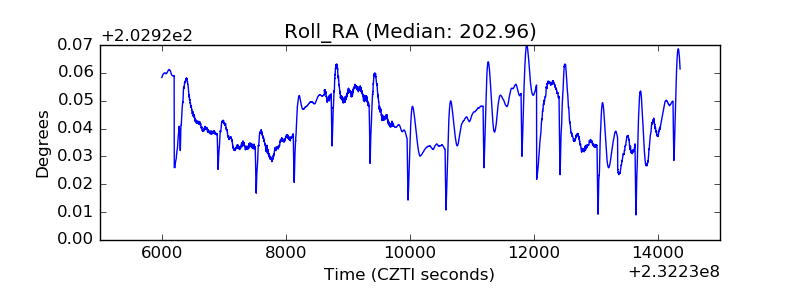 |
| Veto Counter | 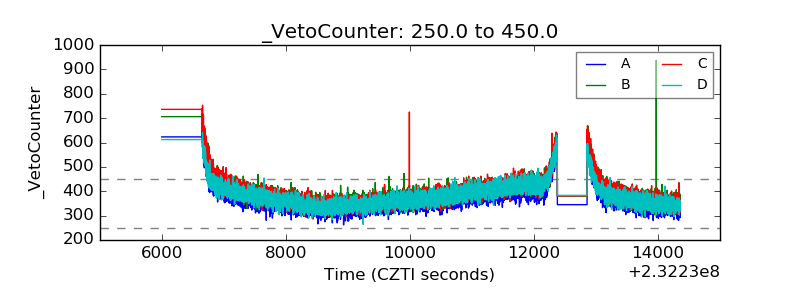 |