| Param | Original file | Final file |
|---|---|---|
| Filename | modeM0/AS1A03_038T01_9000001218_08762cztM0_level2.evt | modeM0/AS1A03_038T01_9000001218_08762cztM0_level2_quad_clean.evt |
| Size (bytes) | 657,017,280 | 117,498,240 |
| Size | 626.6 MB | 112.1 MB |
| Events in quadrant A | 4,168,674 | 739,271 |
| Events in quadrant B | 4,172,444 | 749,634 |
| Events in quadrant C | 4,243,003 | 742,595 |
| Events in quadrant D | 6,712,440 | 711,647 |
| Mode M9 | |||
|---|---|---|---|
| Quadrant | BADHDUFLAG | Total packets | Discarded packets |
| A | 0 | 4 | 0 |
| B | 0 | 4 | 0 |
| C | 0 | 4 | 0 |
| D | 0 | 4 | 0 |
| Mode M0 | |||
|---|---|---|---|
| Quadrant | BADHDUFLAG | Total packets | Discarded packets |
| A | 0 | 18529 | 23 |
| B | 0 | 18497 | 26 |
| C | 0 | 18758 | 21 |
| D | 0 | 26108 | 44 |
| Mode SS | |||
|---|---|---|---|
| Quadrant | BADHDUFLAG | Total packets | Discarded packets |
| A | 0 | 180 | 0 |
| B | 0 | 180 | 0 |
| C | 0 | 180 | 0 |
| D | 0 | 180 | 0 |
| Quadrant | Total seconds | Saturated seconds | Saturation percentage |
|---|---|---|---|
| A | 8869 | 182 | 2.052092% |
| B | 8867 | 215 | 2.424721% |
| C | 8869 | 112 | 1.262826% |
| D | 8869 | 835 | 9.414816% |
Noise dominated data is calculated using 1-second bins in cleaned event files. If a bin has >2000 counts, and if more than 50% of those come from <1% of pixels, then it is considered to be noise-dominated and hence unusable.
| Quadrant | # 1 sec bins | Bins with >0 counts | Bins with >2000 counts | High rate bins dominated by noise | Noise dominated (total time) | Noise dominated (detector-on time) | Marked lightcurve |
|---|---|---|---|---|---|---|---|
| A | 9179 | 8880 | 11 | 11 | 0.12% | 0.12% | 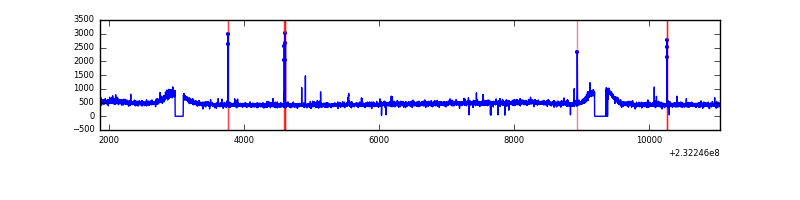 |
| B | 9179 | 8879 | 1 | 1 | 0.01% | 0.01% | 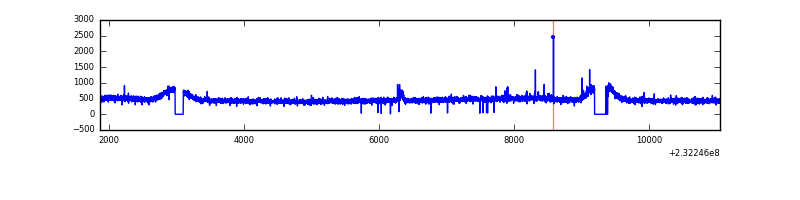 |
| C | 9179 | 8881 | 24 | 24 | 0.26% | 0.27% | 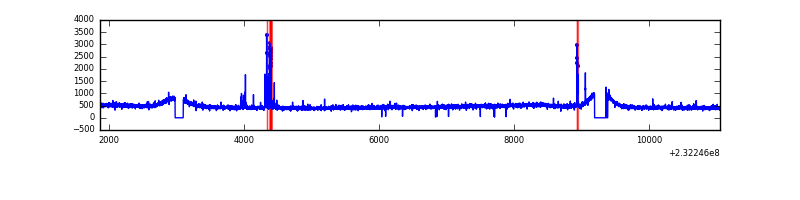 |
| D | 9179 | 8880 | 779 | 779 | 8.49% | 8.77% | 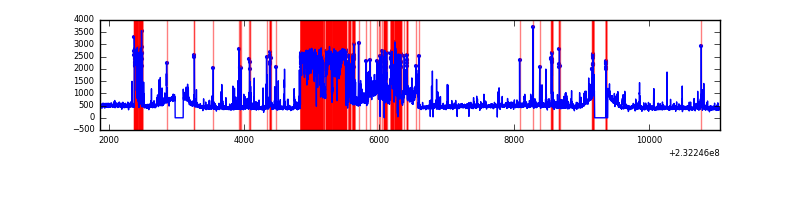 |
Top three noisy pixels from each quadrant. If the there are fewer than three noisy pixels in the level2.evt file, extra rows are filled as -1
| Pixel properties | Quadrant properties | ||||||
|---|---|---|---|---|---|---|---|
| Quadrant | DetID | PixID | Counts | Sigma | Mean | Median | Sigma |
| A | 13 | 251 | 28298 | 125.96 | 1059 | 1033 | 216.5 |
| A | 5 | 16 | 27353 | 121.6 | 1059 | 1033 | 216.5 |
| A | 13 | 248 | 25150 | 111.42 | 1059 | 1033 | 216.5 |
| B | 12 | 111 | 23675 | 108.92 | 1064 | 1037 | 207.8 |
| B | 4 | 80 | 23513 | 108.14 | 1064 | 1037 | 207.8 |
| B | 11 | 111 | 19288 | 87.81 | 1064 | 1037 | 207.8 |
| C | 9 | 54 | 110753 | 449.84 | 1040 | 1044 | 243.9 |
| C | 14 | 234 | 23095 | 90.42 | 1040 | 1044 | 243.9 |
| C | 8 | 128 | 16638 | 63.94 | 1040 | 1044 | 243.9 |
| D | 2 | 152 | 2434531 | 9585.74 | 1000 | 974 | 253.9 |
| D | 1 | 52 | 374109 | 1469.77 | 1000 | 974 | 253.9 |
| D | 2 | 14 | 37312 | 143.13 | 1000 | 974 | 253.9 |
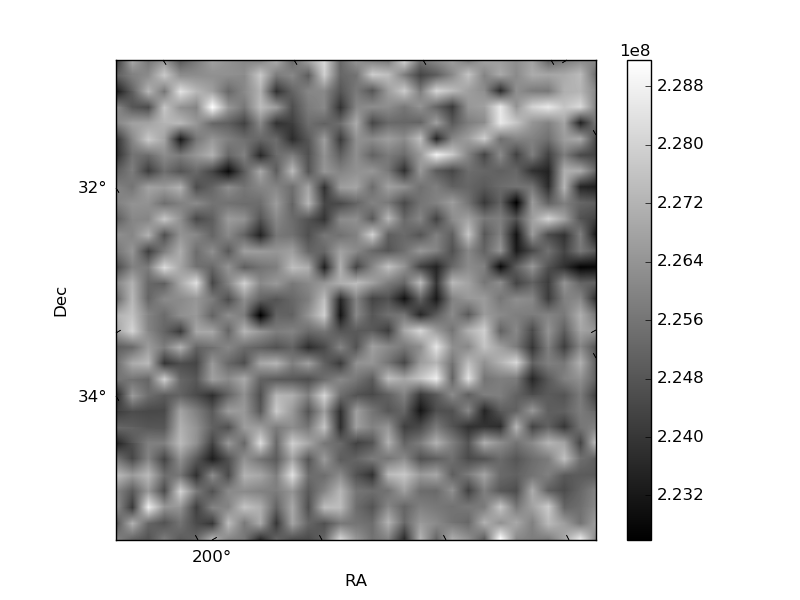
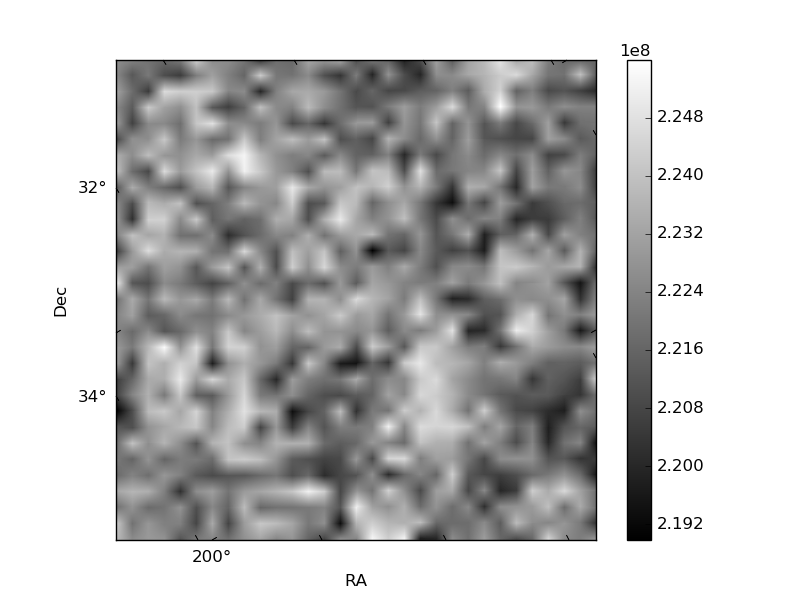
Histogram calculated using DETX and DETY for each event in the final _common_clean file
| Quadrant A | 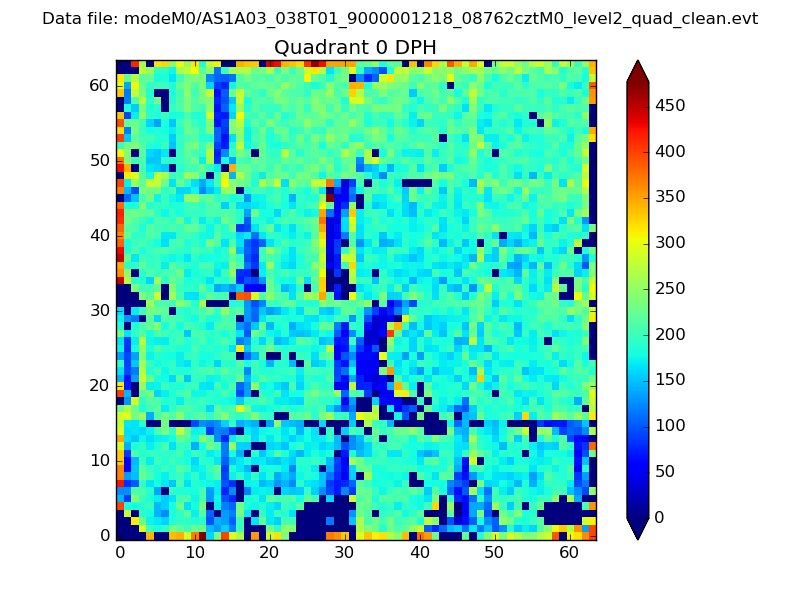 |
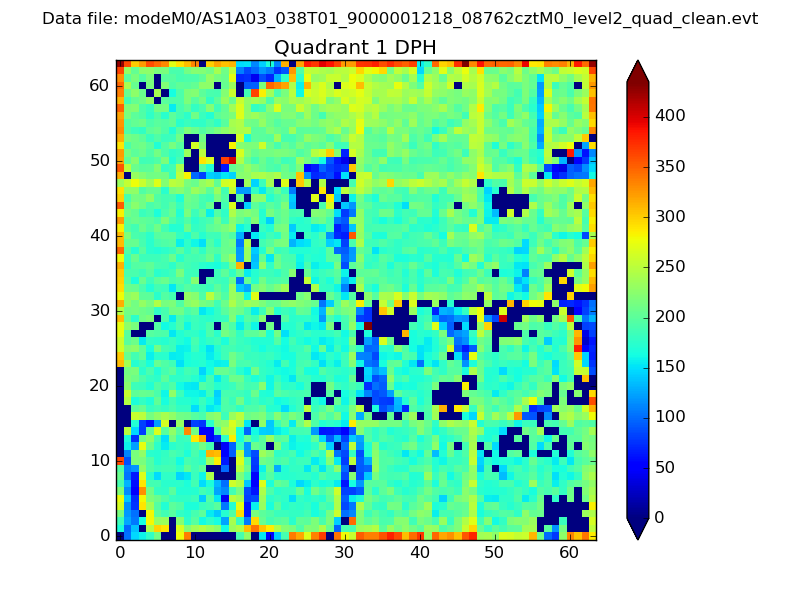 |
Quadrant B |
|---|---|---|---|
| Quadrant D | 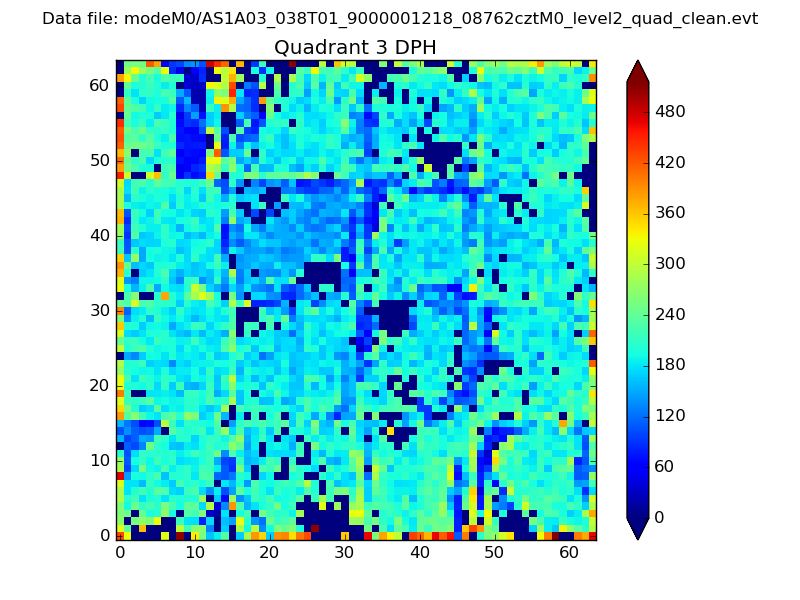 |
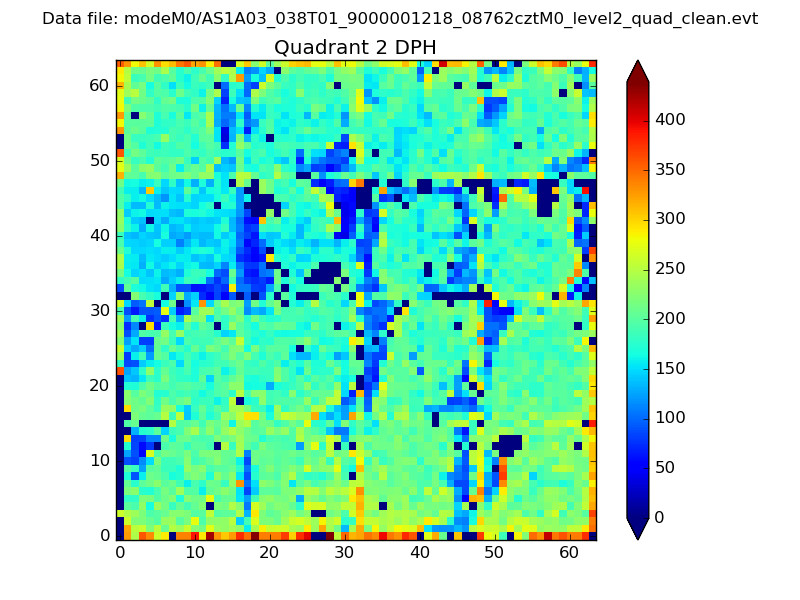 |
Quadrant C |
| Plot type | Count rate plots | Images |
|---|---|---|
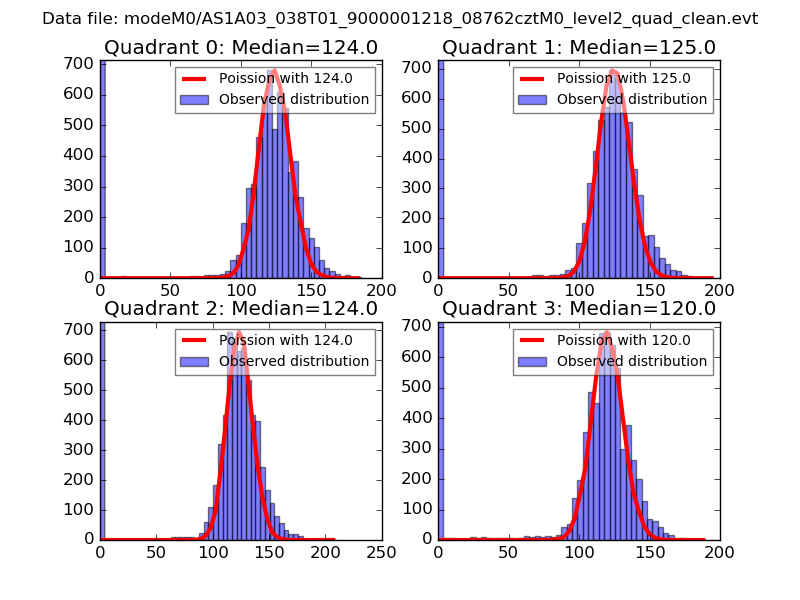
| Comparison with Poisson distribution Blue bars denote a histogram of data divided into 1 sec bins. Red curve is a Poisson curve with rate = median count rate of data. |
 |
 |
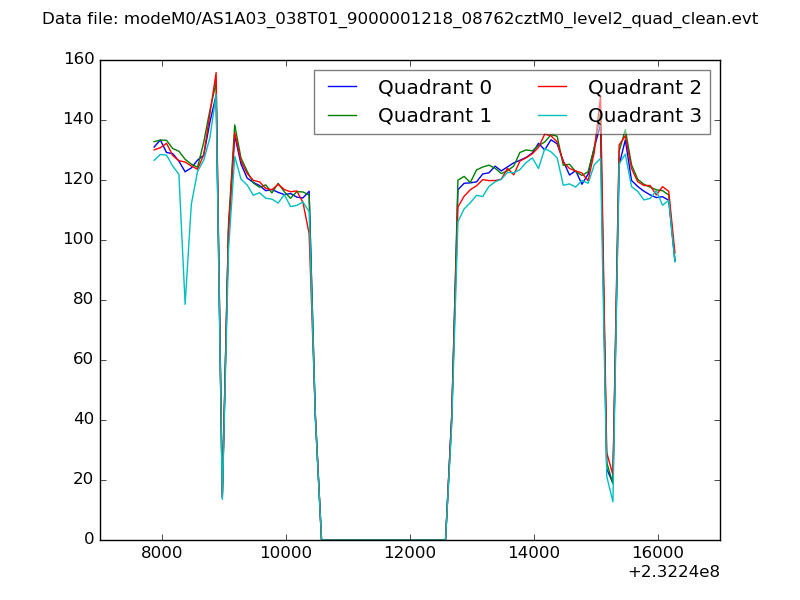
| Quadrant-wise count rates Data is divided into 100 sec bins |
 |
|
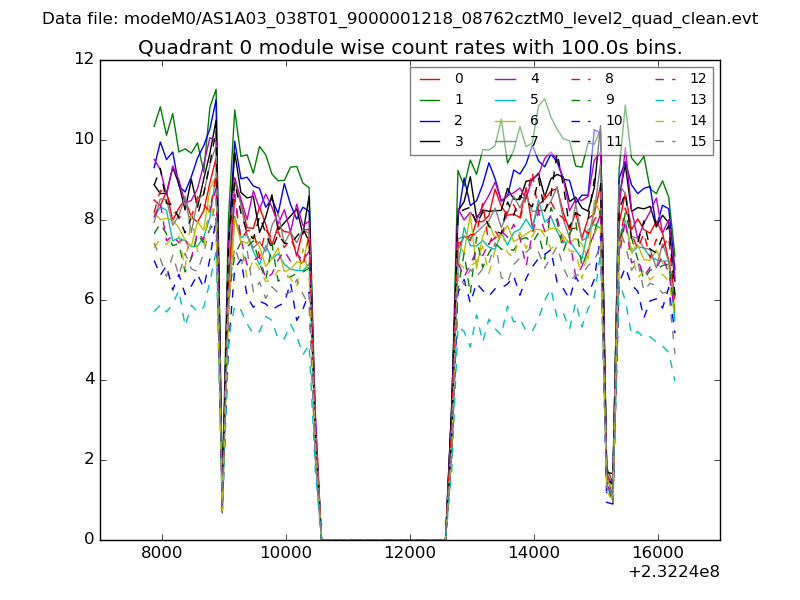
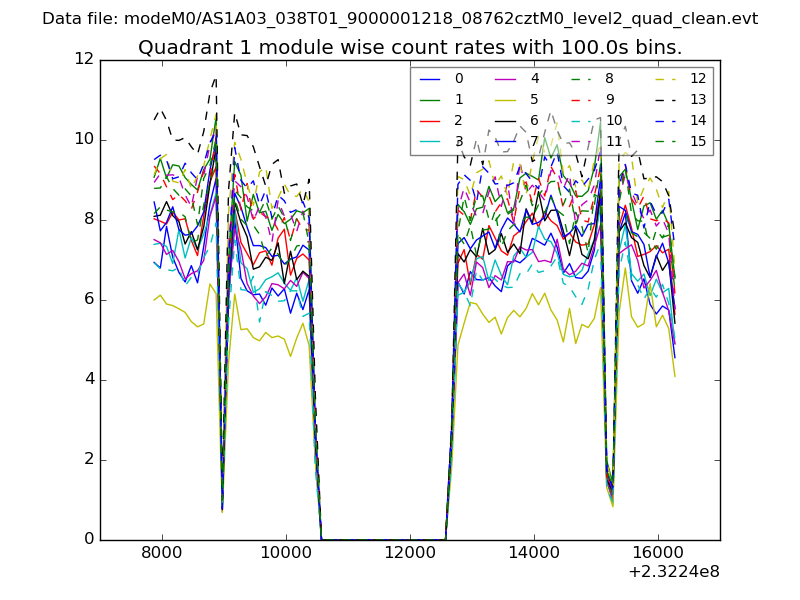
| Module-wise count rates for Quadrant A Data is divided into 100 sec bins |
 |
 |
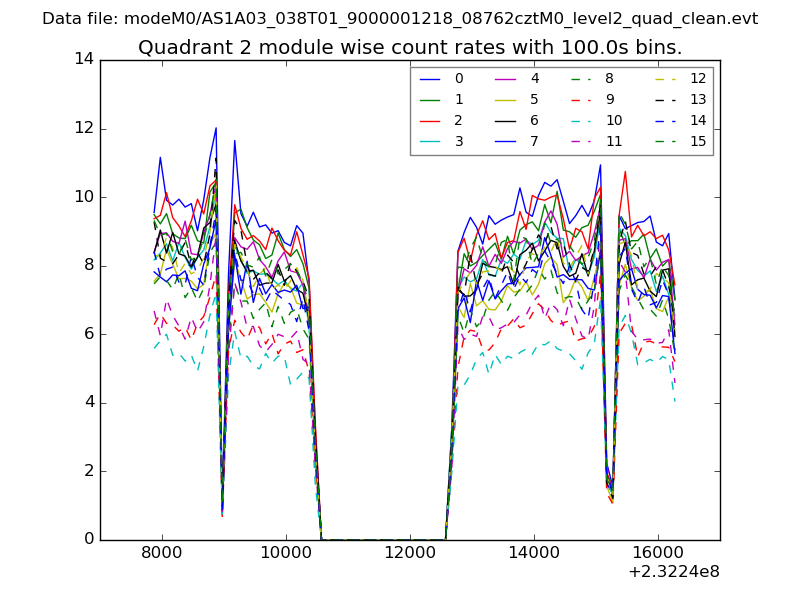
| Module-wise count rates for Quadrant B Data is divided into 100 sec bins |
 |
 |
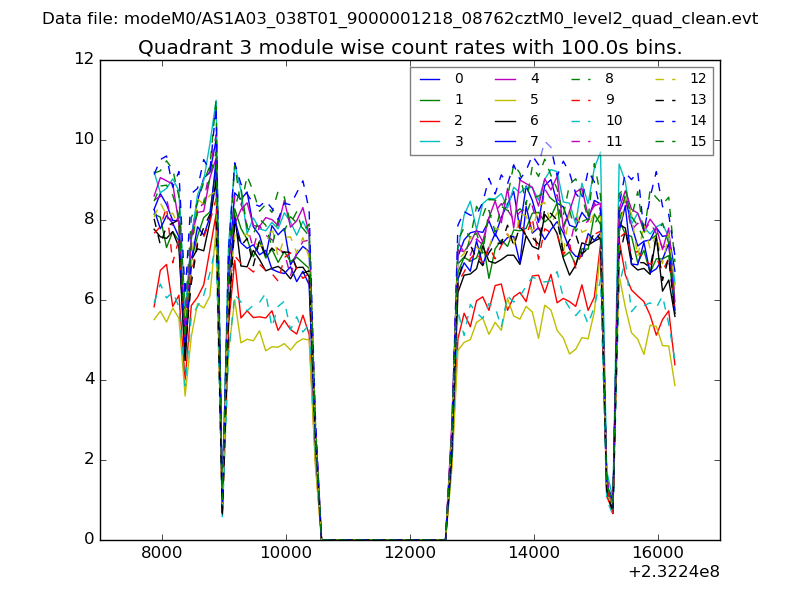
| Module-wise count rates for Quadrant C Data is divided into 100 sec bins |
 |
 |
| Module-wise count rates for Quadrant D Data is divided into 100 sec bins |
 |
 |
| Parameter | Plot |
|---|---|
| CZT HV Monitor | 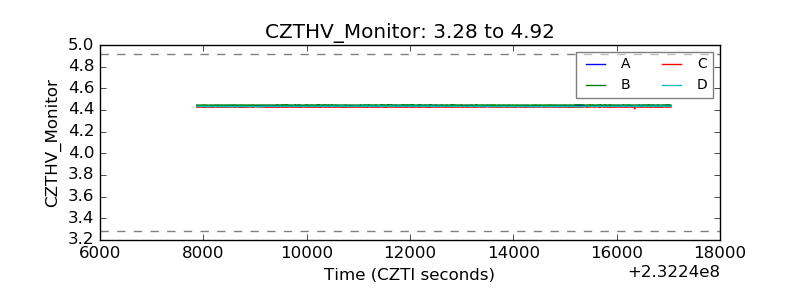 |
| D_VDD | 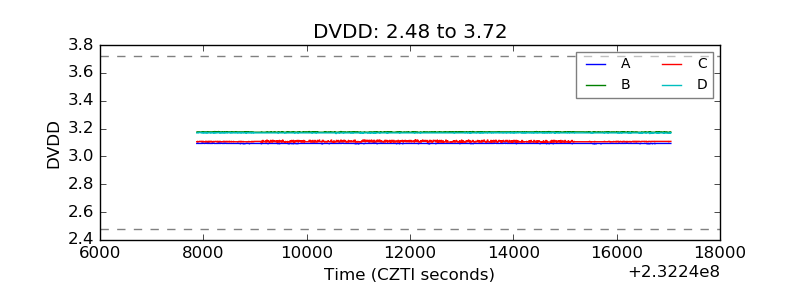 |
| Temperature 1 | 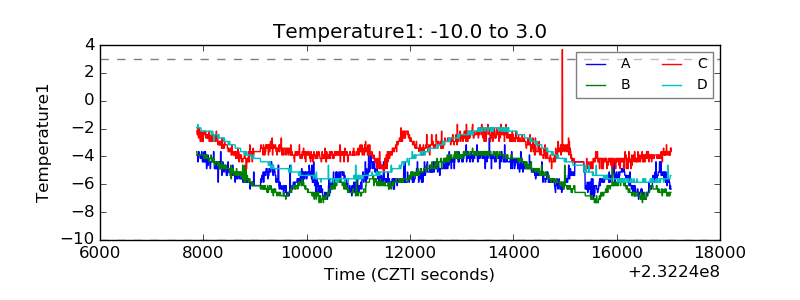 |
| Veto HV Monitor | 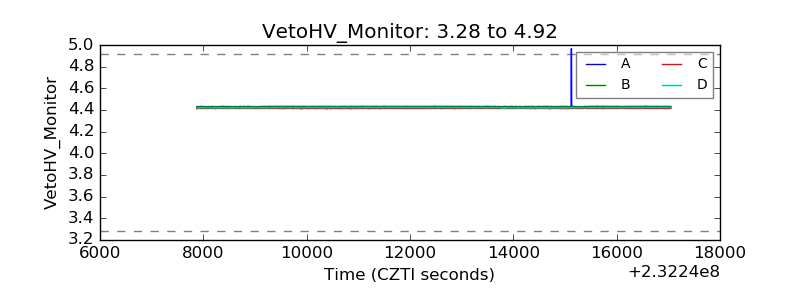 |
| Veto LLD | 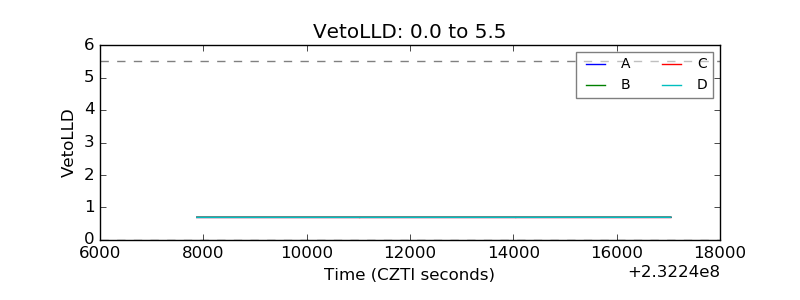 |
| Alpha Counter | 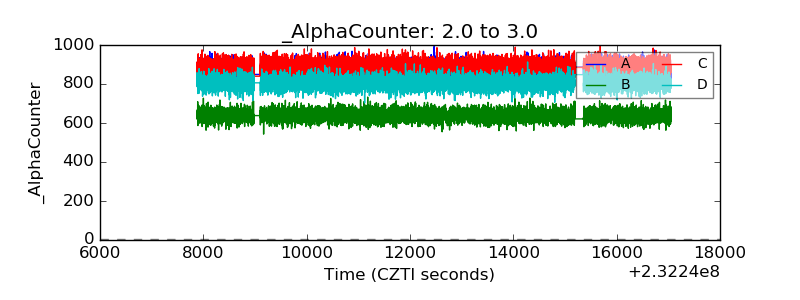 |
| _CPM_Rate | 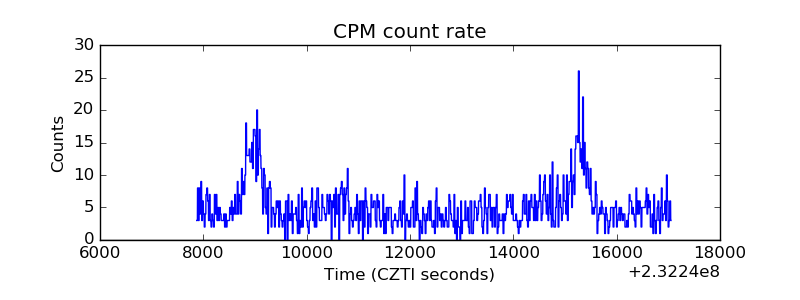 |
| CZT Counter | 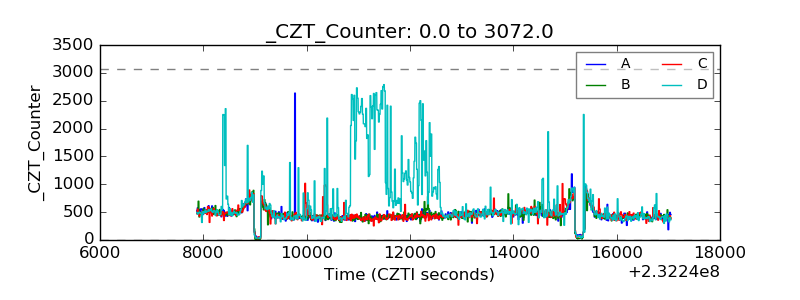 |
| +2.5 Volts monitor |  |
| +5 Volts monitor |  |
| _ROLL_ROT | 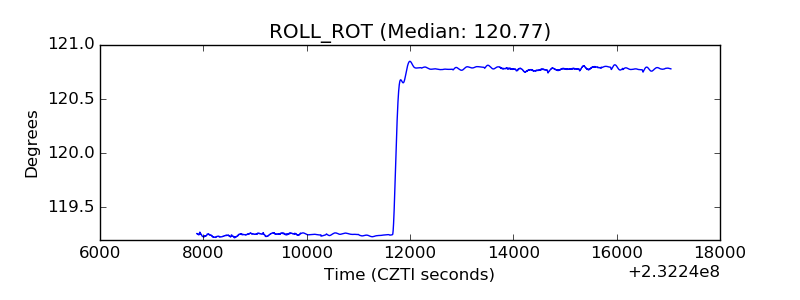 |
| _Roll_DEC | 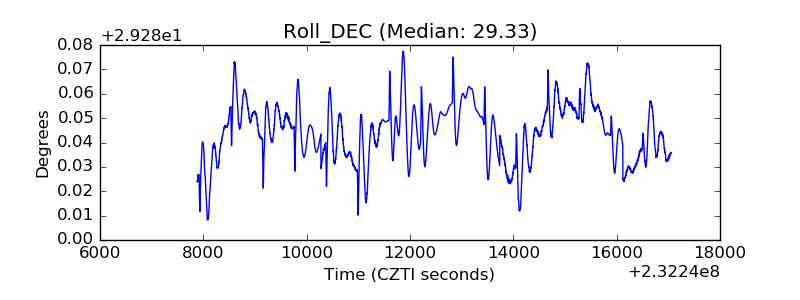 |
| _Roll_RA | 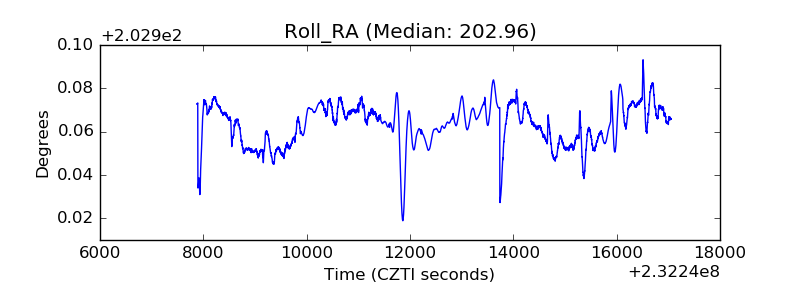 |
| Veto Counter | 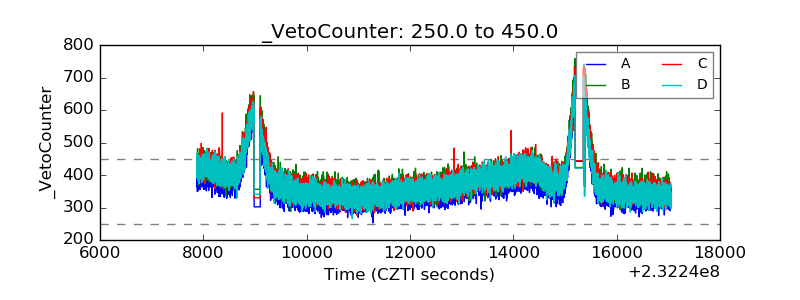 |