| Param | Original file | Final file |
|---|---|---|
| Filename | modeM0/AS1A03_038T01_9000001218_08764cztM0_level2.evt | modeM0/AS1A03_038T01_9000001218_08764cztM0_level2_quad_clean.evt |
| Size (bytes) | 621,558,720 | 102,807,360 |
| Size | 592.8 MB | 98.0 MB |
| Events in quadrant A | 4,453,075 | 618,138 |
| Events in quadrant B | 4,438,898 | 628,666 |
| Events in quadrant C | 4,261,458 | 622,636 |
| Events in quadrant D | 5,029,796 | 589,448 |
| Mode M9 | |||
|---|---|---|---|
| Quadrant | BADHDUFLAG | Total packets | Discarded packets |
| A | 0 | 6 | 0 |
| B | 0 | 6 | 0 |
| C | 0 | 6 | 0 |
| D | 0 | 6 | 0 |
| Mode M0 | |||
|---|---|---|---|
| Quadrant | BADHDUFLAG | Total packets | Discarded packets |
| A | 0 | 19985 | 352 |
| B | 0 | 20029 | 341 |
| C | 0 | 19837 | 366 |
| D | 0 | 22305 | 591 |
| Mode SS | |||
|---|---|---|---|
| Quadrant | BADHDUFLAG | Total packets | Discarded packets |
| A | 0 | 196 | 2 |
| B | 0 | 196 | 6 |
| C | 0 | 196 | 4 |
| D | 0 | 196 | 0 |
| Quadrant | Total seconds | Saturated seconds | Saturation percentage |
|---|---|---|---|
| A | 9434 | 222 | 2.353191% |
| B | 9439 | 272 | 2.881661% |
| C | 9426 | 131 | 1.389773% |
| D | 9414 | 332 | 3.526662% |
Noise dominated data is calculated using 1-second bins in cleaned event files. If a bin has >2000 counts, and if more than 50% of those come from <1% of pixels, then it is considered to be noise-dominated and hence unusable.
| Quadrant | # 1 sec bins | Bins with >0 counts | Bins with >2000 counts | High rate bins dominated by noise | Noise dominated (total time) | Noise dominated (detector-on time) | Marked lightcurve |
|---|---|---|---|---|---|---|---|
| A | 10194 | 9586 | 6 | 6 | 0.06% | 0.06% | 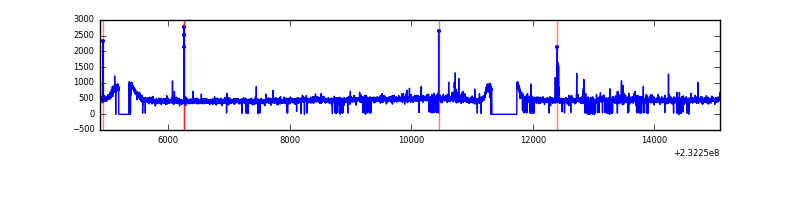 |
| B | 10194 | 9590 | 15 | 15 | 0.15% | 0.16% | 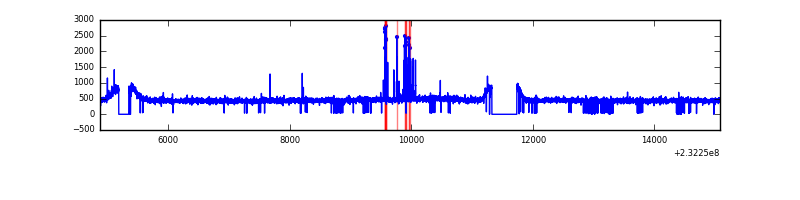 |
| C | 10194 | 9588 | 3 | 3 | 0.03% | 0.03% | 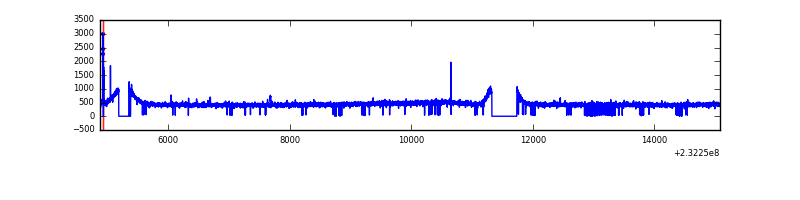 |
| D | 10194 | 9554 | 140 | 140 | 1.37% | 1.47% | 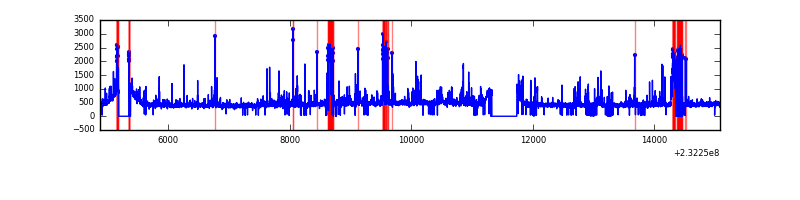 |
Top three noisy pixels from each quadrant. If the there are fewer than three noisy pixels in the level2.evt file, extra rows are filled as -1
| Pixel properties | Quadrant properties | ||||||
|---|---|---|---|---|---|---|---|
| Quadrant | DetID | PixID | Counts | Sigma | Mean | Median | Sigma |
| A | 13 | 251 | 114888 | 497.75 | 1111 | 1085 | 228.6 |
| A | 5 | 16 | 26113 | 109.47 | 1111 | 1085 | 228.6 |
| A | 13 | 248 | 18558 | 76.42 | 1111 | 1085 | 228.6 |
| B | 10 | 16 | 95367 | 433.22 | 1113 | 1084 | 217.6 |
| B | 12 | 111 | 24999 | 109.89 | 1113 | 1084 | 217.6 |
| B | 11 | 111 | 20258 | 88.1 | 1113 | 1084 | 217.6 |
| C | 14 | 234 | 21683 | 81.37 | 1080 | 1083 | 253.2 |
| C | 9 | 54 | 9287 | 32.41 | 1080 | 1083 | 253.2 |
| C | 13 | 61 | 8114 | 27.77 | 1080 | 1083 | 253.2 |
| D | 13 | 122 | 299267 | 1106.41 | 1057 | 1029 | 269.6 |
| D | 1 | 52 | 286473 | 1058.94 | 1057 | 1029 | 269.6 |
| D | 2 | 16 | 253579 | 936.91 | 1057 | 1029 | 269.6 |
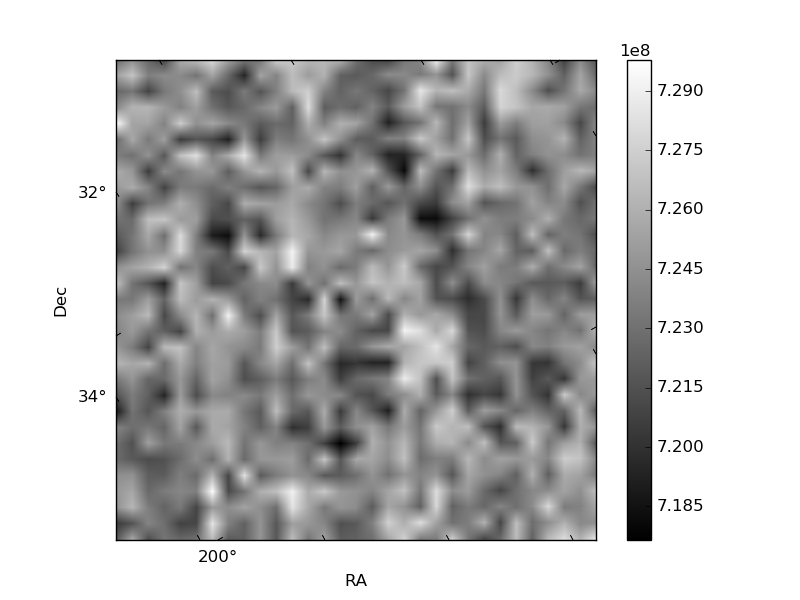
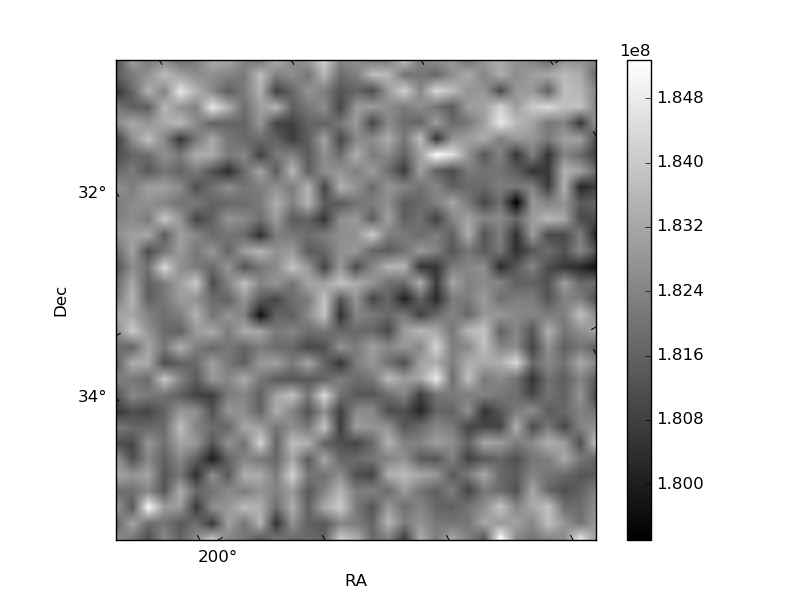
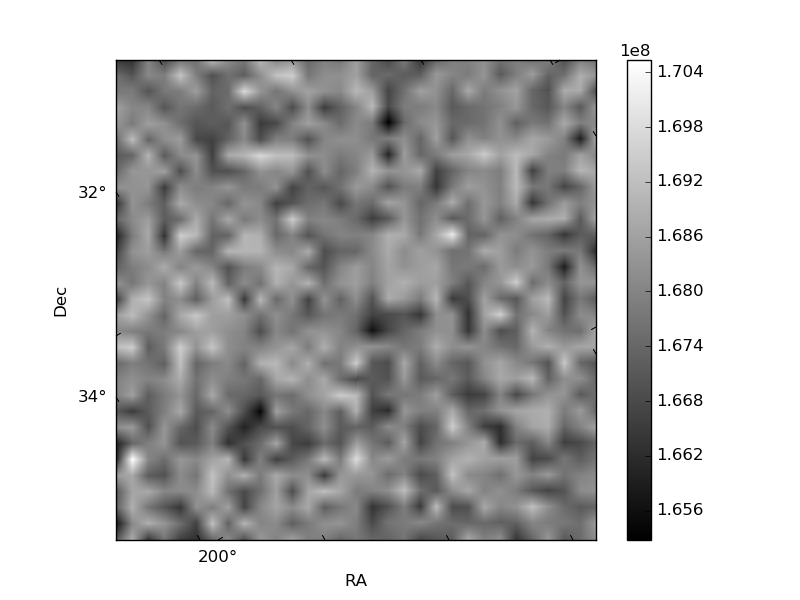
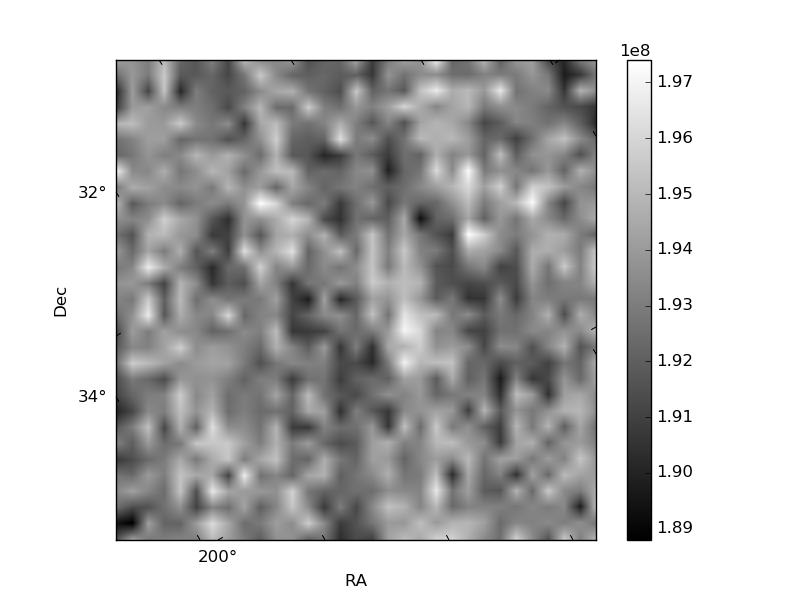
Histogram calculated using DETX and DETY for each event in the final _common_clean file
| Quadrant A | 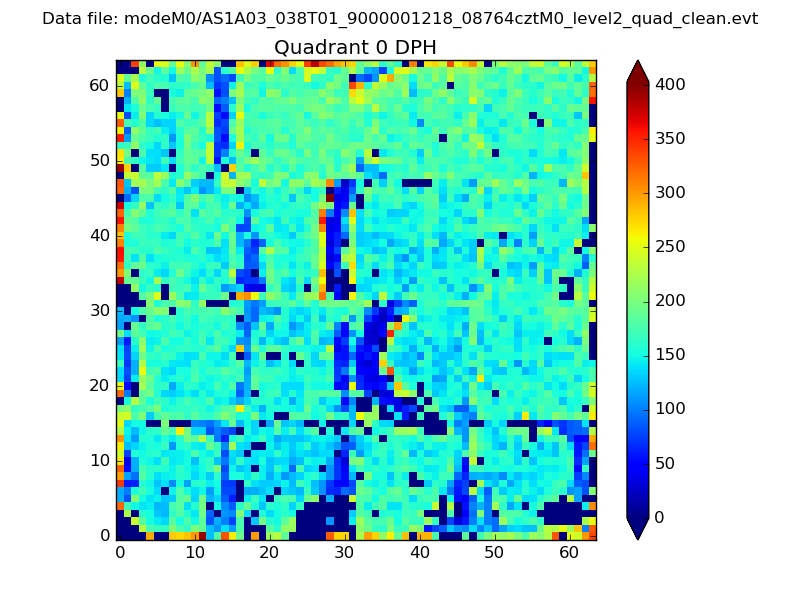 |
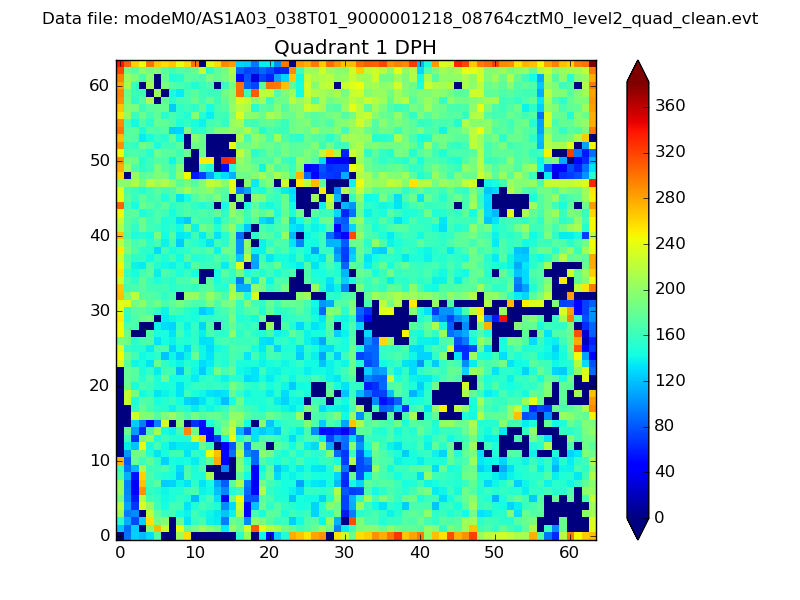 |
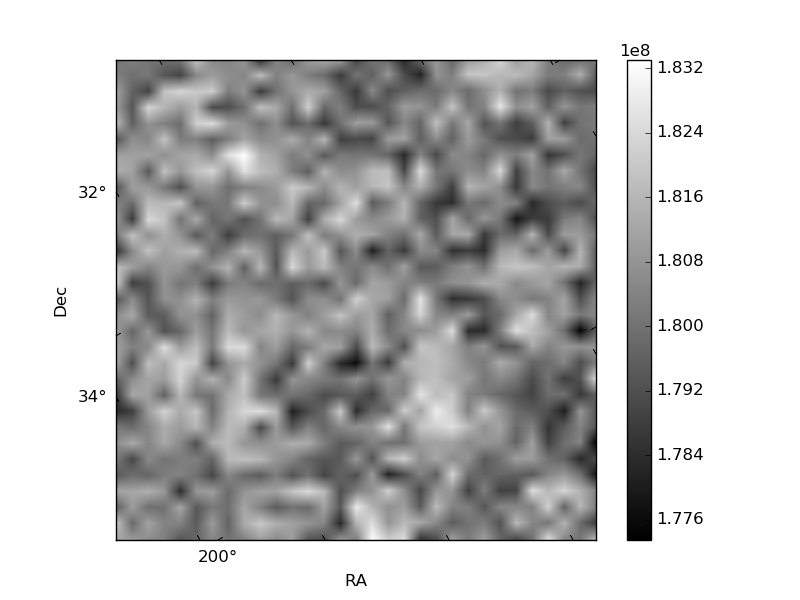
Quadrant B |
|---|---|---|---|
| Quadrant D | 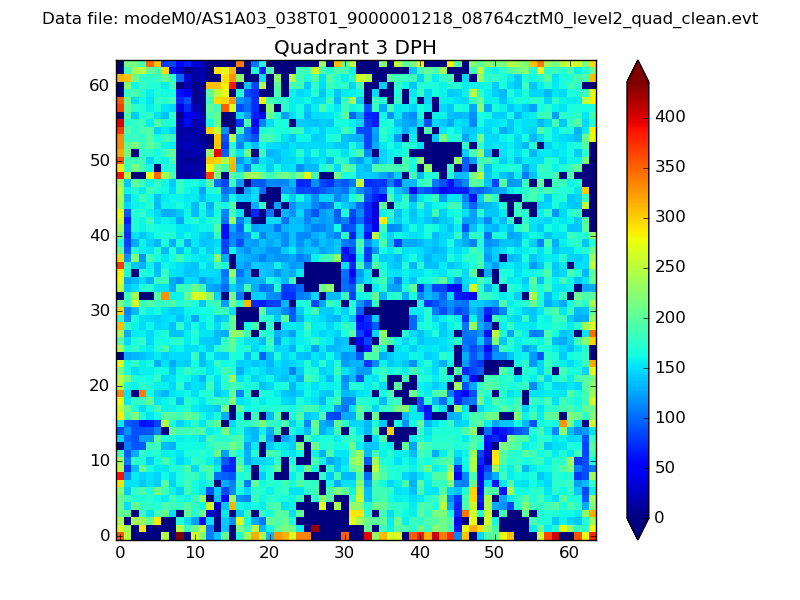 |
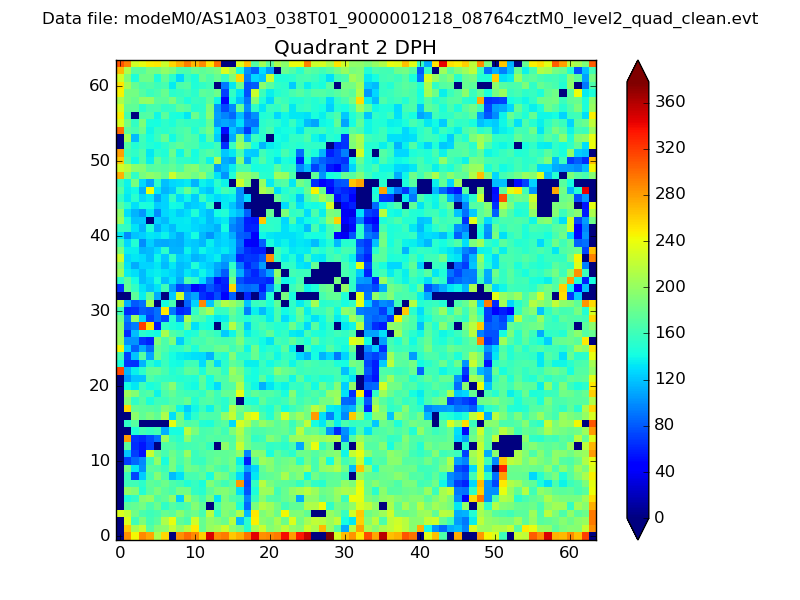 |
Quadrant C |
| Plot type | Count rate plots | Images |
|---|---|---|
| Comparison with Poisson distribution Blue bars denote a histogram of data divided into 1 sec bins. Red curve is a Poisson curve with rate = median count rate of data. |
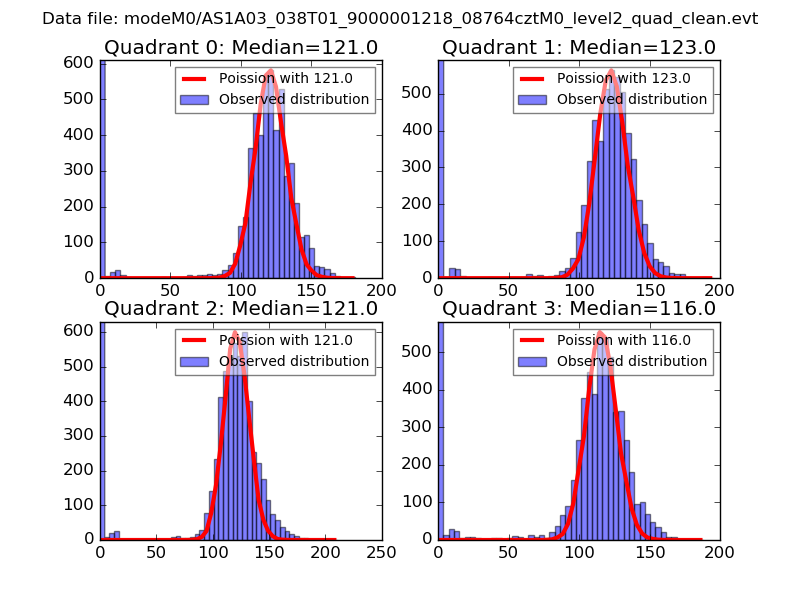 |
 |
| Quadrant-wise count rates Data is divided into 100 sec bins |
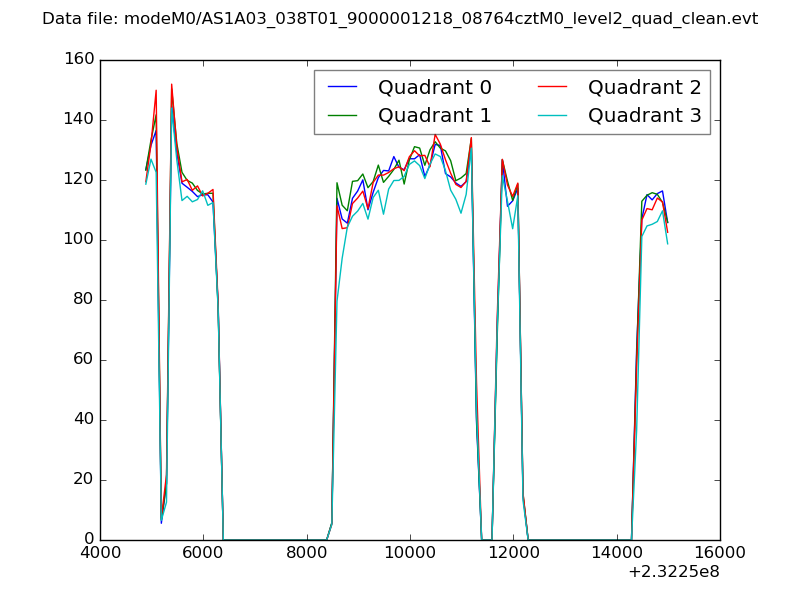 |
|
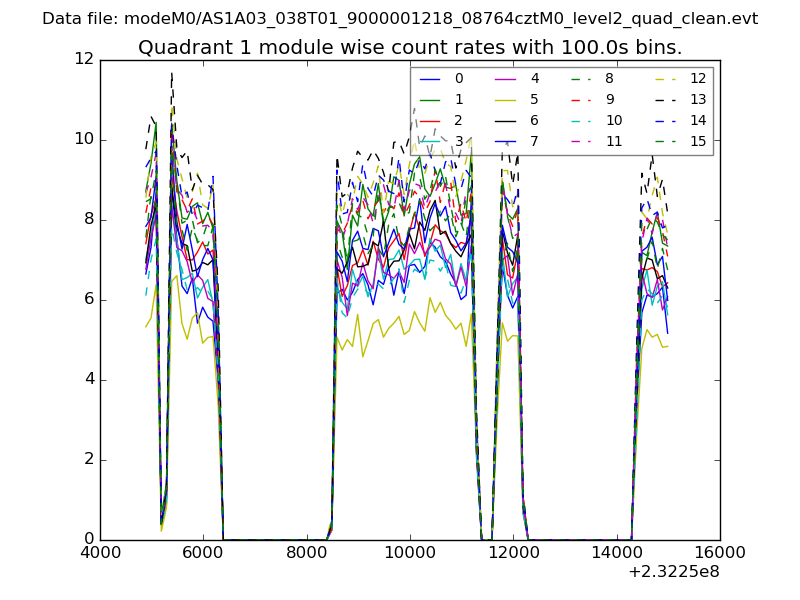
| Module-wise count rates for Quadrant A Data is divided into 100 sec bins |
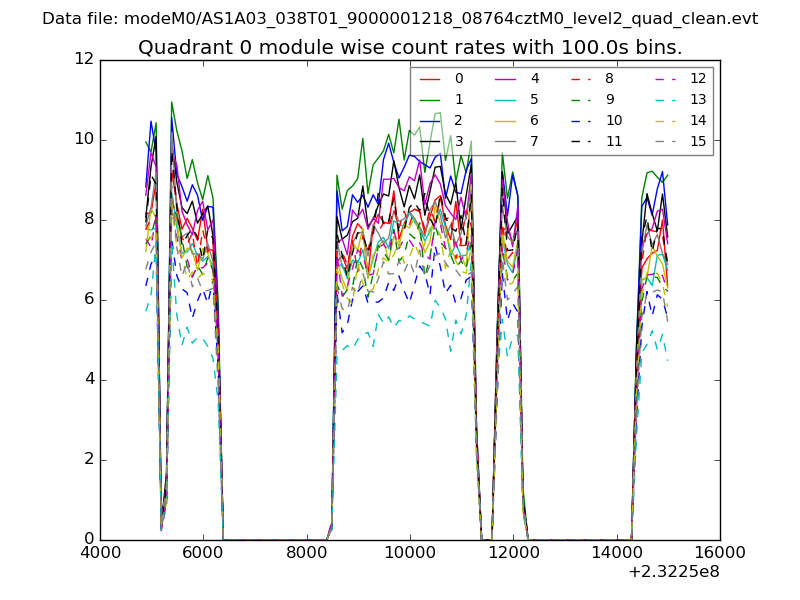 |
 |
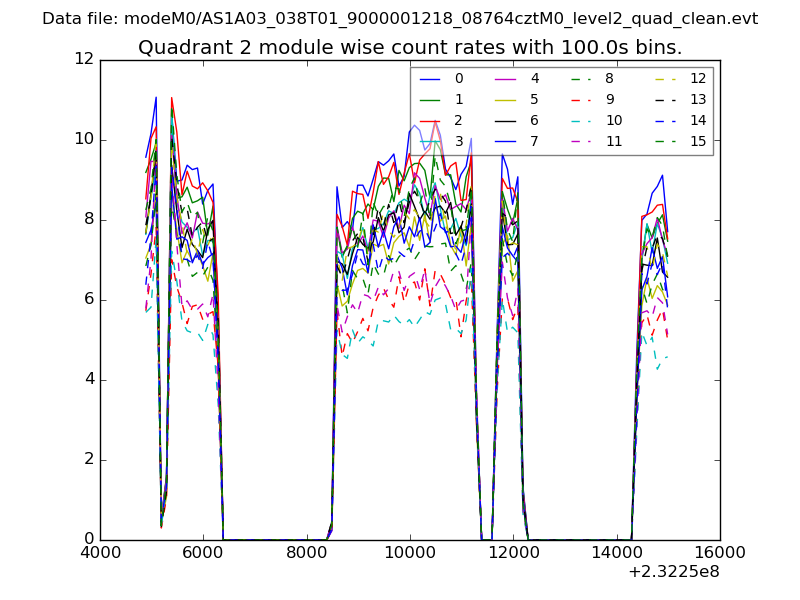
| Module-wise count rates for Quadrant B Data is divided into 100 sec bins |
 |
 |
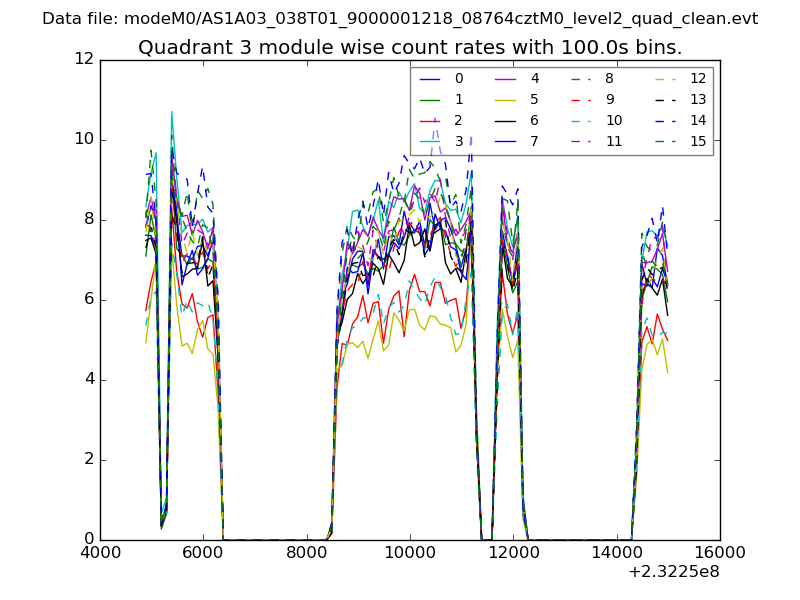
| Module-wise count rates for Quadrant C Data is divided into 100 sec bins |
 |
 |
| Module-wise count rates for Quadrant D Data is divided into 100 sec bins |
 |
 |
| Parameter | Plot |
|---|---|
| CZT HV Monitor | 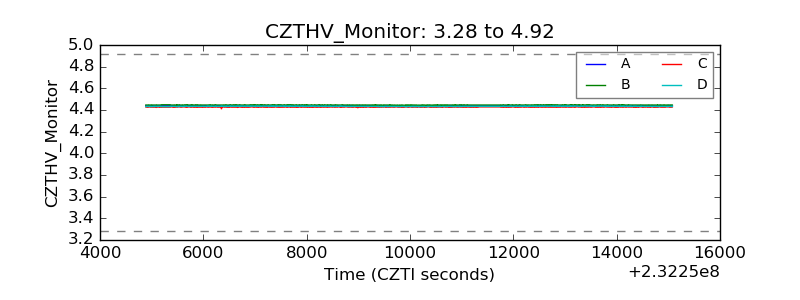 |
| D_VDD | 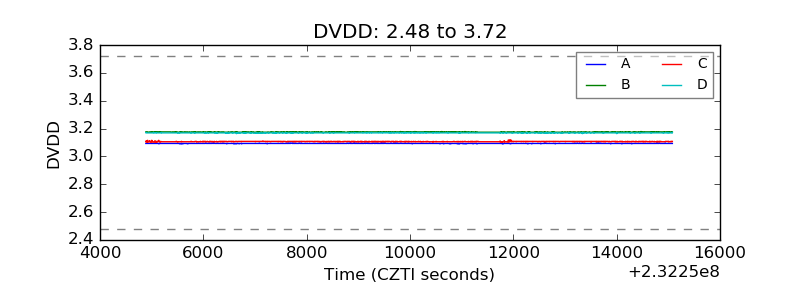 |
| Temperature 1 | 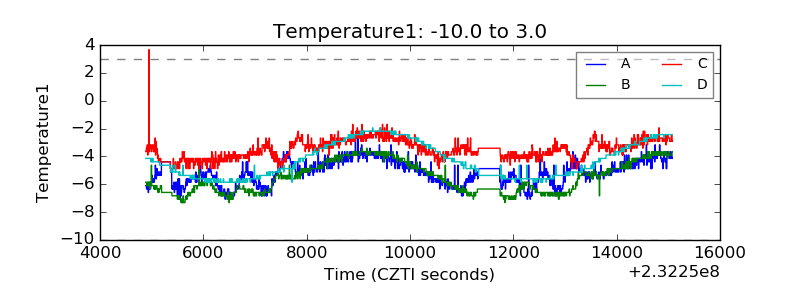 |
| Veto HV Monitor | 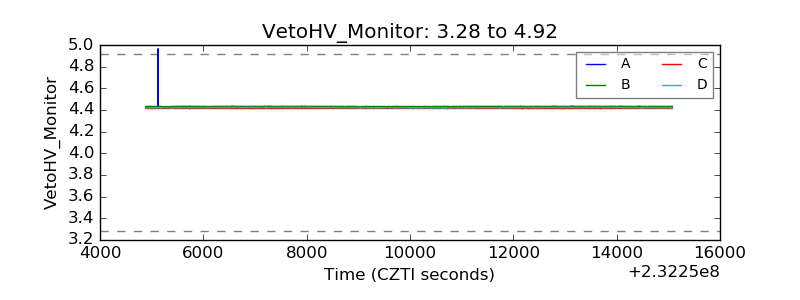 |
| Veto LLD | 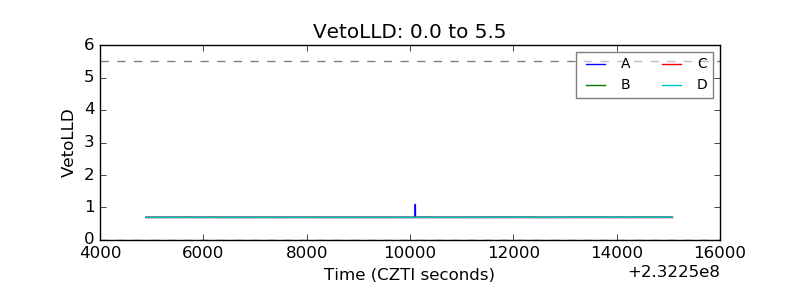 |
| Alpha Counter | 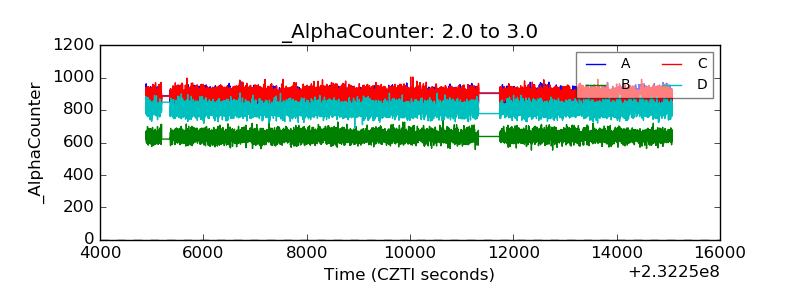 |
| _CPM_Rate | 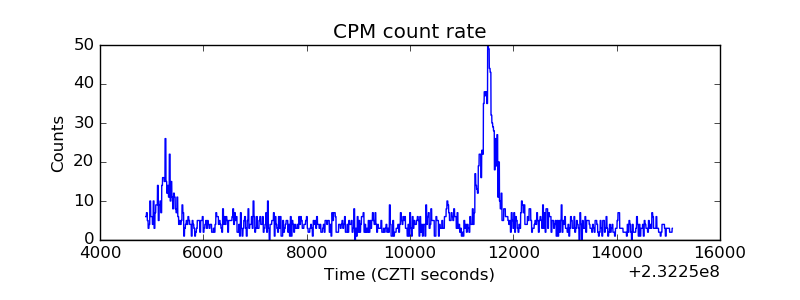 |
| CZT Counter | 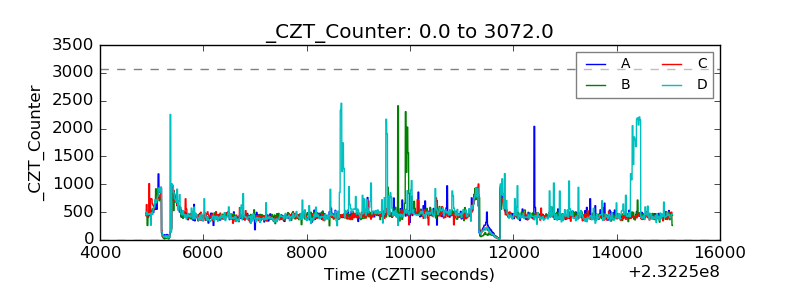 |
| +2.5 Volts monitor |  |
| +5 Volts monitor |  |
| _ROLL_ROT | 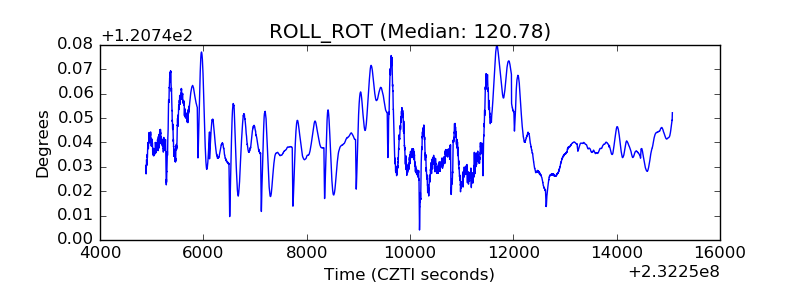 |
| _Roll_DEC | 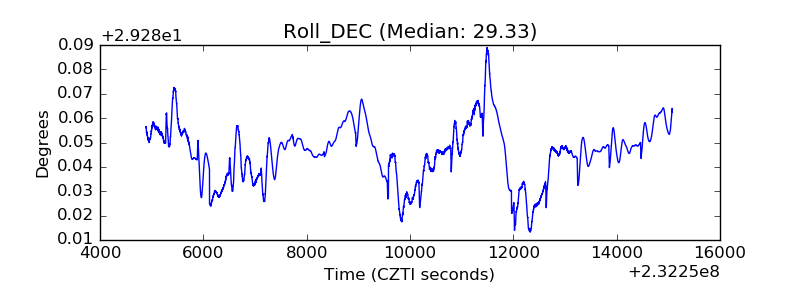 |
| _Roll_RA | 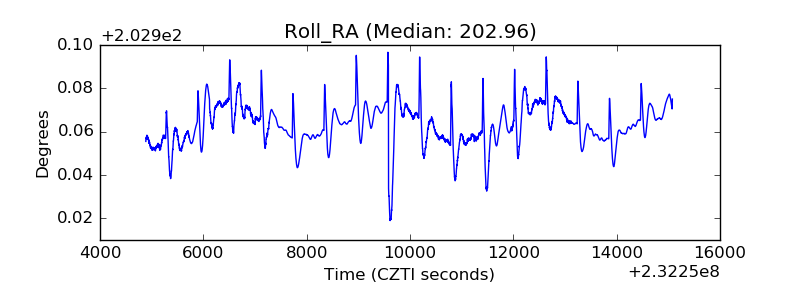 |
| Veto Counter | 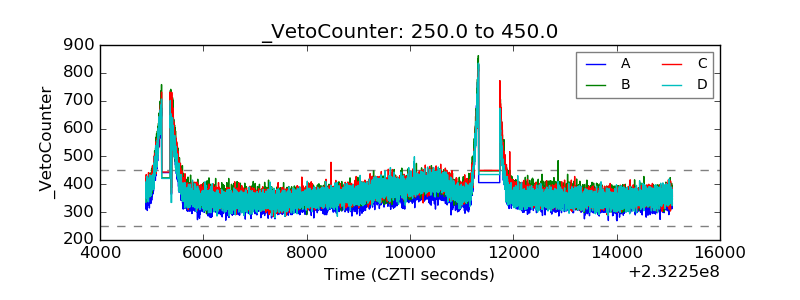 |