| Param | Original file | Final file |
|---|---|---|
| Filename | modeM0/AS1A03_038T01_9000001218_08765cztM0_level2.evt | modeM0/AS1A03_038T01_9000001218_08765cztM0_level2_quad_clean.evt |
| Size (bytes) | 786,830,400 | 109,146,240 |
| Size | 750.4 MB | 104.1 MB |
| Events in quadrant A | 4,469,961 | 692,827 |
| Events in quadrant B | 4,329,054 | 703,802 |
| Events in quadrant C | 4,251,623 | 697,666 |
| Events in quadrant D | 10,149,236 | 565,903 |
| Mode M9 | |||
|---|---|---|---|
| Quadrant | BADHDUFLAG | Total packets | Discarded packets |
| A | 0 | 15 | 1 |
| B | 0 | 15 | 0 |
| C | 0 | 15 | 1 |
| D | 0 | 15 | 0 |
| Mode M0 | |||
|---|---|---|---|
| Quadrant | BADHDUFLAG | Total packets | Discarded packets |
| A | 0 | 19289 | 99 |
| B | 0 | 18997 | 57 |
| C | 0 | 19026 | 72 |
| D | 0 | 36808 | 285 |
| Mode SS | |||
|---|---|---|---|
| Quadrant | BADHDUFLAG | Total packets | Discarded packets |
| A | 0 | 190 | 0 |
| B | 0 | 190 | 0 |
| C | 0 | 190 | 0 |
| D | 0 | 190 | 0 |
| Quadrant | Total seconds | Saturated seconds | Saturation percentage |
|---|---|---|---|
| A | 9285 | 137 | 1.475498% |
| B | 9305 | 126 | 1.354111% |
| C | 9297 | 82 | 0.882005% |
| D | 9269 | 2210 | 23.842917% |
Noise dominated data is calculated using 1-second bins in cleaned event files. If a bin has >2000 counts, and if more than 50% of those come from <1% of pixels, then it is considered to be noise-dominated and hence unusable.
| Quadrant | # 1 sec bins | Bins with >0 counts | Bins with >2000 counts | High rate bins dominated by noise | Noise dominated (total time) | Noise dominated (detector-on time) | Marked lightcurve |
|---|---|---|---|---|---|---|---|
| A | 10774 | 9324 | 5 | 5 | 0.05% | 0.05% | 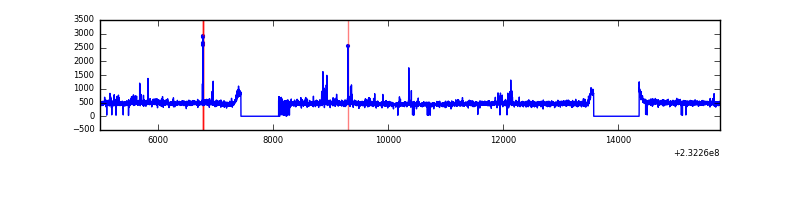 |
| B | 10774 | 9326 | 0 | 0 | 0.00% | 0.00% | 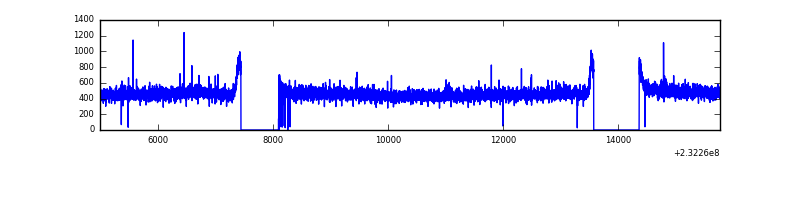 |
| C | 10774 | 9326 | 1 | 1 | 0.01% | 0.01% | 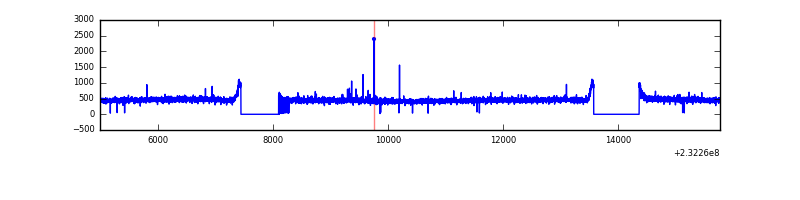 |
| D | 10774 | 9305 | 1993 | 1993 | 18.50% | 21.42% | 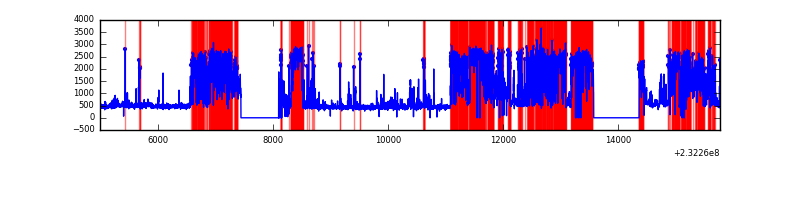 |
Top three noisy pixels from each quadrant. If the there are fewer than three noisy pixels in the level2.evt file, extra rows are filled as -1
| Pixel properties | Quadrant properties | ||||||
|---|---|---|---|---|---|---|---|
| Quadrant | DetID | PixID | Counts | Sigma | Mean | Median | Sigma |
| A | 13 | 251 | 181506 | 794.57 | 1107 | 1080 | 227.1 |
| A | 5 | 16 | 20128 | 83.88 | 1107 | 1080 | 227.1 |
| A | 0 | 226 | 10219 | 40.25 | 1107 | 1080 | 227.1 |
| B | 12 | 111 | 24683 | 109.79 | 1113 | 1085 | 214.9 |
| B | 11 | 111 | 19972 | 87.88 | 1113 | 1085 | 214.9 |
| B | 14 | 111 | 15085 | 65.14 | 1113 | 1085 | 214.9 |
| C | 9 | 54 | 13077 | 47.37 | 1084 | 1089 | 253.1 |
| C | 13 | 61 | 8261 | 28.34 | 1084 | 1089 | 253.1 |
| C | 12 | 4 | 7110 | 23.79 | 1084 | 1089 | 253.1 |
| D | 2 | 16 | 6038180 | 24534.01 | 952 | 930 | 246.1 |
| D | 1 | 52 | 225527 | 912.71 | 952 | 930 | 246.1 |
| D | 13 | 122 | 75755 | 304.07 | 952 | 930 | 246.1 |
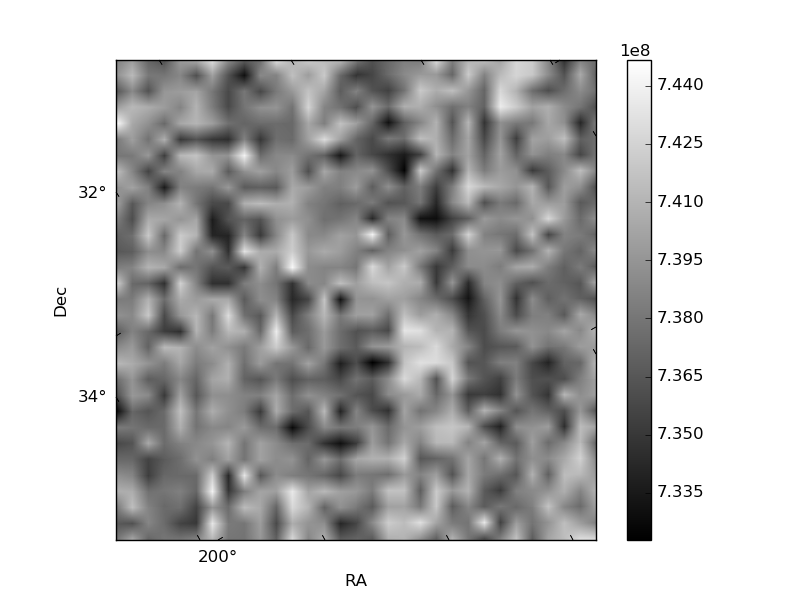
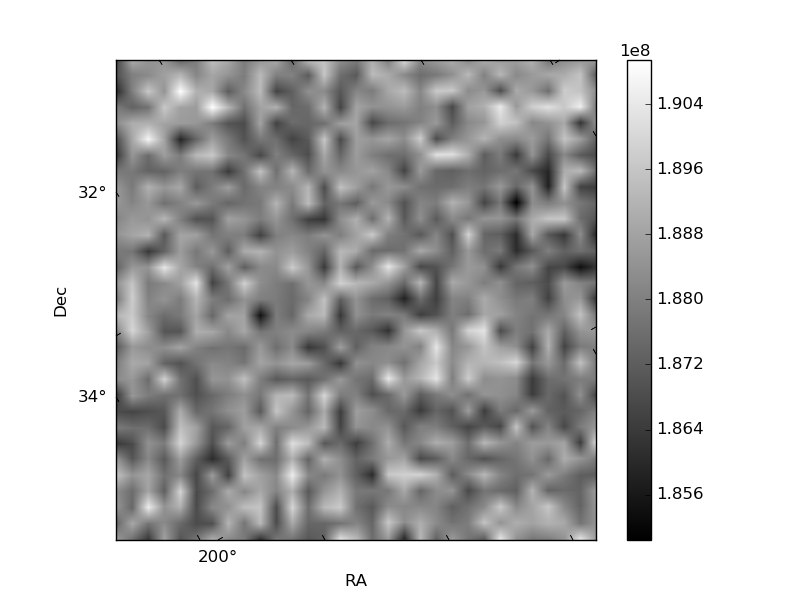
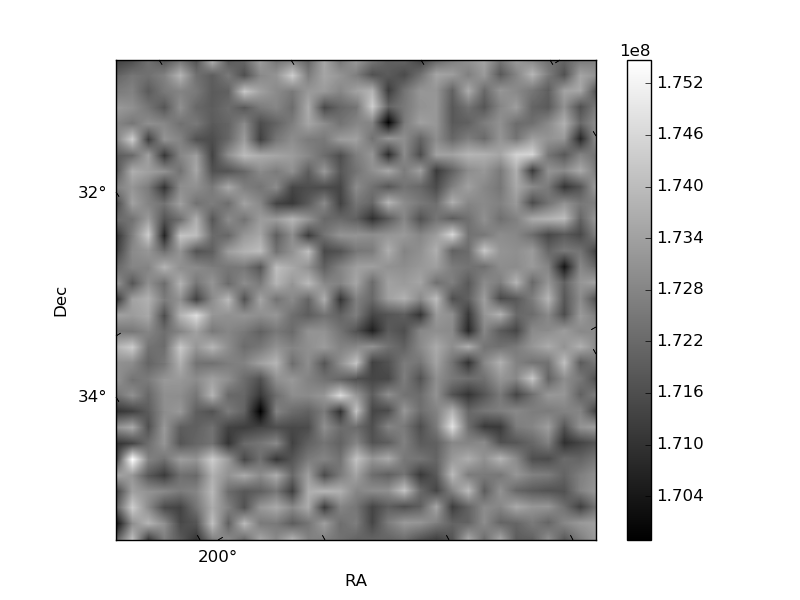
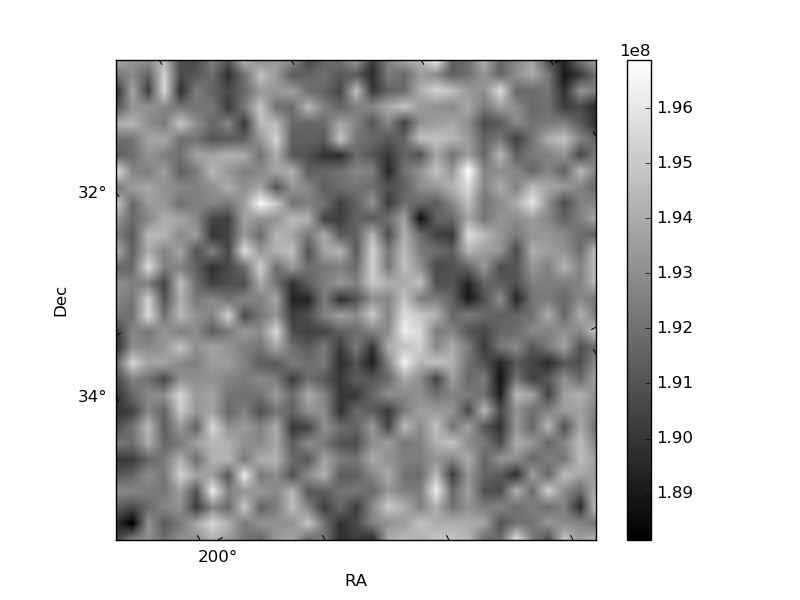
Histogram calculated using DETX and DETY for each event in the final _common_clean file
| Quadrant A | 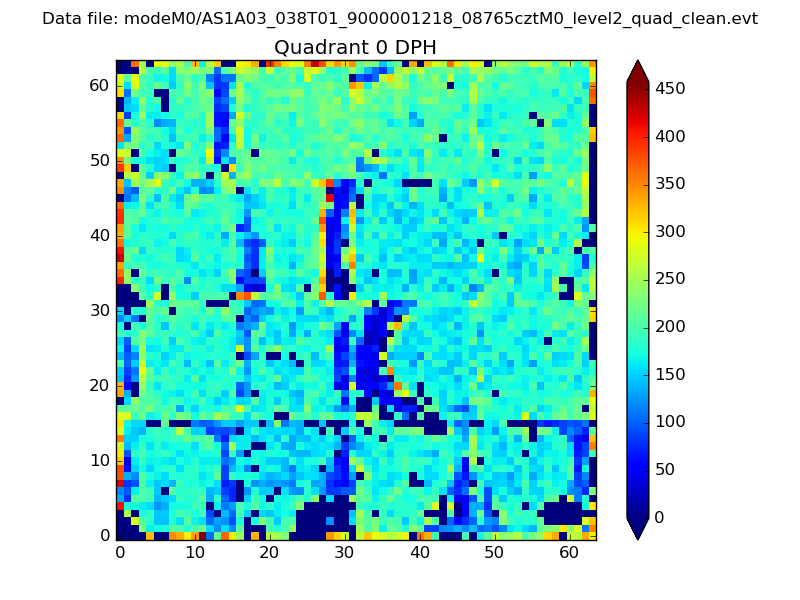 |
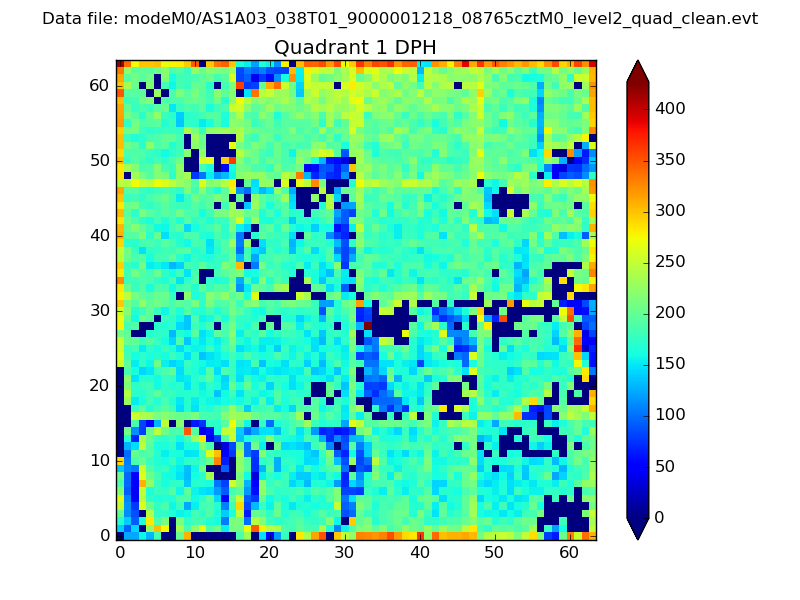 |
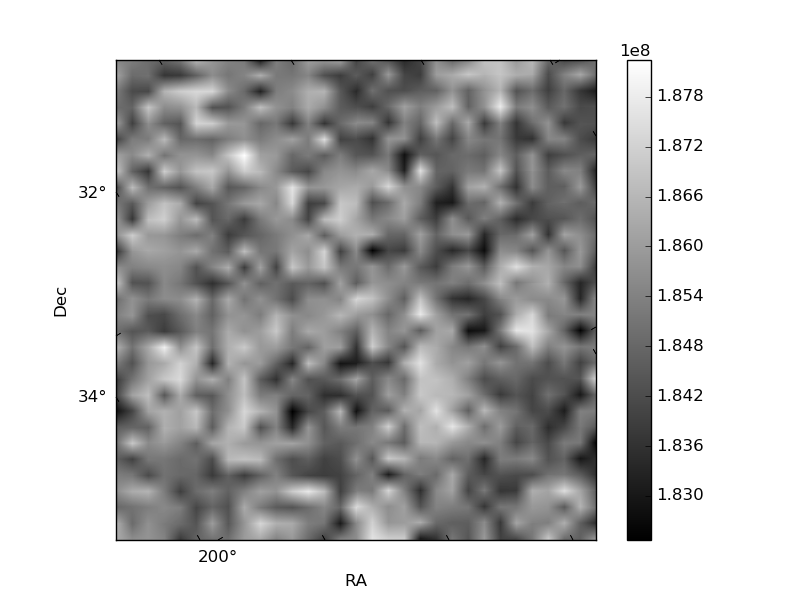
Quadrant B |
|---|---|---|---|
| Quadrant D | 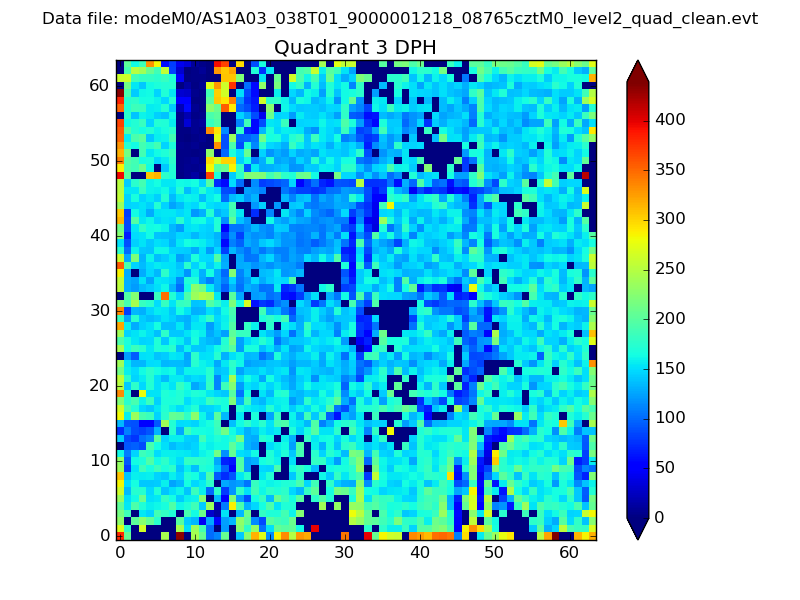 |
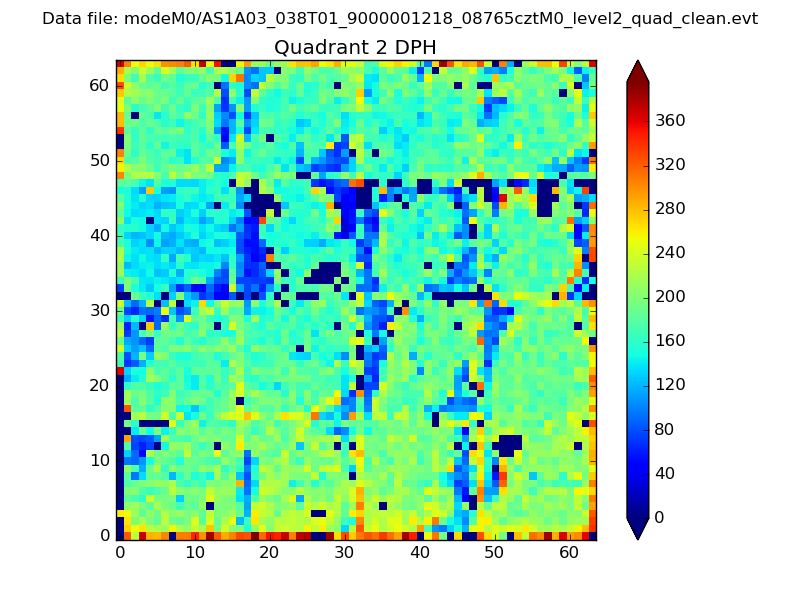 |
Quadrant C |
| Plot type | Count rate plots | Images |
|---|---|---|
| Comparison with Poisson distribution Blue bars denote a histogram of data divided into 1 sec bins. Red curve is a Poisson curve with rate = median count rate of data. |
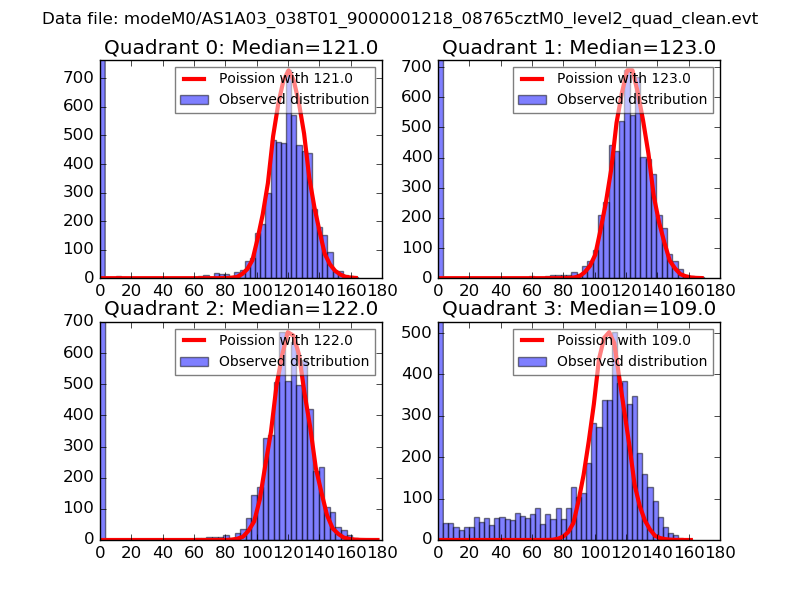 |
 |
| Quadrant-wise count rates Data is divided into 100 sec bins |
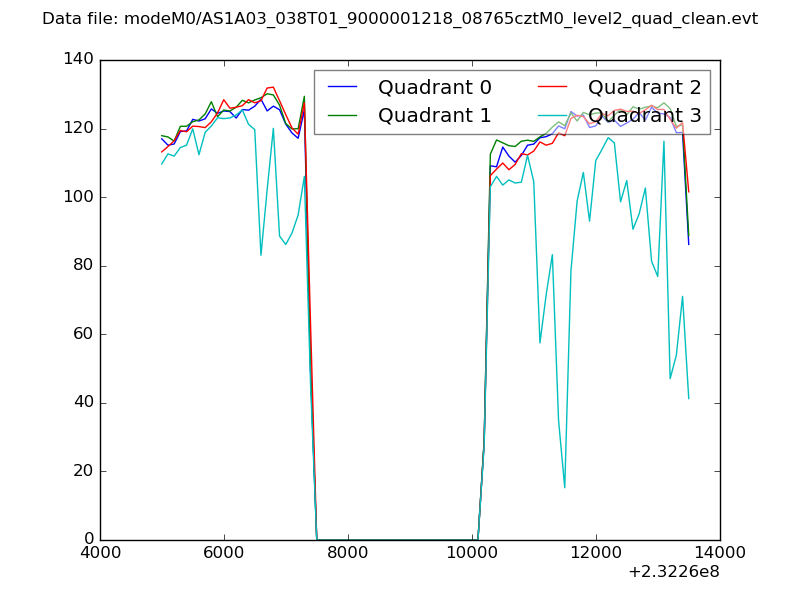 |
|
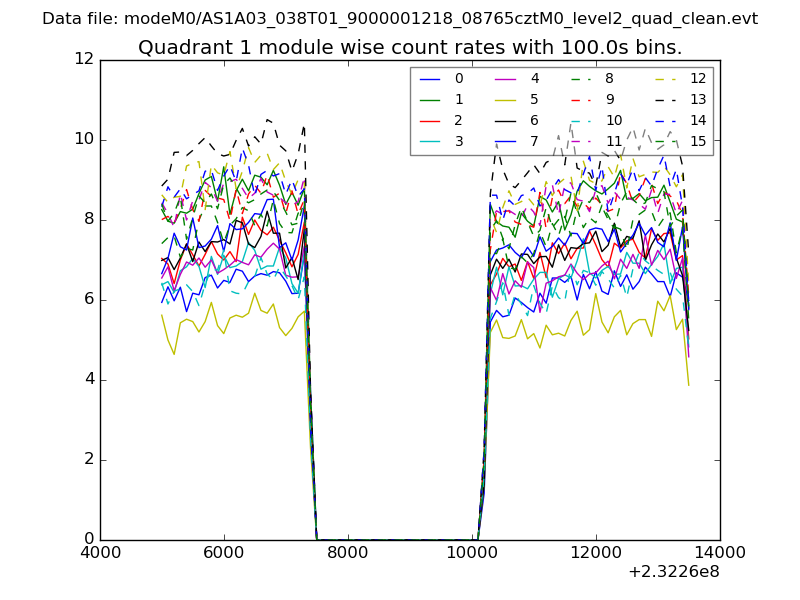
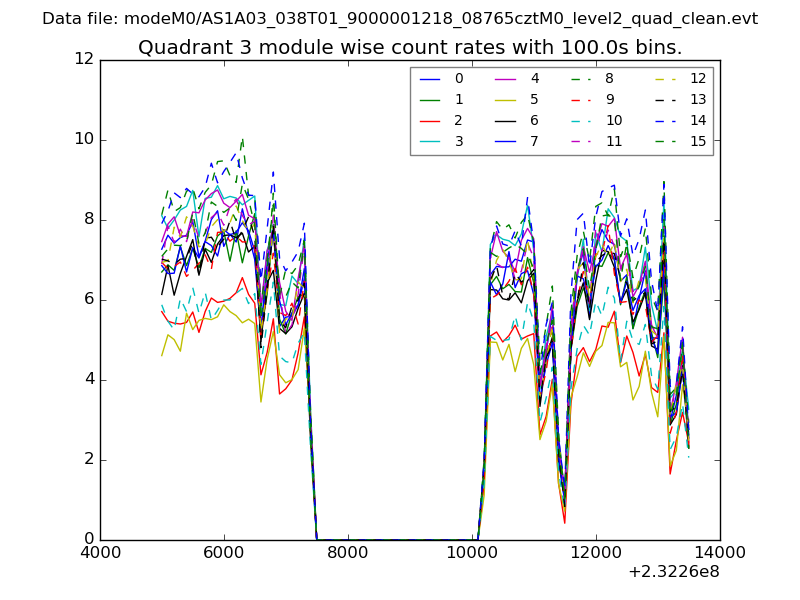
| Module-wise count rates for Quadrant A Data is divided into 100 sec bins |
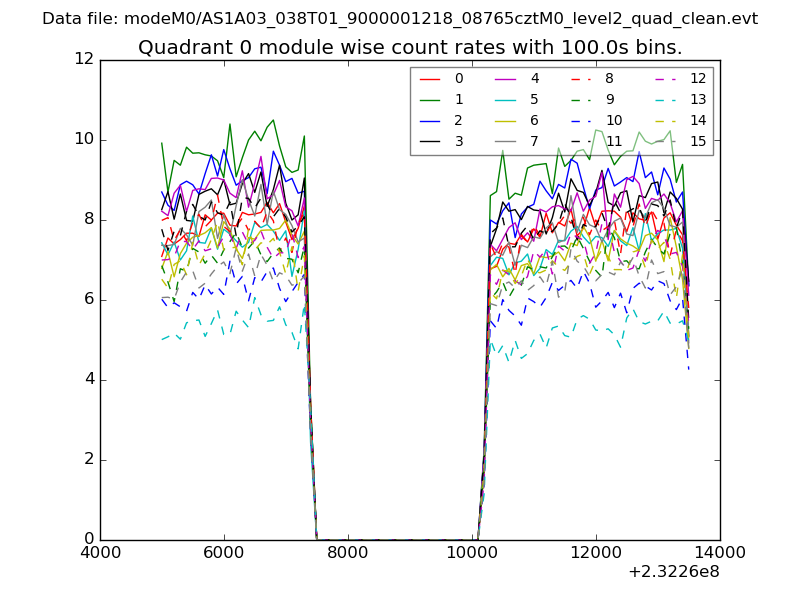 |
 |
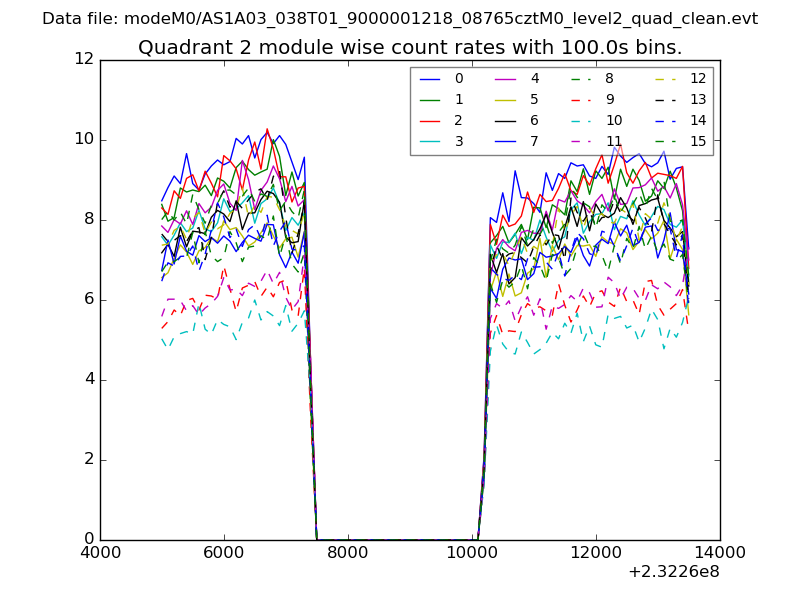
| Module-wise count rates for Quadrant B Data is divided into 100 sec bins |
 |
 |
| Module-wise count rates for Quadrant C Data is divided into 100 sec bins |
 |
 |
| Module-wise count rates for Quadrant D Data is divided into 100 sec bins |
 |
 |
| Parameter | Plot |
|---|---|
| CZT HV Monitor | 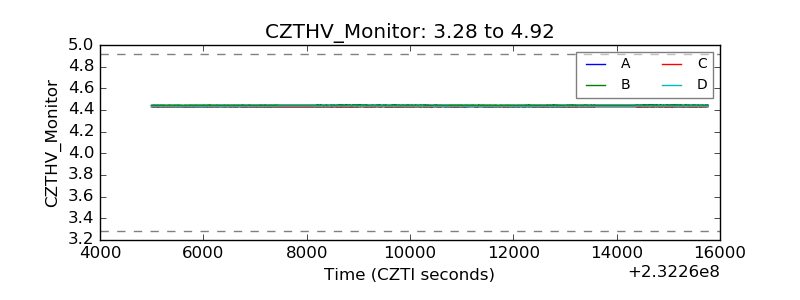 |
| D_VDD | 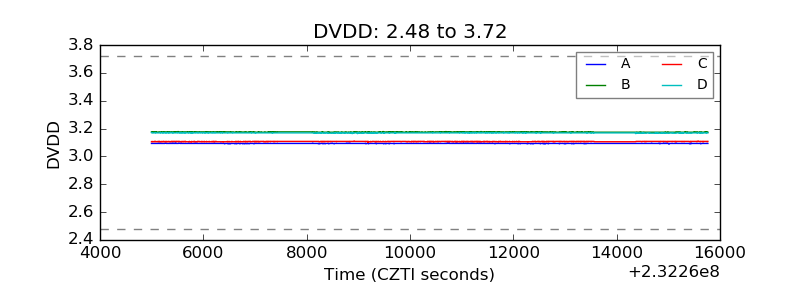 |
| Temperature 1 |  |
| Veto HV Monitor | 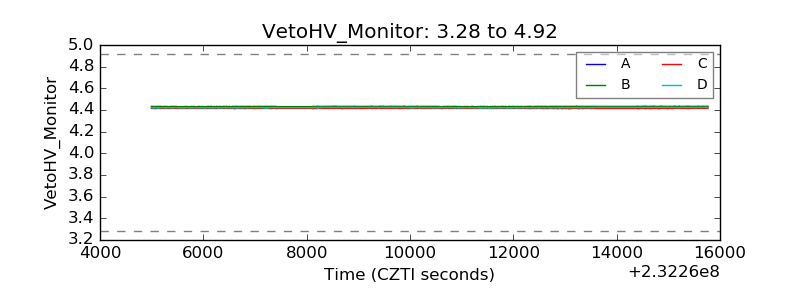 |
| Veto LLD | 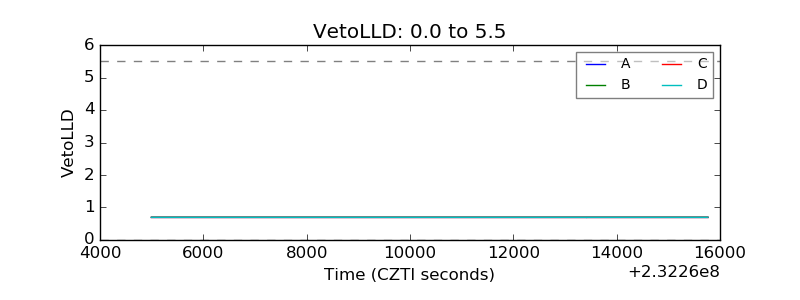 |
| Alpha Counter | 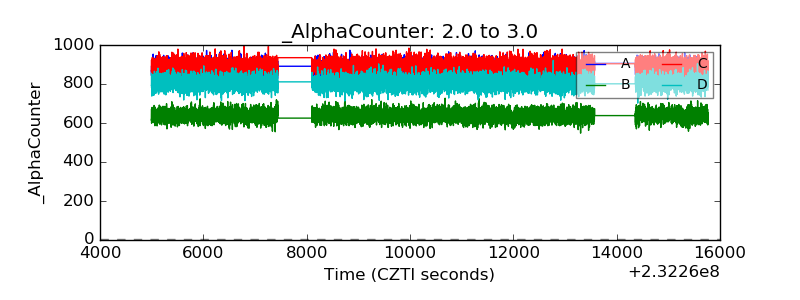 |
| _CPM_Rate | 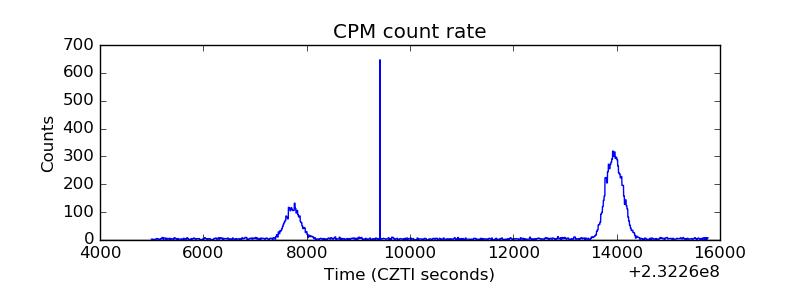 |
| CZT Counter | 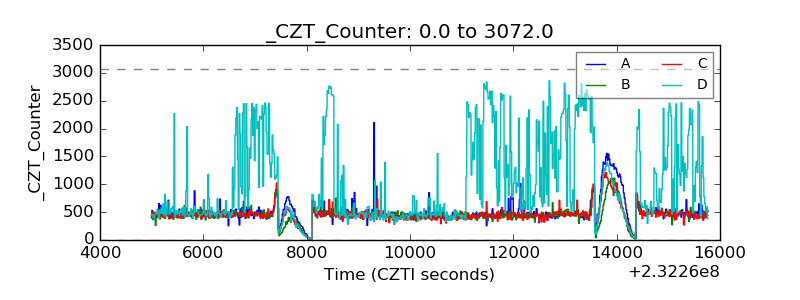 |
| +2.5 Volts monitor |  |
| +5 Volts monitor |  |
| _ROLL_ROT | 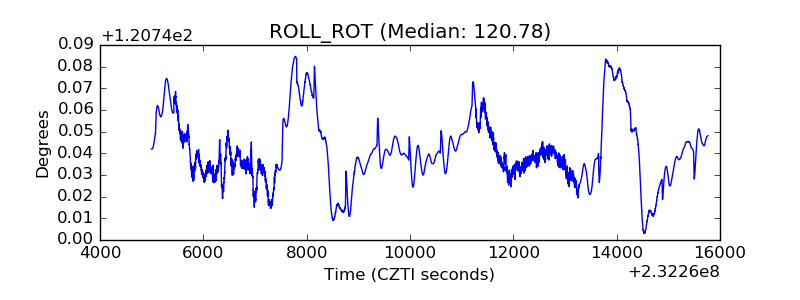 |
| _Roll_DEC | 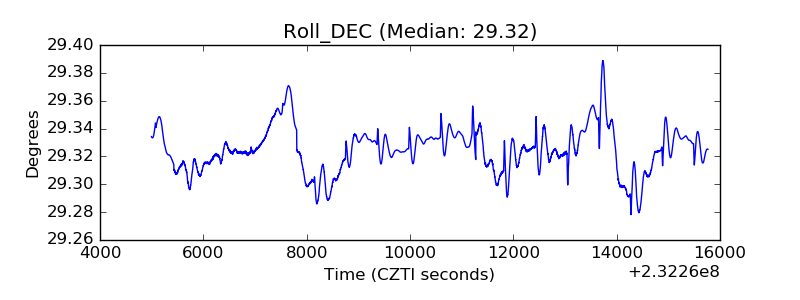 |
| _Roll_RA | 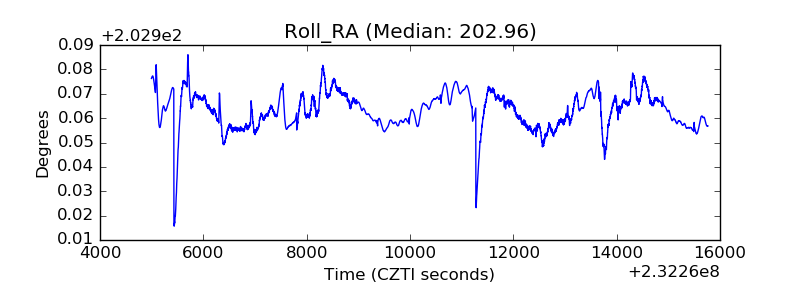 |
| Veto Counter | 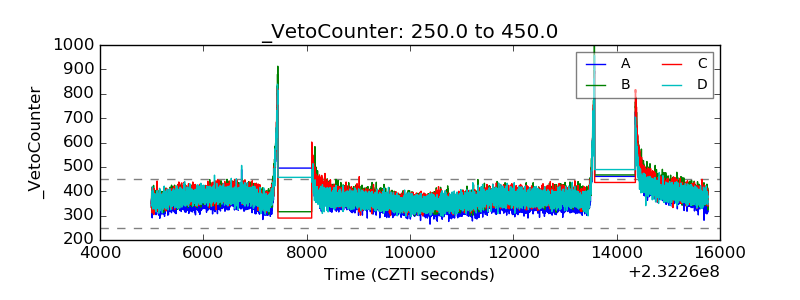 |