| Param | Original file | Final file |
|---|---|---|
| Filename | modeM0/AS1A03_038T01_9000001218_08766cztM0_level2.evt | modeM0/AS1A03_038T01_9000001218_08766cztM0_level2_quad_clean.evt |
| Size (bytes) | 631,221,120 | 71,997,120 |
| Size | 602.0 MB | 68.7 MB |
| Events in quadrant A | 3,331,803 | 450,969 |
| Events in quadrant B | 3,250,550 | 457,257 |
| Events in quadrant C | 3,226,928 | 451,316 |
| Events in quadrant D | 8,844,515 | 343,804 |
| Mode M9 | |||
|---|---|---|---|
| Quadrant | BADHDUFLAG | Total packets | Discarded packets |
| A | 0 | 17 | 0 |
| B | 0 | 17 | 0 |
| C | 0 | 17 | 0 |
| D | 0 | 17 | 0 |
| Mode M0 | |||
|---|---|---|---|
| Quadrant | BADHDUFLAG | Total packets | Discarded packets |
| A | 0 | 14297 | 11 |
| B | 0 | 14070 | 16 |
| C | 0 | 14190 | 11 |
| D | 0 | 30927 | 26 |
| Mode SS | |||
|---|---|---|---|
| Quadrant | BADHDUFLAG | Total packets | Discarded packets |
| A | 0 | 142 | 0 |
| B | 0 | 142 | 0 |
| C | 0 | 142 | 0 |
| D | 0 | 142 | 0 |
| Quadrant | Total seconds | Saturated seconds | Saturation percentage |
|---|---|---|---|
| A | 6825 | 150 | 2.197802% |
| B | 6823 | 142 | 2.081196% |
| C | 6825 | 105 | 1.538462% |
| D | 6824 | 1885 | 27.623095% |
Noise dominated data is calculated using 1-second bins in cleaned event files. If a bin has >2000 counts, and if more than 50% of those come from <1% of pixels, then it is considered to be noise-dominated and hence unusable.
| Quadrant | # 1 sec bins | Bins with >0 counts | Bins with >2000 counts | High rate bins dominated by noise | Noise dominated (total time) | Noise dominated (detector-on time) | Marked lightcurve |
|---|---|---|---|---|---|---|---|
| A | 8578 | 6828 | 7 | 7 | 0.08% | 0.10% | 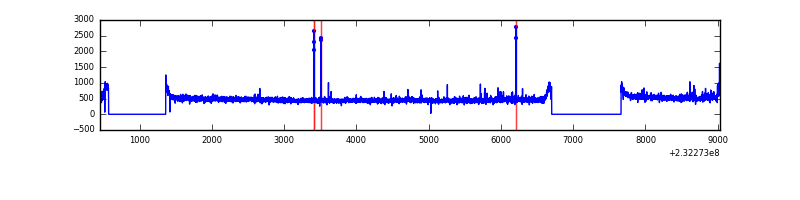 |
| B | 8578 | 6825 | 0 | 0 | 0.00% | 0.00% | 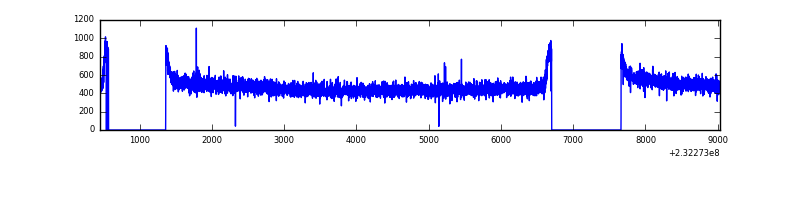 |
| C | 8578 | 6827 | 6 | 6 | 0.07% | 0.09% | 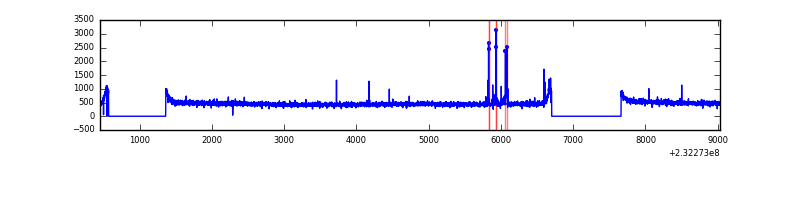 |
| D | 8578 | 6826 | 1697 | 1697 | 19.78% | 24.86% | 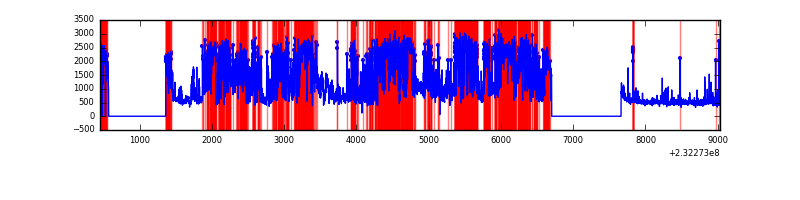 |
Top three noisy pixels from each quadrant. If the there are fewer than three noisy pixels in the level2.evt file, extra rows are filled as -1
| Pixel properties | Quadrant properties | ||||||
|---|---|---|---|---|---|---|---|
| Quadrant | DetID | PixID | Counts | Sigma | Mean | Median | Sigma |
| A | 13 | 251 | 50100 | 284.89 | 840 | 821 | 173.0 |
| A | 8 | 5 | 26467 | 148.26 | 840 | 821 | 173.0 |
| A | 5 | 16 | 22641 | 126.14 | 840 | 821 | 173.0 |
| B | 12 | 111 | 18525 | 108.67 | 837 | 816 | 163.0 |
| B | 11 | 111 | 15070 | 87.47 | 837 | 816 | 163.0 |
| B | 14 | 111 | 11484 | 65.46 | 837 | 816 | 163.0 |
| C | 9 | 68 | 49036 | 254.62 | 812 | 815 | 189.4 |
| C | 13 | 61 | 6025 | 27.51 | 812 | 815 | 189.4 |
| C | 9 | 54 | 5722 | 25.91 | 812 | 815 | 189.4 |
| D | 2 | 16 | 5822364 | 32097.79 | 707 | 689 | 181.4 |
| D | 1 | 52 | 196273 | 1078.35 | 707 | 689 | 181.4 |
| D | 2 | 152 | 59884 | 326.37 | 707 | 689 | 181.4 |
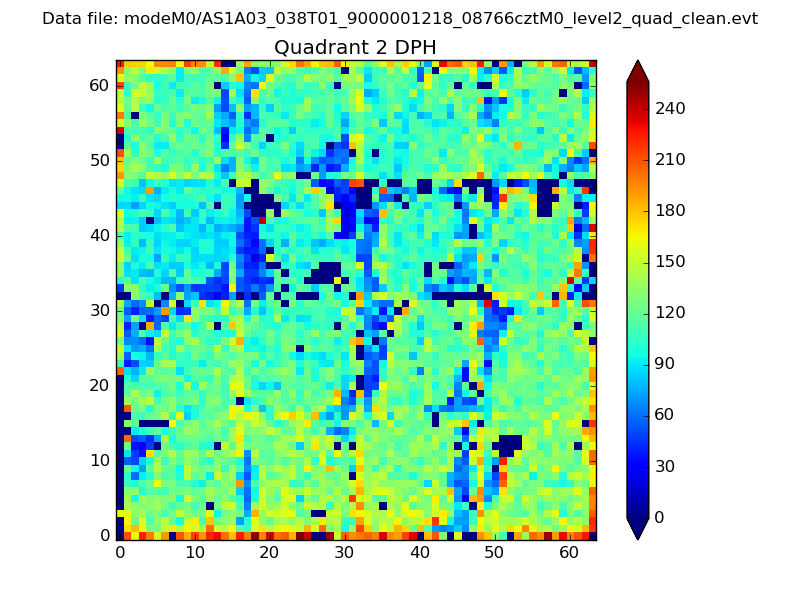
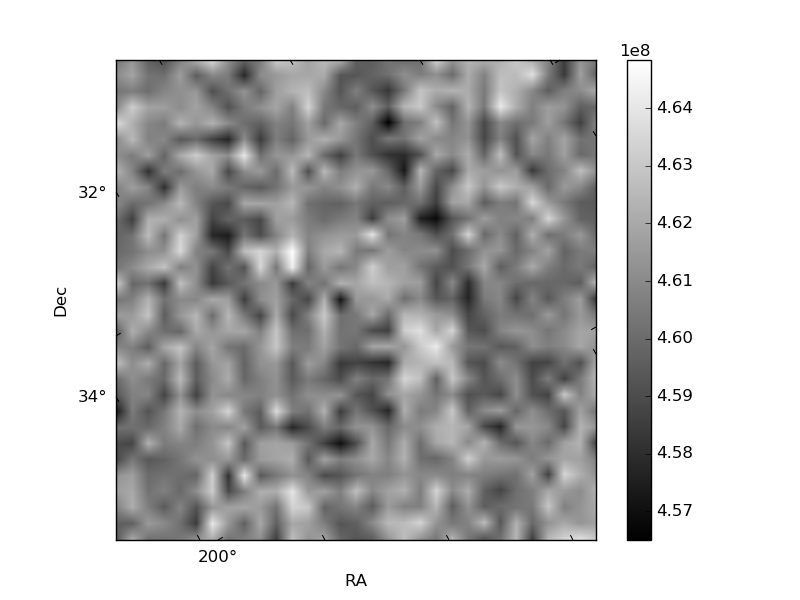
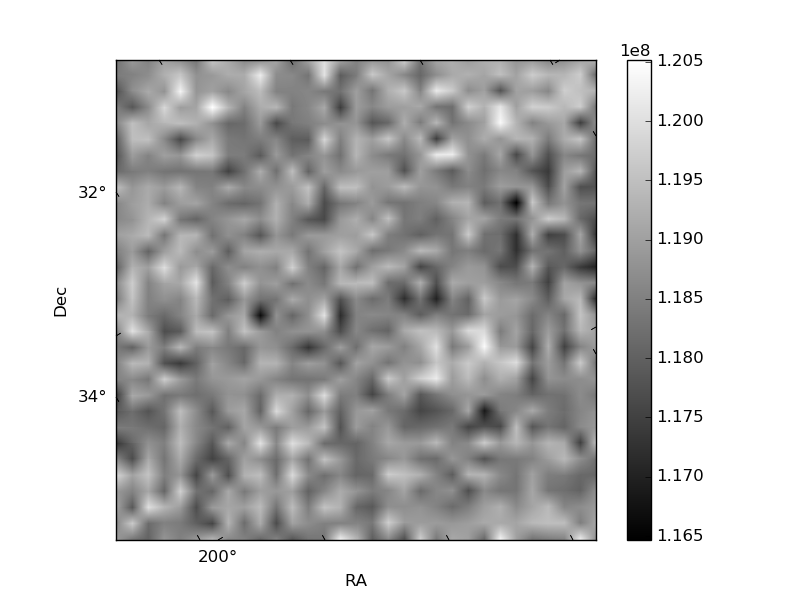
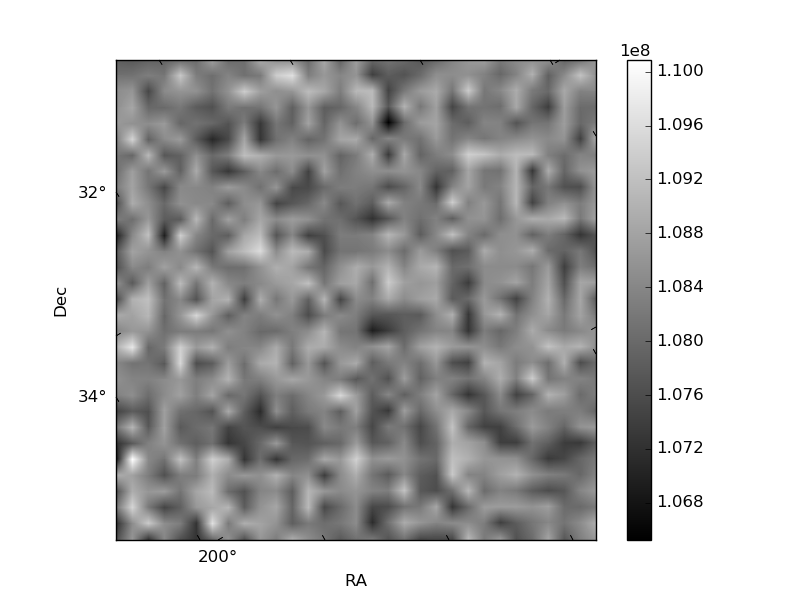
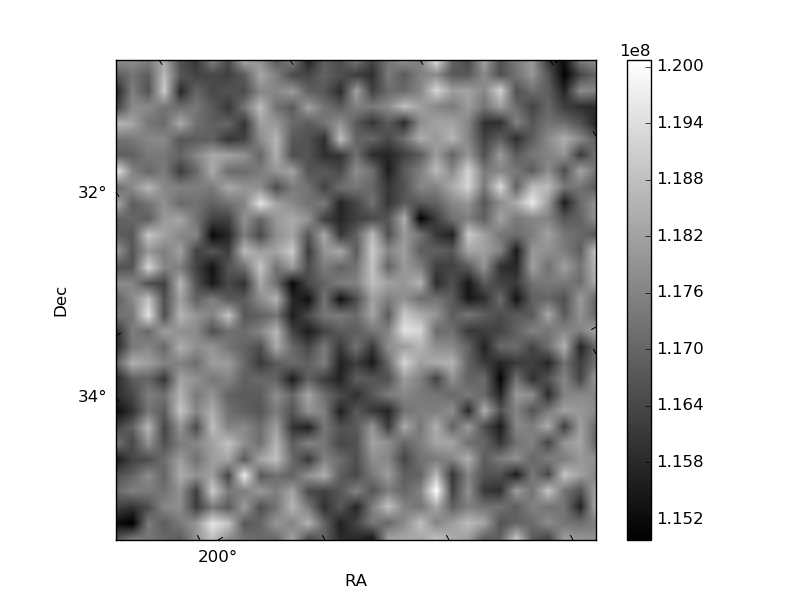
Histogram calculated using DETX and DETY for each event in the final _common_clean file
| Quadrant A | 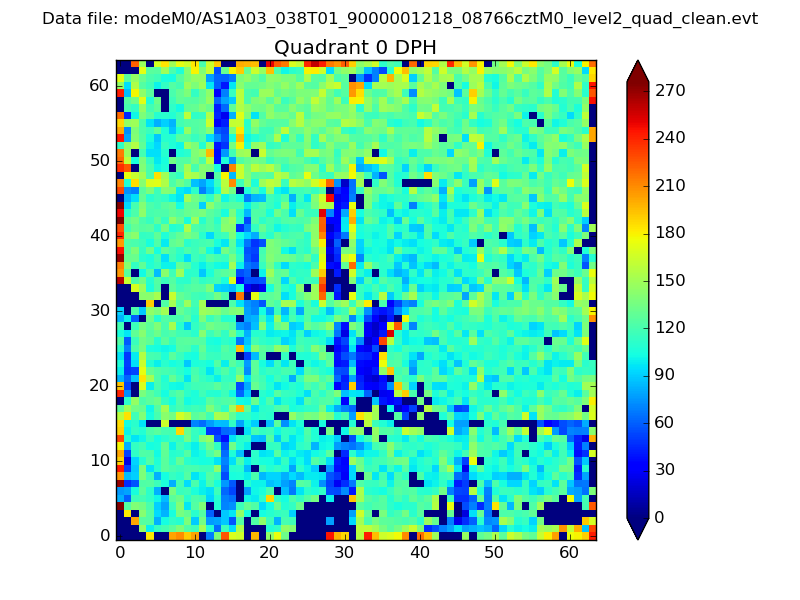 |
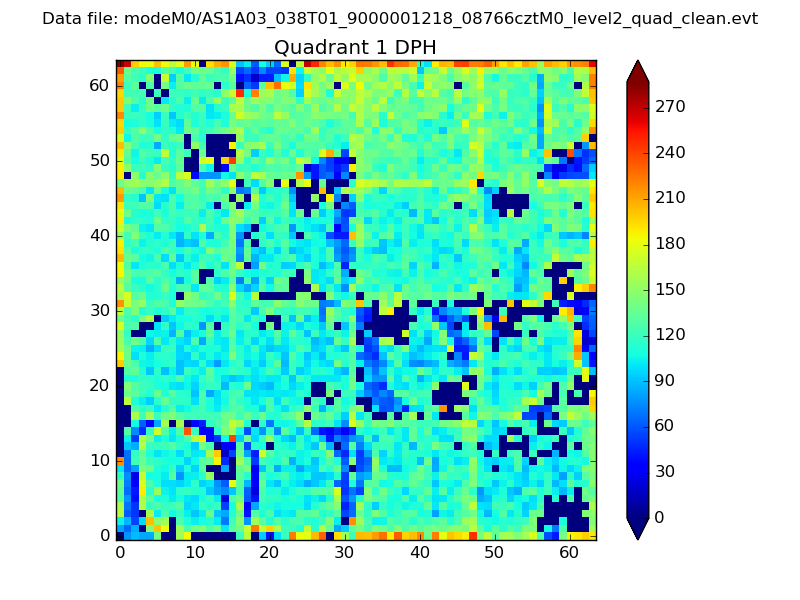 |
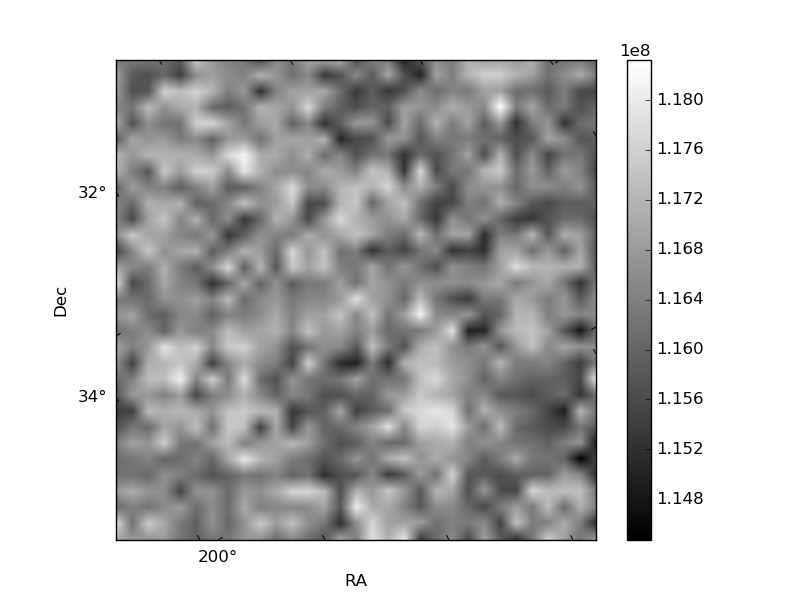
Quadrant B |
|---|---|---|---|
| Quadrant D | 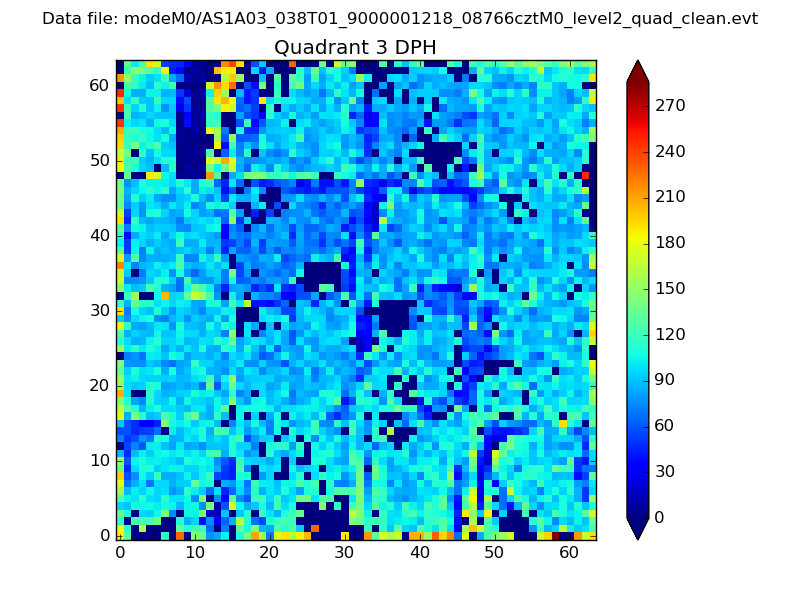 |
 |
Quadrant C |
| Plot type | Count rate plots | Images |
|---|---|---|
| Comparison with Poisson distribution Blue bars denote a histogram of data divided into 1 sec bins. Red curve is a Poisson curve with rate = median count rate of data. |
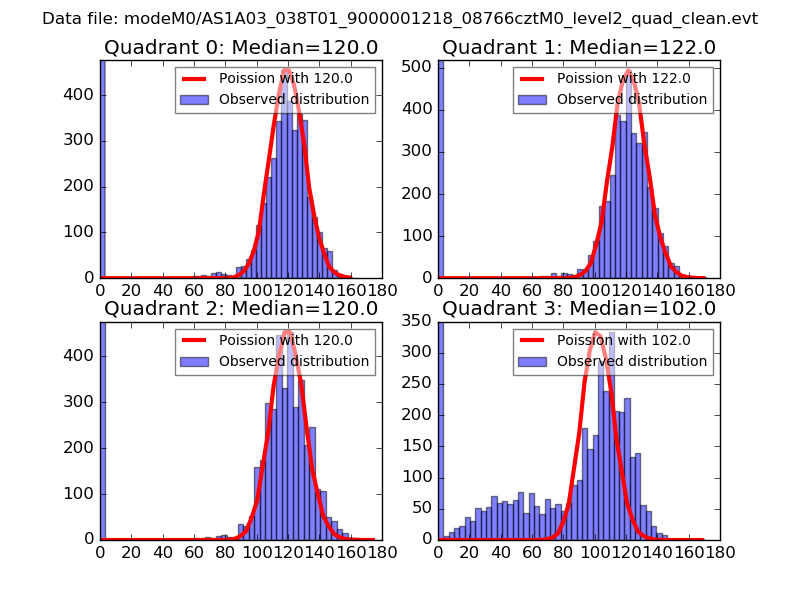 |
 |
| Quadrant-wise count rates Data is divided into 100 sec bins |
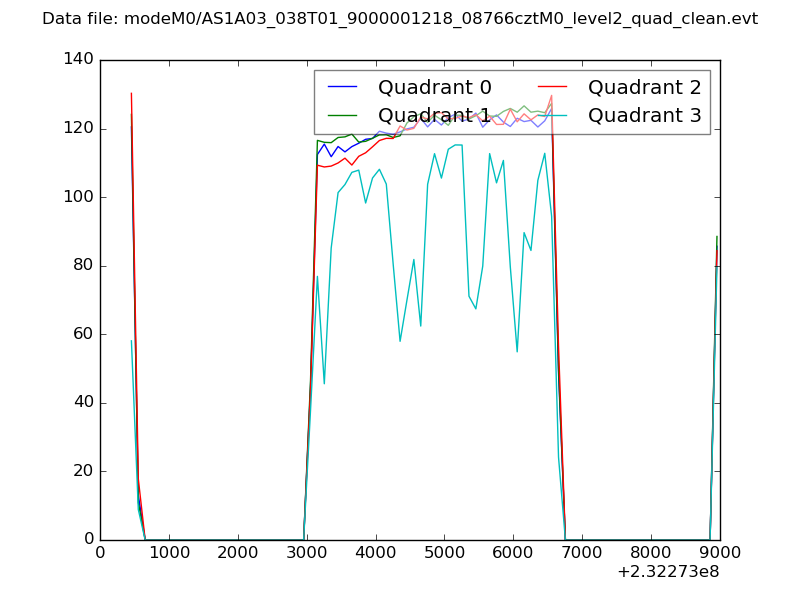 |
|
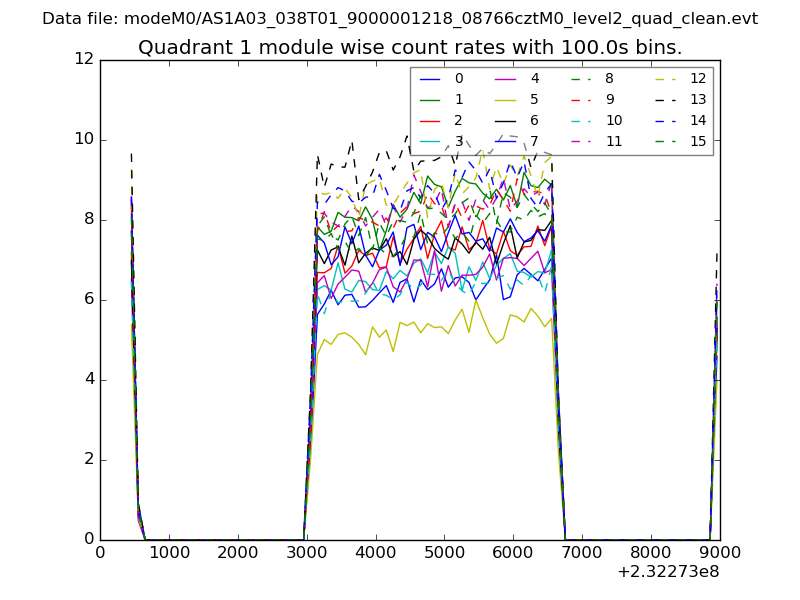
| Module-wise count rates for Quadrant A Data is divided into 100 sec bins |
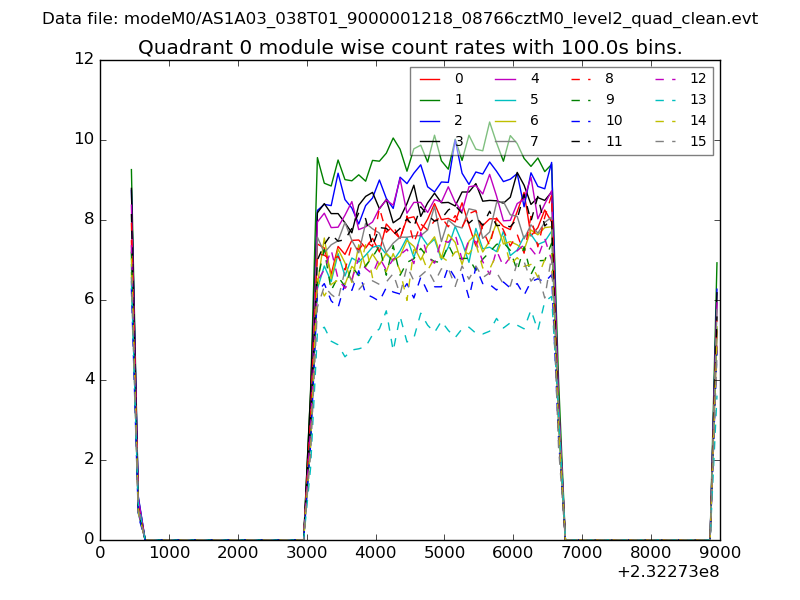 |
 |
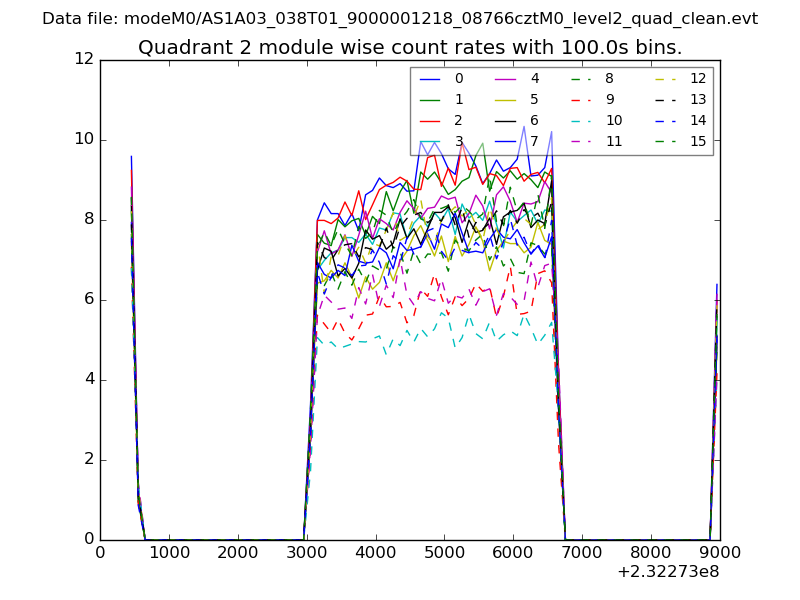
| Module-wise count rates for Quadrant B Data is divided into 100 sec bins |
 |
 |
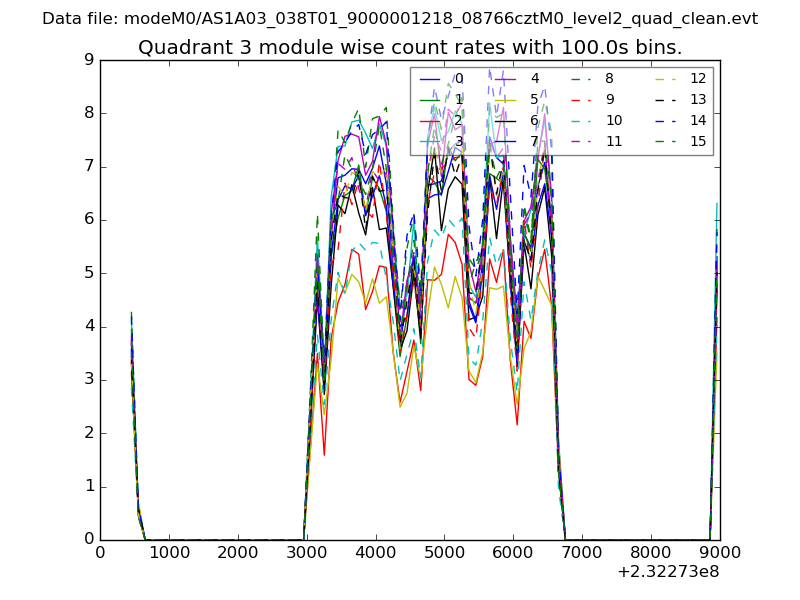
| Module-wise count rates for Quadrant C Data is divided into 100 sec bins |
 |
 |
| Module-wise count rates for Quadrant D Data is divided into 100 sec bins |
 |
 |
| Parameter | Plot |
|---|---|
| CZT HV Monitor | 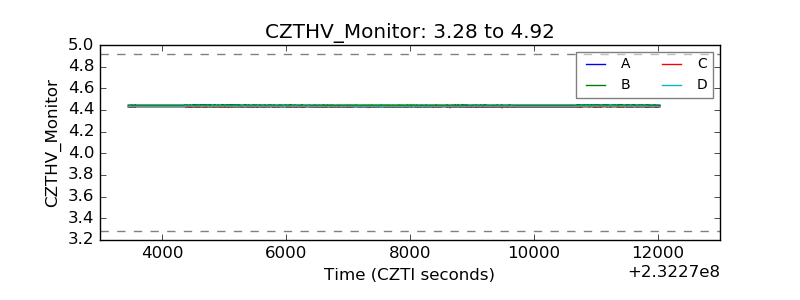 |
| D_VDD | 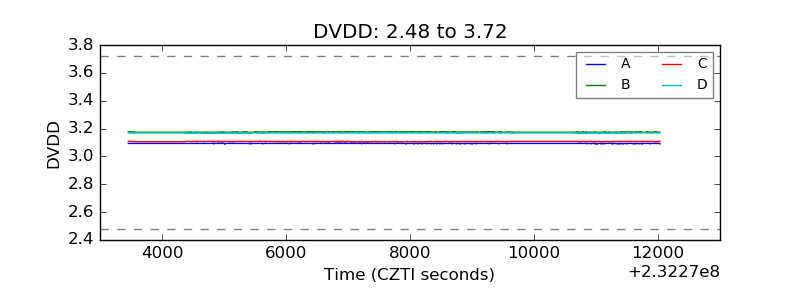 |
| Temperature 1 | 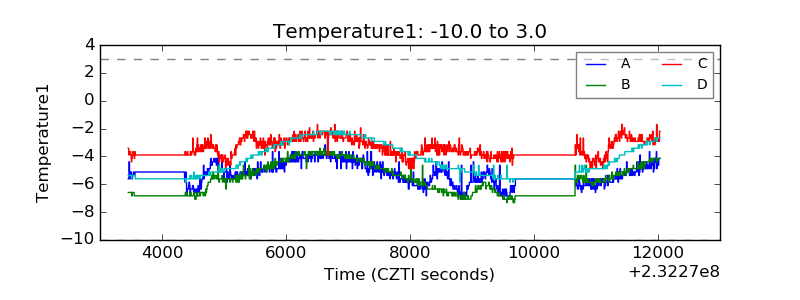 |
| Veto HV Monitor | 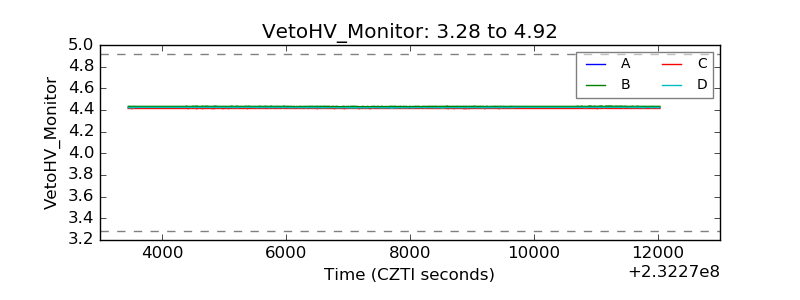 |
| Veto LLD | 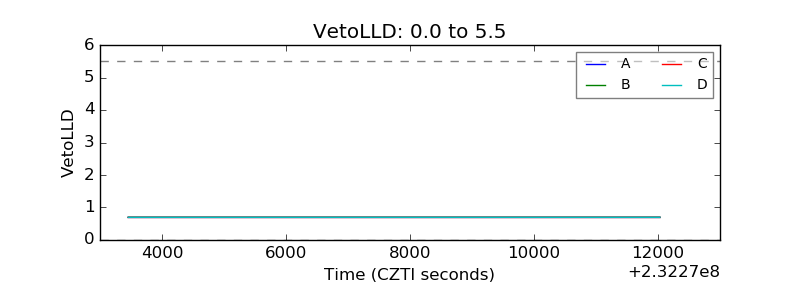 |
| Alpha Counter | 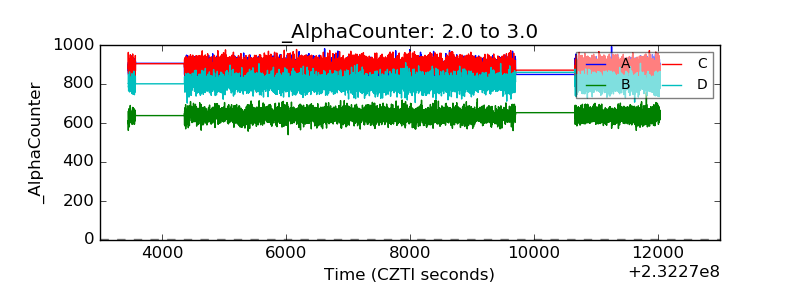 |
| _CPM_Rate |  |
| CZT Counter | 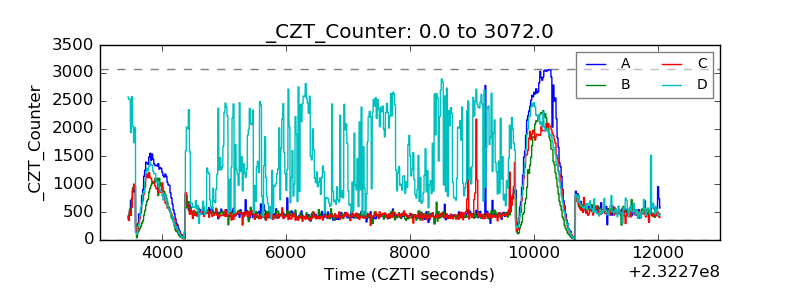 |
| +2.5 Volts monitor |  |
| +5 Volts monitor | 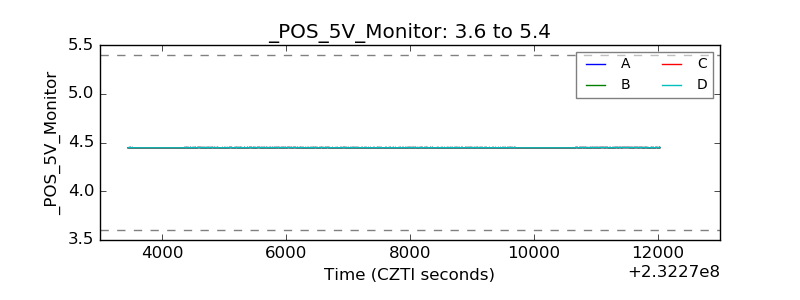 |
| _ROLL_ROT | 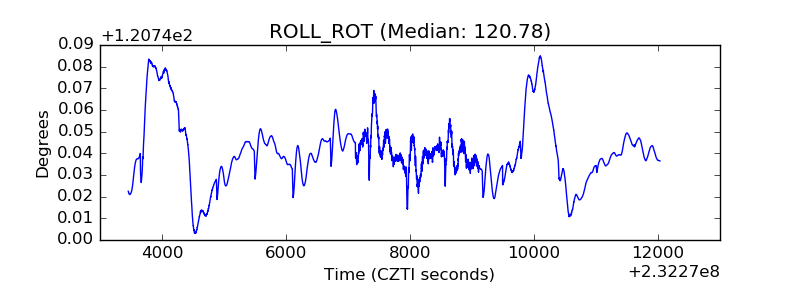 |
| _Roll_DEC | 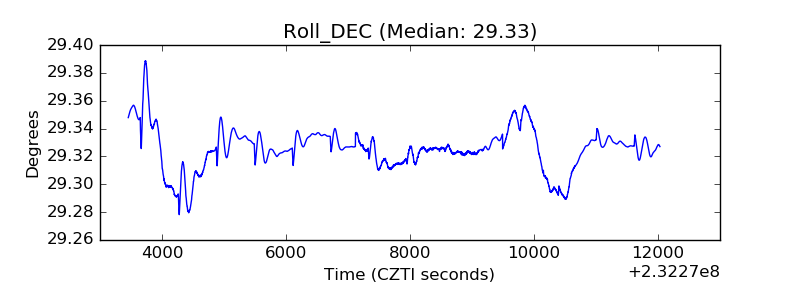 |
| _Roll_RA | 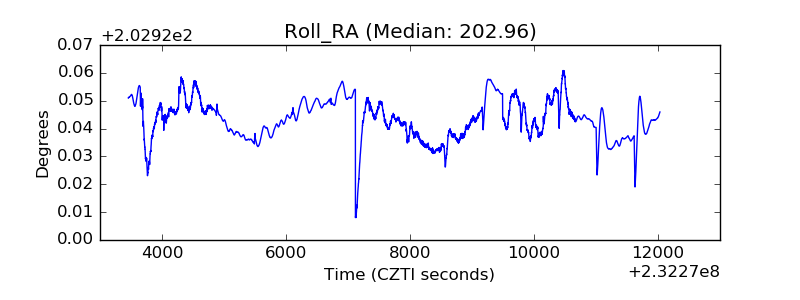 |
| Veto Counter | 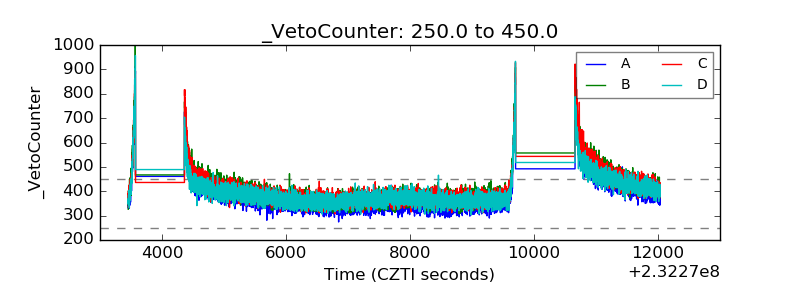 |