| Param | Original file | Final file |
|---|---|---|
| Filename | modeM0/AS1A03_038T01_9000001218_08768cztM0_level2.evt | modeM0/AS1A03_038T01_9000001218_08768cztM0_level2_quad_clean.evt |
| Size (bytes) | 600,744,960 | 91,995,840 |
| Size | 572.9 MB | 87.7 MB |
| Events in quadrant A | 3,783,186 | 592,627 |
| Events in quadrant B | 3,430,173 | 605,254 |
| Events in quadrant C | 3,439,209 | 590,281 |
| Events in quadrant D | 7,062,224 | 505,774 |
| Mode M9 | |||
|---|---|---|---|
| Quadrant | BADHDUFLAG | Total packets | Discarded packets |
| A | 0 | 20 | 0 |
| B | 0 | 20 | 1 |
| C | 0 | 20 | 1 |
| D | 0 | 20 | 0 |
| Mode M0 | |||
|---|---|---|---|
| Quadrant | BADHDUFLAG | Total packets | Discarded packets |
| A | 0 | 16622 | 831 |
| B | 0 | 15456 | 708 |
| C | 0 | 15633 | 692 |
| D | 0 | 28307 | 2632 |
| Mode SS | |||
|---|---|---|---|
| Quadrant | BADHDUFLAG | Total packets | Discarded packets |
| A | 0 | 154 | 2 |
| B | 0 | 154 | 4 |
| C | 0 | 154 | 4 |
| D | 0 | 154 | 6 |
| Quadrant | Total seconds | Saturated seconds | Saturation percentage |
|---|---|---|---|
| A | 7082 | 167 | 2.358091% |
| B | 7079 | 148 | 2.090691% |
| C | 7092 | 121 | 1.706148% |
| D | 6893 | 1071 | 15.537502% |
Noise dominated data is calculated using 1-second bins in cleaned event files. If a bin has >2000 counts, and if more than 50% of those come from <1% of pixels, then it is considered to be noise-dominated and hence unusable.
| Quadrant | # 1 sec bins | Bins with >0 counts | Bins with >2000 counts | High rate bins dominated by noise | Noise dominated (total time) | Noise dominated (detector-on time) | Marked lightcurve |
|---|---|---|---|---|---|---|---|
| A | 9456 | 7322 | 13 | 13 | 0.14% | 0.18% | 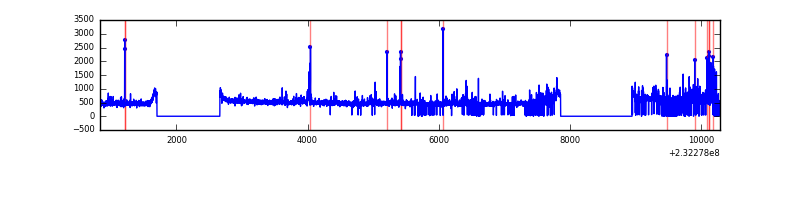 |
| B | 9461 | 7353 | 0 | 0 | 0.00% | 0.00% | 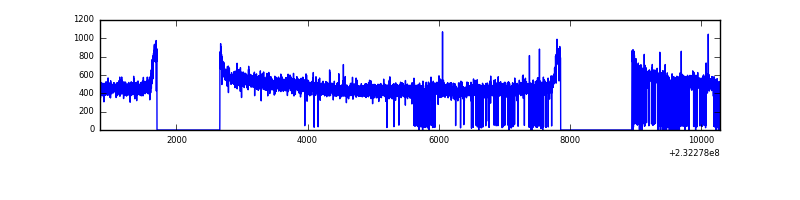 |
| C | 9458 | 7356 | 4 | 4 | 0.04% | 0.05% | 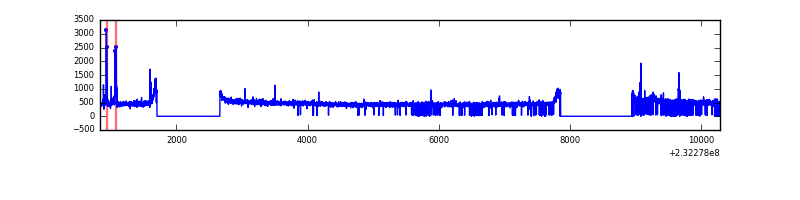 |
| D | 9455 | 7166 | 896 | 896 | 9.48% | 12.50% | 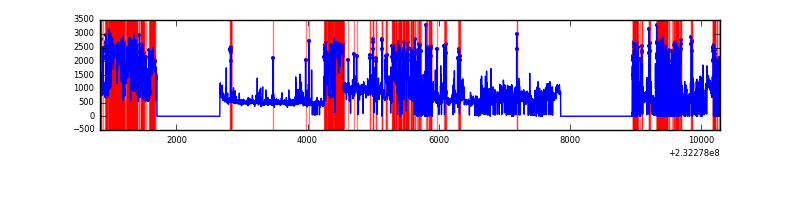 |
Top three noisy pixels from each quadrant. If the there are fewer than three noisy pixels in the level2.evt file, extra rows are filled as -1
| Pixel properties | Quadrant properties | ||||||
|---|---|---|---|---|---|---|---|
| Quadrant | DetID | PixID | Counts | Sigma | Mean | Median | Sigma |
| A | 8 | 5 | 241327 | 1320.78 | 887 | 867 | 182.1 |
| A | 13 | 251 | 96574 | 525.69 | 887 | 867 | 182.1 |
| A | 3 | 1 | 24772 | 131.3 | 887 | 867 | 182.1 |
| B | 12 | 111 | 19158 | 107.33 | 882 | 858 | 170.5 |
| B | 11 | 111 | 15476 | 85.73 | 882 | 858 | 170.5 |
| B | 14 | 111 | 11932 | 64.95 | 882 | 858 | 170.5 |
| C | 9 | 68 | 74997 | 367.26 | 860 | 863 | 201.9 |
| C | 13 | 61 | 6378 | 27.32 | 860 | 863 | 201.9 |
| C | 9 | 54 | 5796 | 24.44 | 860 | 863 | 201.9 |
| D | 2 | 16 | 3814388 | 19417.33 | 774 | 755 | 196.4 |
| D | 2 | 152 | 113907 | 576.12 | 774 | 755 | 196.4 |
| D | 5 | 233 | 55878 | 280.66 | 774 | 755 | 196.4 |
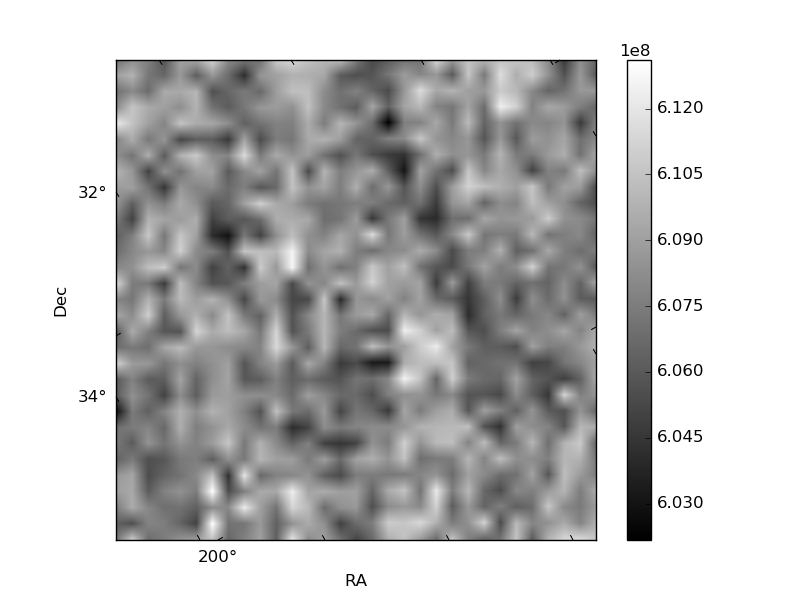
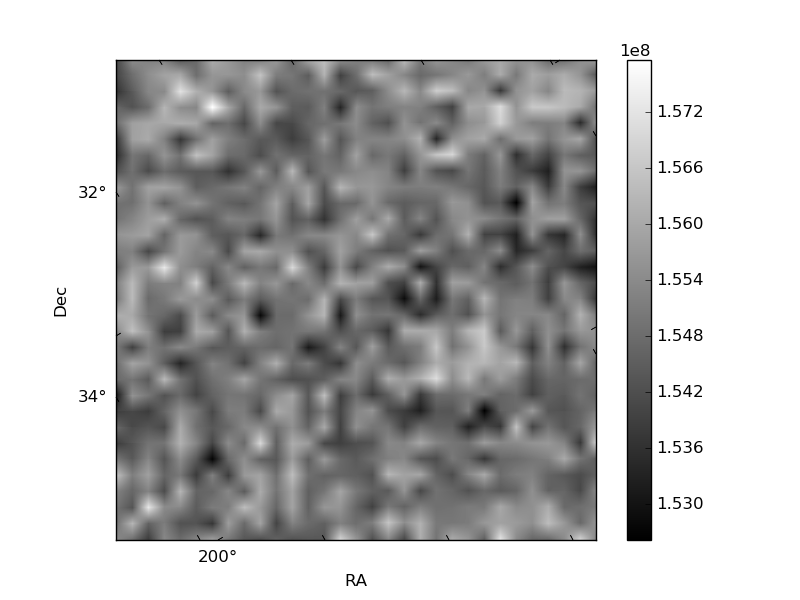
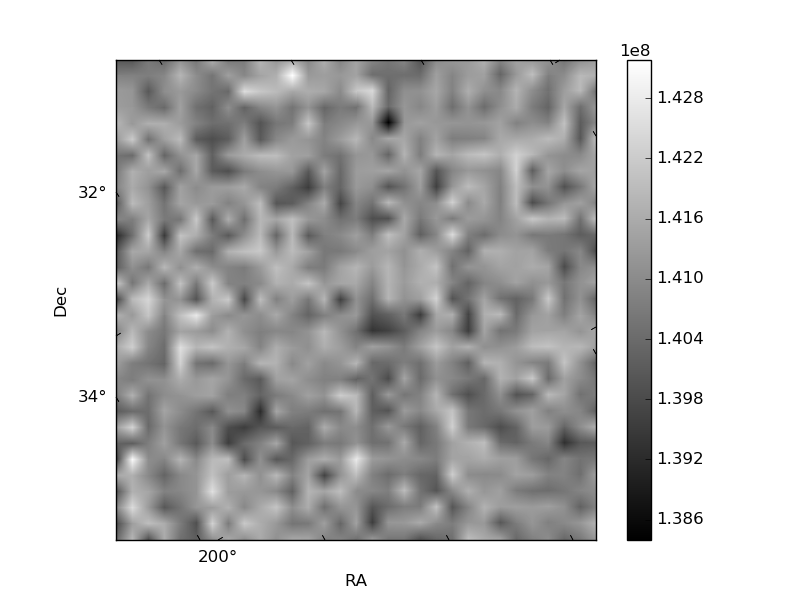
Histogram calculated using DETX and DETY for each event in the final _common_clean file
| Quadrant A | 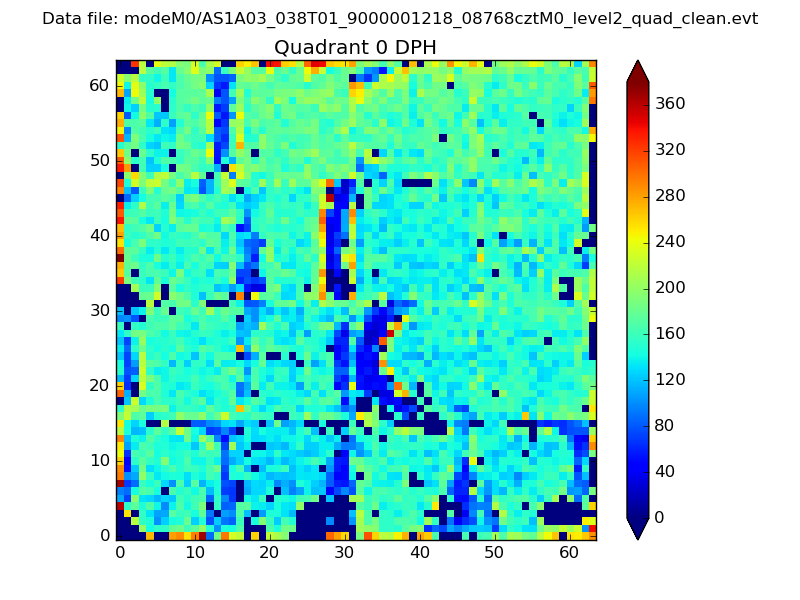 |
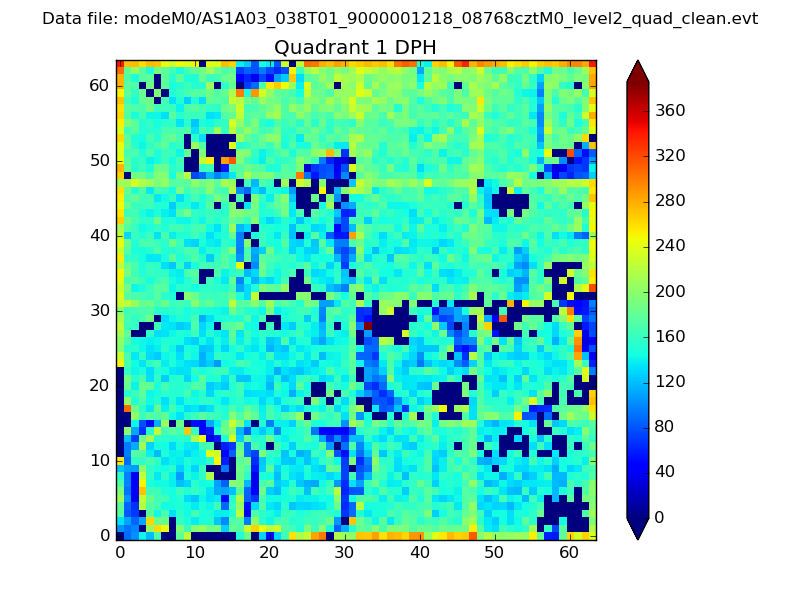 |
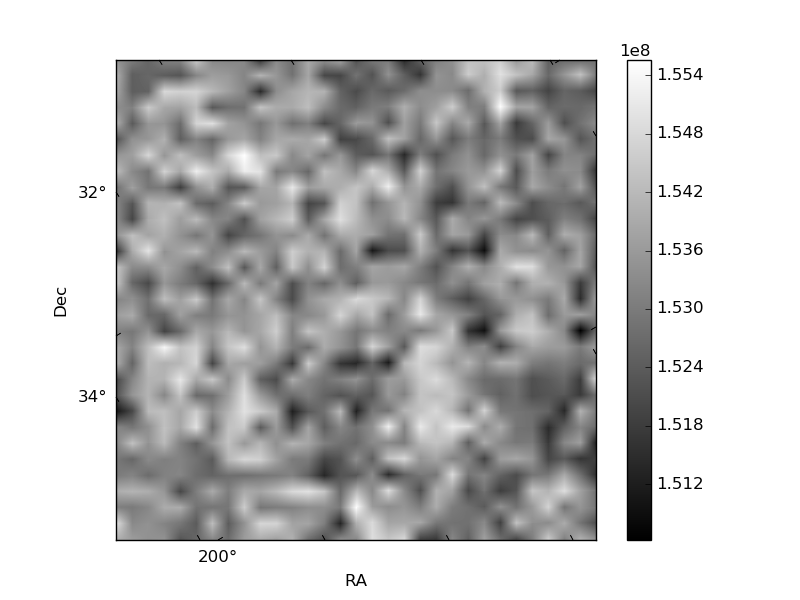
Quadrant B |
|---|---|---|---|
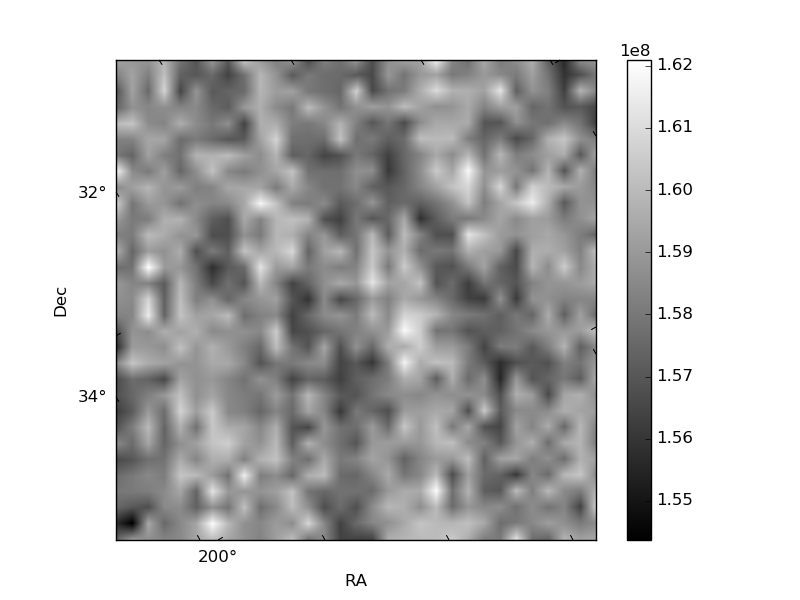
| Quadrant D | 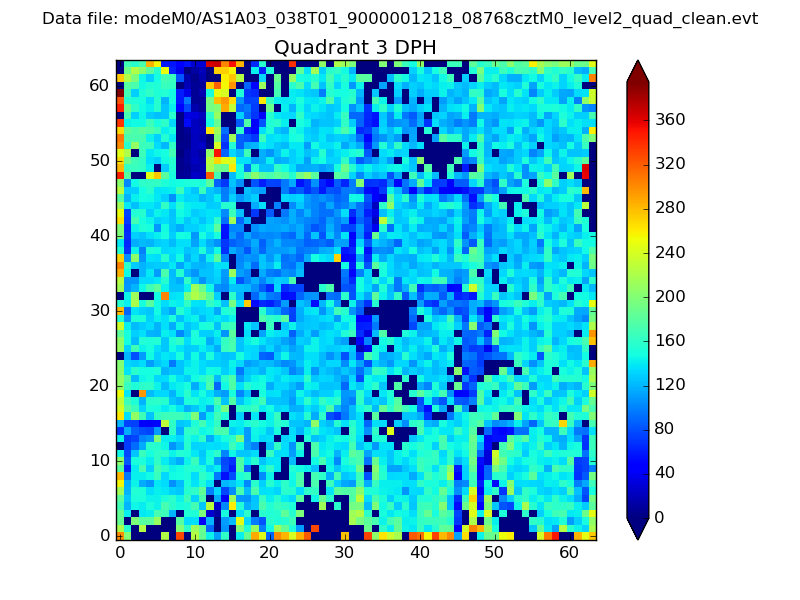 |
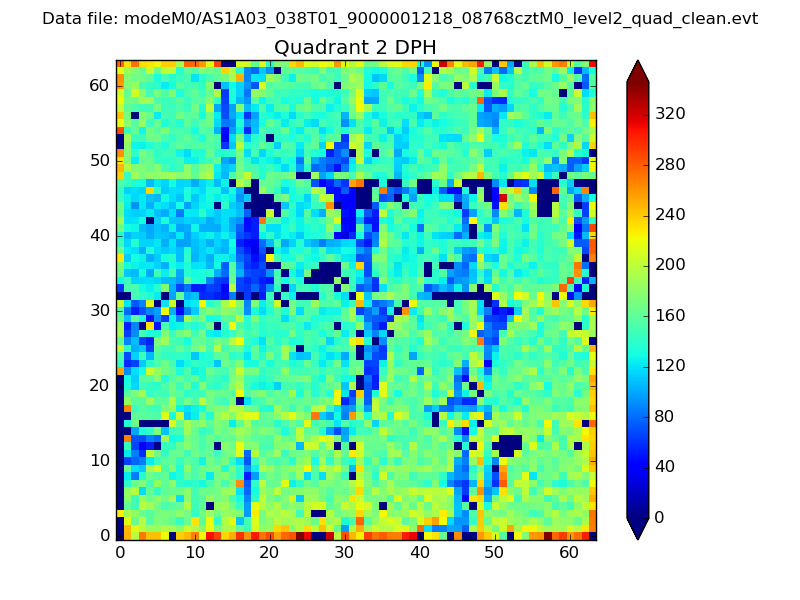 |
Quadrant C |
| Plot type | Count rate plots | Images |
|---|---|---|
| Comparison with Poisson distribution Blue bars denote a histogram of data divided into 1 sec bins. Red curve is a Poisson curve with rate = median count rate of data. |
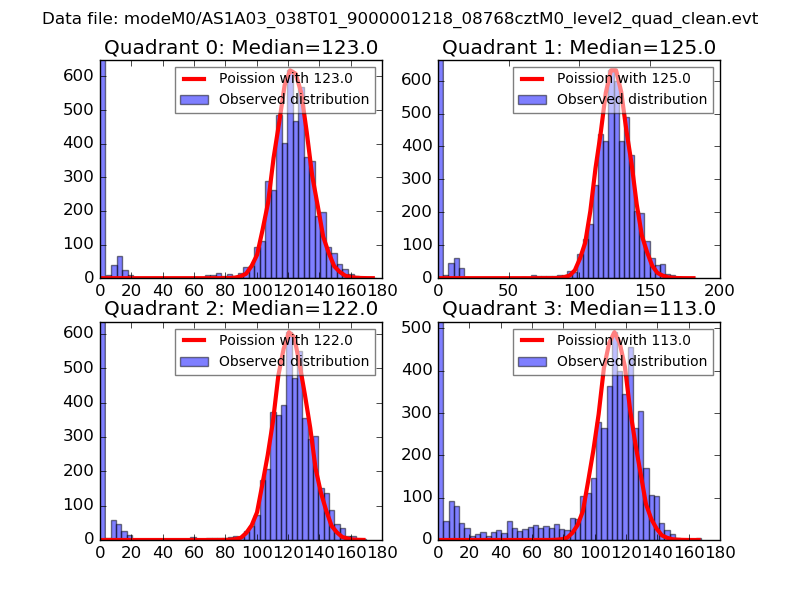 |
 |
| Quadrant-wise count rates Data is divided into 100 sec bins |
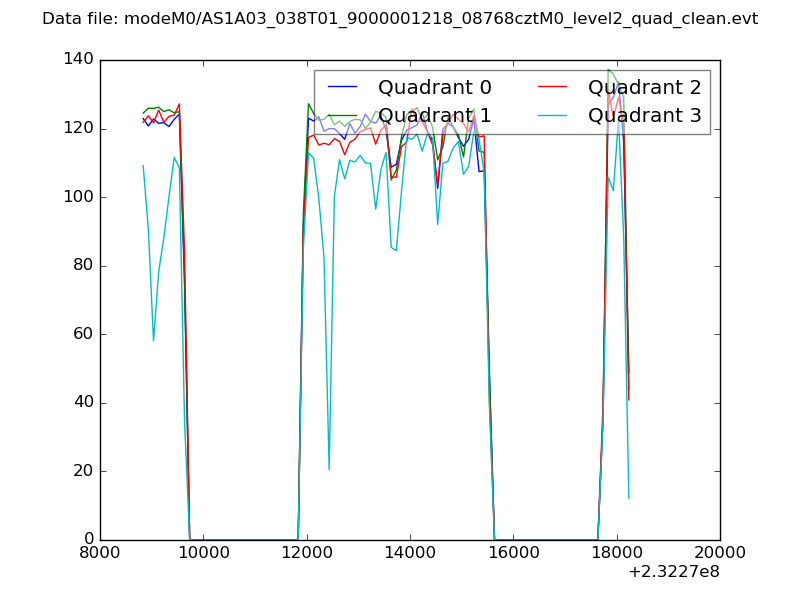 |
|
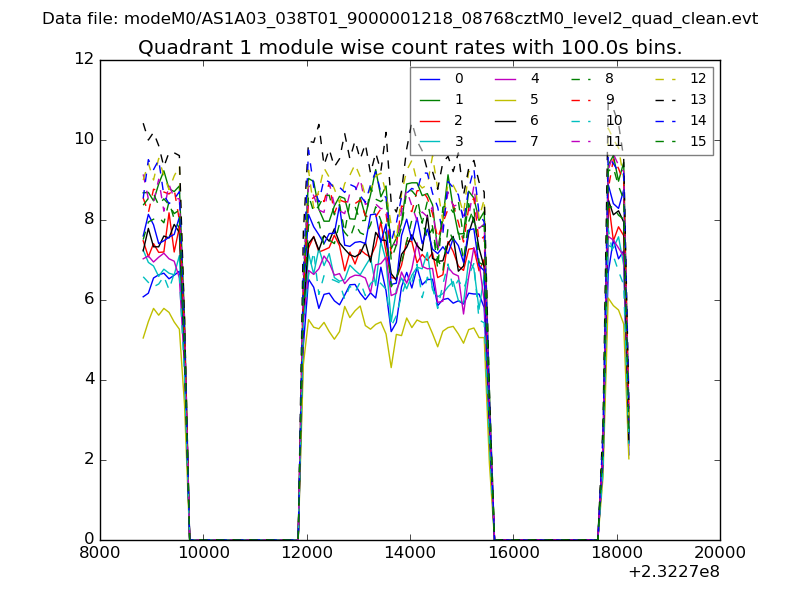
| Module-wise count rates for Quadrant A Data is divided into 100 sec bins |
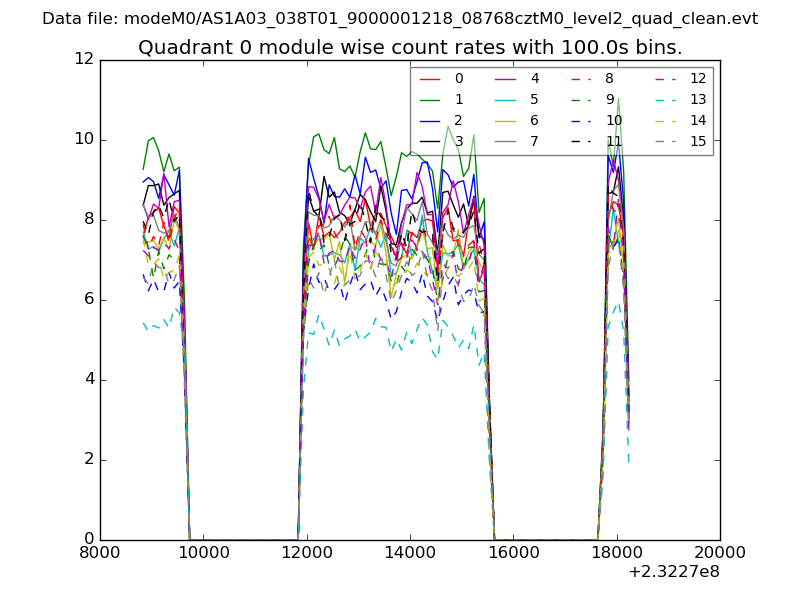 |
 |
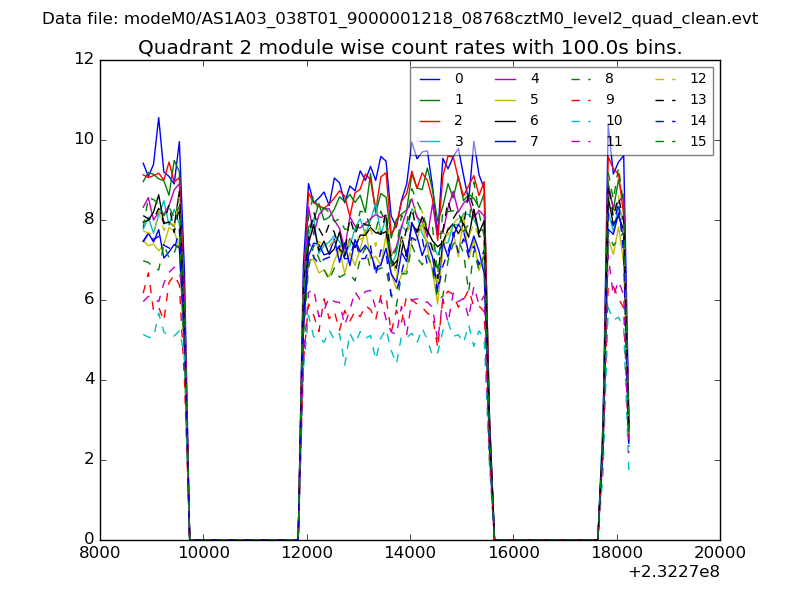
| Module-wise count rates for Quadrant B Data is divided into 100 sec bins |
 |
 |
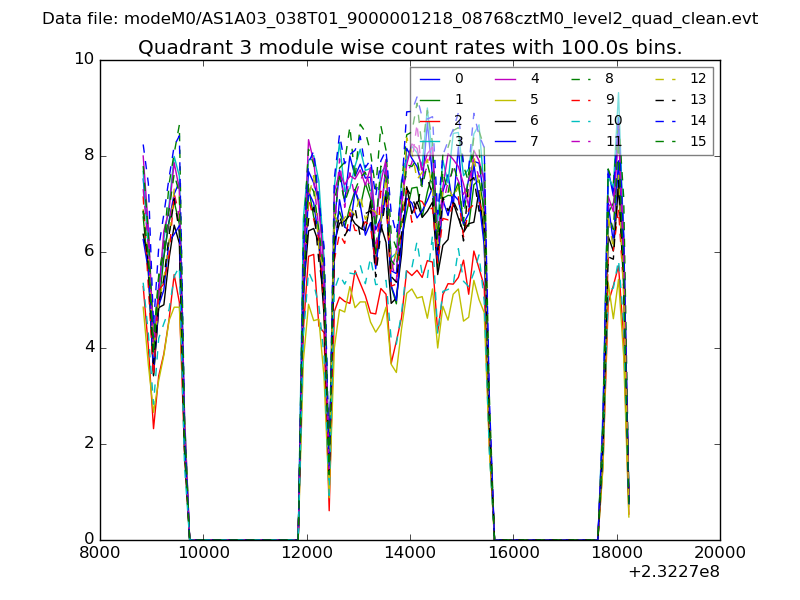
| Module-wise count rates for Quadrant C Data is divided into 100 sec bins |
 |
 |
| Module-wise count rates for Quadrant D Data is divided into 100 sec bins |
 |
 |
| Parameter | Plot |
|---|---|
| CZT HV Monitor | 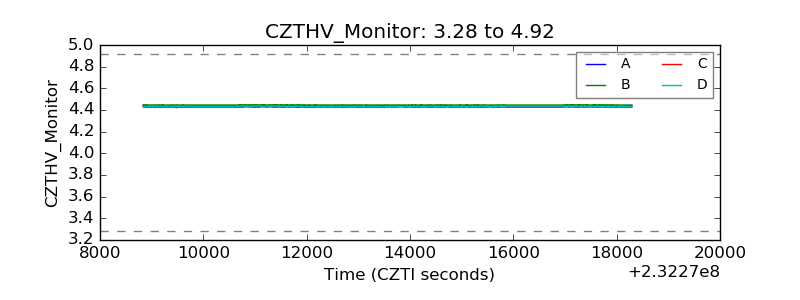 |
| D_VDD | 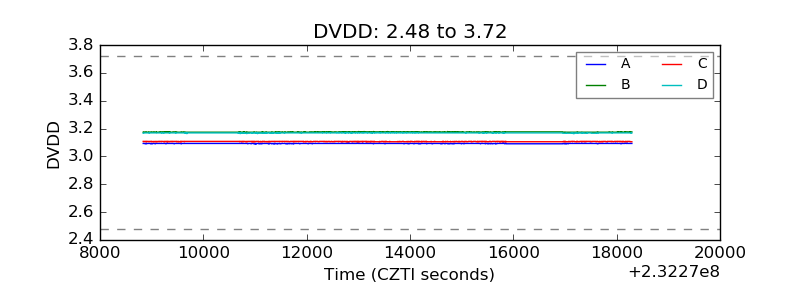 |
| Temperature 1 | 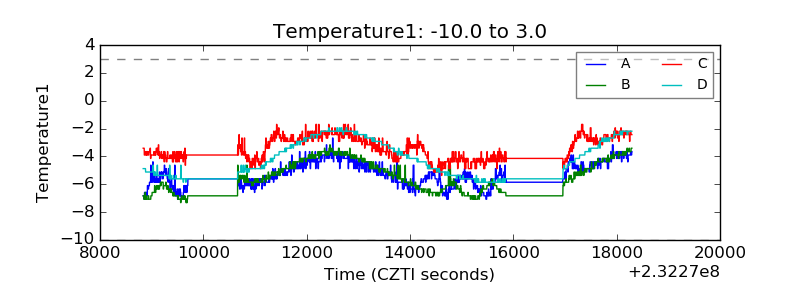 |
| Veto HV Monitor | 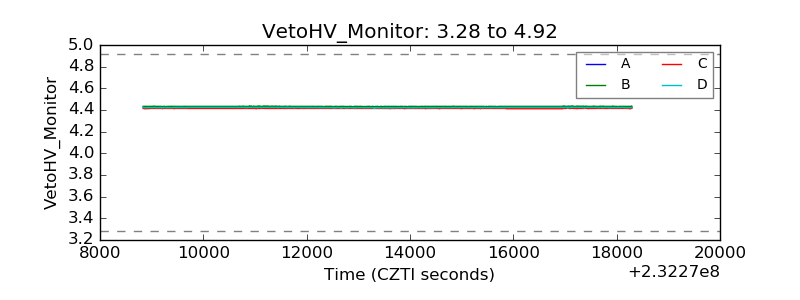 |
| Veto LLD | 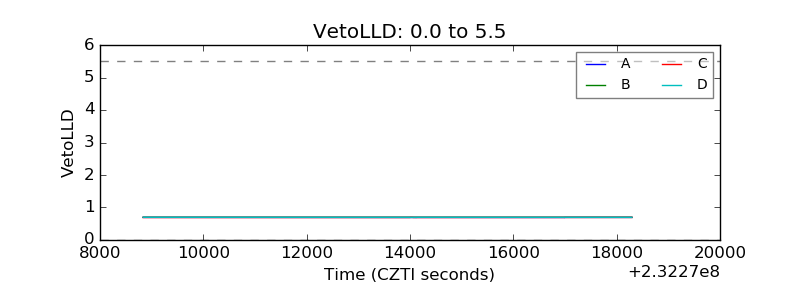 |
| Alpha Counter | 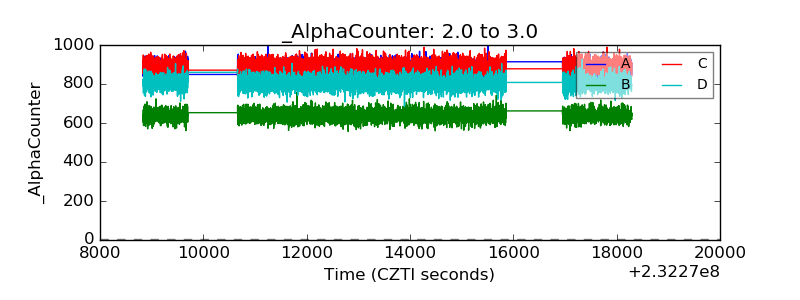 |
| _CPM_Rate | 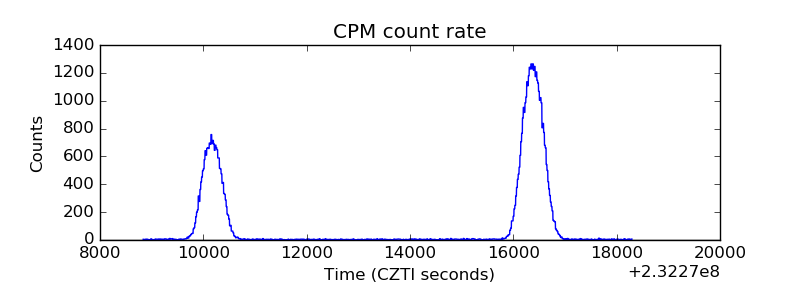 |
| CZT Counter | 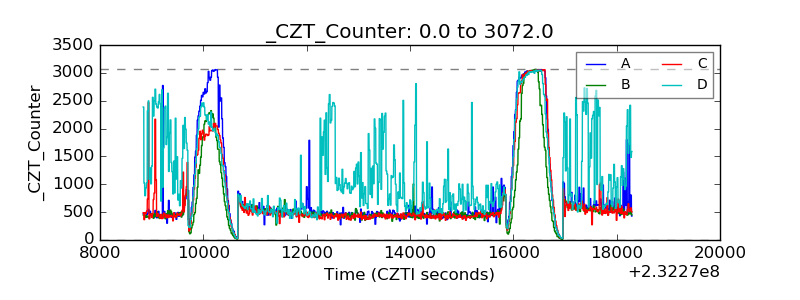 |
| +2.5 Volts monitor |  |
| +5 Volts monitor |  |
| _ROLL_ROT | 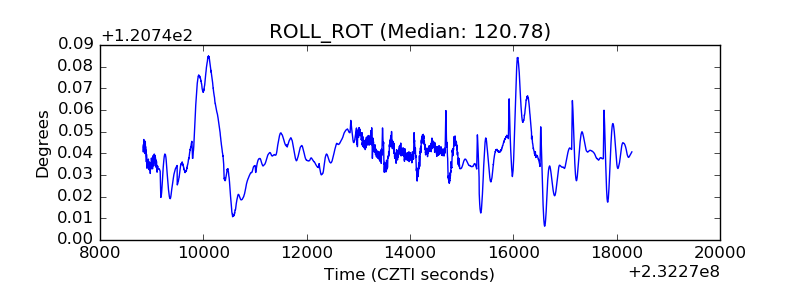 |
| _Roll_DEC | 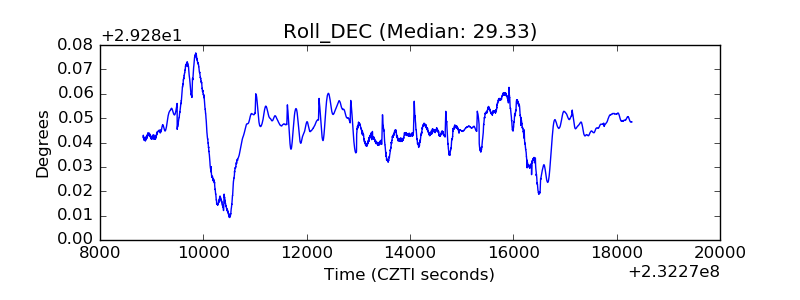 |
| _Roll_RA | 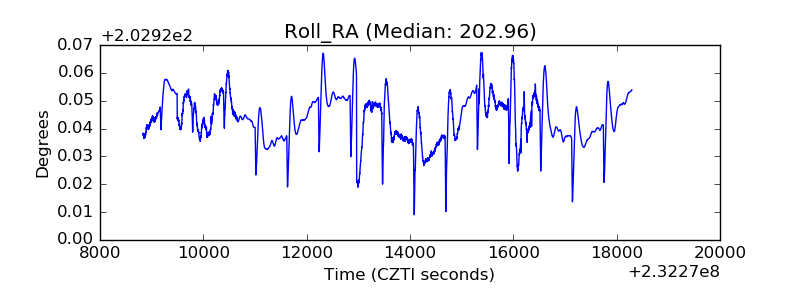 |
| Veto Counter | 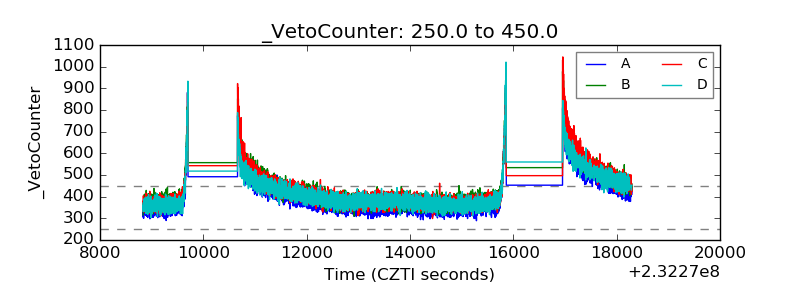 |