| Param | Original file | Final file |
|---|---|---|
| Filename | modeM0/AS1G07_010T01_9000001220cztM0_level2.fits | modeM0/AS1G07_010T01_9000001220cztM0_level2_quad_clean.evt |
| Size (bytes) | 527,996,160 | 434,456,640 |
| Size | 503.5 MB | 414.3 MB |
| Events in quadrant A | 3,205,564 | 2,440,654 |
| Events in quadrant B | 3,101,356 | 2,460,520 |
| Events in quadrant C | 3,187,900 | 2,350,169 |
| Events in quadrant D | 2,654,416 | 2,065,309 |
| Mode SS | |||
|---|---|---|---|
| Quadrant | BADHDUFLAG | Total packets | Discarded packets |
| A | 0 | 1134 | 0 |
| B | 0 | 1134 | 0 |
| C | 0 | 1136 | 0 |
| D | 0 | 1136 | 0 |
| Mode M0 | |||
|---|---|---|---|
| Quadrant | BADHDUFLAG | Total packets | Discarded packets |
| A | 0 | 124972 | 0 |
| B | 0 | 118179 | 0 |
| C | 0 | 117457 | 0 |
| D | 0 | 174313 | 0 |
| Mode M9 | |||
|---|---|---|---|
| Quadrant | BADHDUFLAG | Total packets | Discarded packets |
| A | 0 | 83 | 0 |
| B | 0 | 83 | 0 |
| C | 0 | 83 | 0 |
| D | 0 | 83 | 0 |
| Quadrant | Total seconds | Saturated seconds | Saturation percentage |
|---|---|---|---|
| A | 55974 | 950 | 1.697217% |
| B | 55981 | 775 | 1.384398% |
| C | 55980 | 632 | 1.128975% |
| D | 55972 | 4125 | 7.369756% |
Noise dominated data is calculated using 1-second bins in cleaned event files. If a bin has >2000 counts, and if more than 50% of those come from <1% of pixels, then it is considered to be noise-dominated and hence unusable.
| Quadrant | # 1 sec bins | Bins with >0 counts | Bins with >2000 counts | High rate bins dominated by noise | Noise dominated (total time) | Noise dominated (detector-on time) | Marked lightcurve |
|---|---|---|---|---|---|---|---|
| A | 64125 | 55991 | 0 | 0 | 0.00% | 0.00% |  |
| B | 64125 | 56001 | 0 | 0 | 0.00% | 0.00% |  |
| C | 64125 | 55998 | 0 | 0 | 0.00% | 0.00% |  |
| D | 64125 | 55986 | 0 | 0 | 0.00% | 0.00% |  |
Top three noisy pixels from each quadrant. If the there are fewer than three noisy pixels in the level2.evt file, extra rows are filled as -1
| Pixel properties | Quadrant properties | ||||||
|---|---|---|---|---|---|---|---|
| Quadrant | DetID | PixID | Counts | Sigma | Mean | Median | Sigma |
| A | 0 | 29 | 3148 | 11.26 | 833 | 775 | 210.8 |
| A | 7 | 110 | 2627 | 8.79 | 833 | 775 | 210.8 |
| A | 0 | 30 | 2392 | 7.67 | 833 | 775 | 210.8 |
| B | 2 | 9 | 2764 | 12.11 | 817 | 776 | 164.2 |
| B | 14 | 254 | 2090 | 8.0 | 817 | 776 | 164.2 |
| B | 3 | 17 | 2068 | 7.87 | 817 | 776 | 164.2 |
| C | 1 | 81 | 2321 | 6.91 | 842 | 781 | 222.9 |
| C | 1 | 80 | 2315 | 6.88 | 842 | 781 | 222.9 |
| C | 12 | 241 | 2222 | 6.47 | 842 | 781 | 222.9 |
| D | 6 | 231 | 2040 | 6.64 | 757 | 689 | 203.4 |
| D | 1 | 19 | 1895 | 5.93 | 757 | 689 | 203.4 |
| D | 10 | 189 | 1851 | 5.71 | 757 | 689 | 203.4 |
Histogram calculated using DETX and DETY for each event in the final _common_clean file
| Quadrant A |  |
 |
Quadrant B |
|---|---|---|---|
| Quadrant D |  |
 |
Quadrant C |
| Plot type | Count rate plots | Images |
|---|---|---|
| Comparison with Poisson distribution Blue bars denote a histogram of data divided into 1 sec bins. Red curve is a Poisson curve with rate = median count rate of data. |
 |
 |
| Quadrant-wise count rates Data is divided into 100 sec bins |
 |
|
| Module-wise count rates for Quadrant A Data is divided into 100 sec bins |
 |
 |
| Module-wise count rates for Quadrant B Data is divided into 100 sec bins |
 |
 |
| Module-wise count rates for Quadrant C Data is divided into 100 sec bins |
 |
 |
| Module-wise count rates for Quadrant D Data is divided into 100 sec bins |
 |
 |
| Parameter | Plot |
|---|---|
| CZT HV Monitor |  |
| D_VDD | 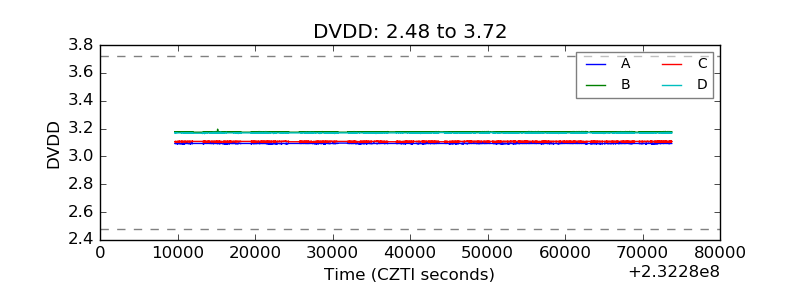 |
| Temperature 1 |  |
| Veto HV Monitor |  |
| Veto LLD |  |
| Alpha Counter |  |
| _CPM_Rate |  |
| CZT Counter |  |
| +2.5 Volts monitor |  |
| +5 Volts monitor |  |
| _ROLL_ROT |  |
| _Roll_DEC |  |
| _Roll_RA |  |
| Veto Counter |  |