| Param | Original file | Final file |
|---|---|---|
| Filename | modeM0/AS1G07_010T01_9000001220_08769cztM0_level2.evt | modeM0/AS1G07_010T01_9000001220_08769cztM0_level2_quad_clean.evt |
| Size (bytes) | 391,711,680 | 57,087,360 |
| Size | 373.6 MB | 54.4 MB |
| Events in quadrant A | 2,132,137 | 382,798 |
| Events in quadrant B | 1,893,481 | 388,562 |
| Events in quadrant C | 1,973,225 | 380,329 |
| Events in quadrant D | 5,606,057 | 308,467 |
| Mode SS | |||
|---|---|---|---|
| Quadrant | BADHDUFLAG | Total packets | Discarded packets |
| A | 0 | 76 | 0 |
| B | 0 | 76 | 0 |
| C | 0 | 76 | 0 |
| D | 0 | 76 | 0 |
| Mode M0 | |||
|---|---|---|---|
| Quadrant | BADHDUFLAG | Total packets | Discarded packets |
| A | 0 | 8797 | 2 |
| B | 0 | 8141 | 1 |
| C | 0 | 8412 | 1 |
| D | 0 | 19285 | 1 |
| Mode M9 | |||
|---|---|---|---|
| Quadrant | BADHDUFLAG | Total packets | Discarded packets |
| A | 0 | 13 | 0 |
| B | 0 | 13 | 0 |
| C | 0 | 13 | 0 |
| D | 0 | 13 | 0 |
| Quadrant | Total seconds | Saturated seconds | Saturation percentage |
|---|---|---|---|
| A | 3797 | 62 | 1.632868% |
| B | 3797 | 49 | 1.290492% |
| C | 3797 | 50 | 1.316829% |
| D | 3797 | 1255 | 33.052410% |
Noise dominated data is calculated using 1-second bins in cleaned event files. If a bin has >2000 counts, and if more than 50% of those come from <1% of pixels, then it is considered to be noise-dominated and hence unusable.
| Quadrant | # 1 sec bins | Bins with >0 counts | Bins with >2000 counts | High rate bins dominated by noise | Noise dominated (total time) | Noise dominated (detector-on time) | Marked lightcurve |
|---|---|---|---|---|---|---|---|
| A | 5027 | 3797 | 10 | 10 | 0.20% | 0.26% | 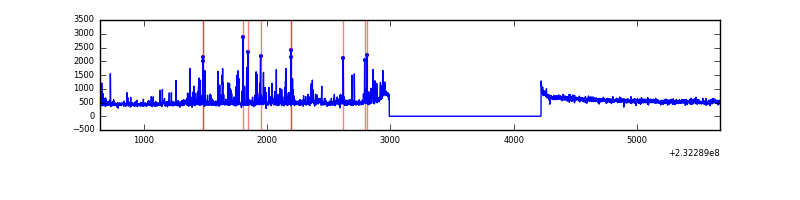 |
| B | 5027 | 3797 | 0 | 0 | 0.00% | 0.00% | 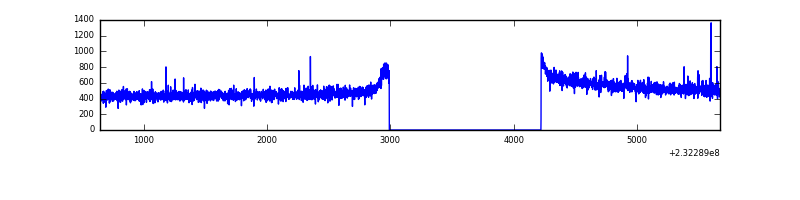 |
| C | 5027 | 3797 | 11 | 11 | 0.22% | 0.29% | 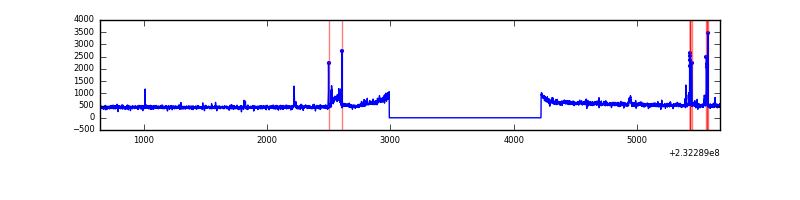 |
| D | 5027 | 3797 | 1152 | 1152 | 22.92% | 30.34% | 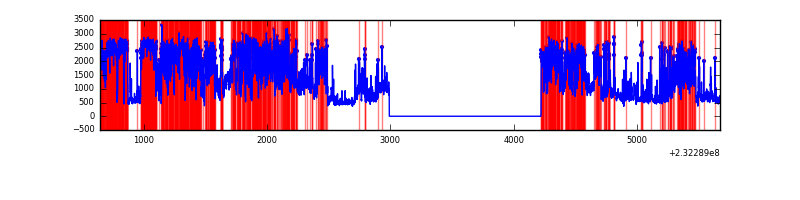 |
Top three noisy pixels from each quadrant. If the there are fewer than three noisy pixels in the level2.evt file, extra rows are filled as -1
| Pixel properties | Quadrant properties | ||||||
|---|---|---|---|---|---|---|---|
| Quadrant | DetID | PixID | Counts | Sigma | Mean | Median | Sigma |
| A | 8 | 5 | 208044 | 2112.51 | 488 | 480 | 98.3 |
| A | 13 | 251 | 30931 | 309.92 | 488 | 480 | 98.3 |
| A | 13 | 248 | 4927 | 45.26 | 488 | 480 | 98.3 |
| B | 12 | 111 | 9976 | 101.55 | 485 | 474 | 93.6 |
| B | 11 | 111 | 8419 | 84.91 | 485 | 474 | 93.6 |
| B | 10 | 16 | 6595 | 65.41 | 485 | 474 | 93.6 |
| C | 9 | 68 | 84611 | 763.85 | 474 | 478 | 110.1 |
| C | 14 | 234 | 38783 | 347.77 | 474 | 478 | 110.1 |
| C | 13 | 61 | 3561 | 27.99 | 474 | 478 | 110.1 |
| D | 2 | 16 | 3866157 | 36086.33 | 413 | 404 | 107.1 |
| D | 2 | 14 | 44330 | 410.04 | 413 | 404 | 107.1 |
| D | 5 | 233 | 41480 | 383.44 | 413 | 404 | 107.1 |
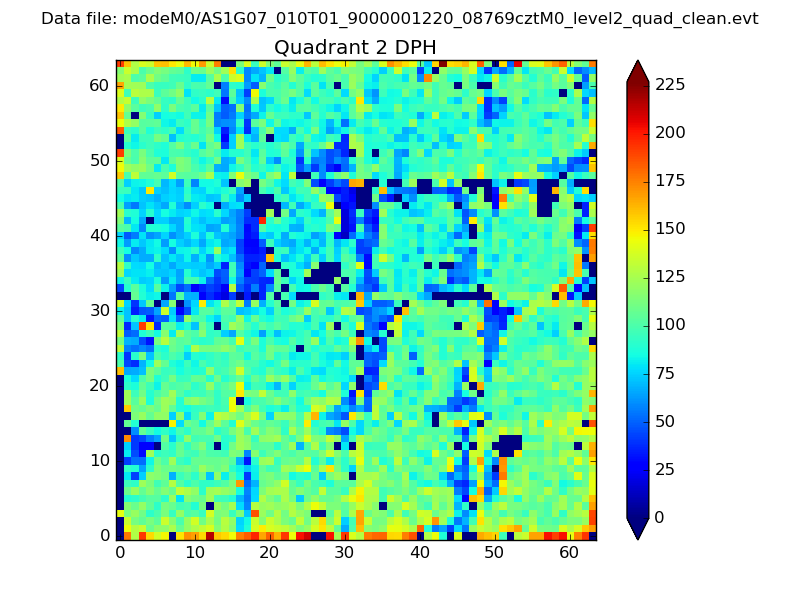
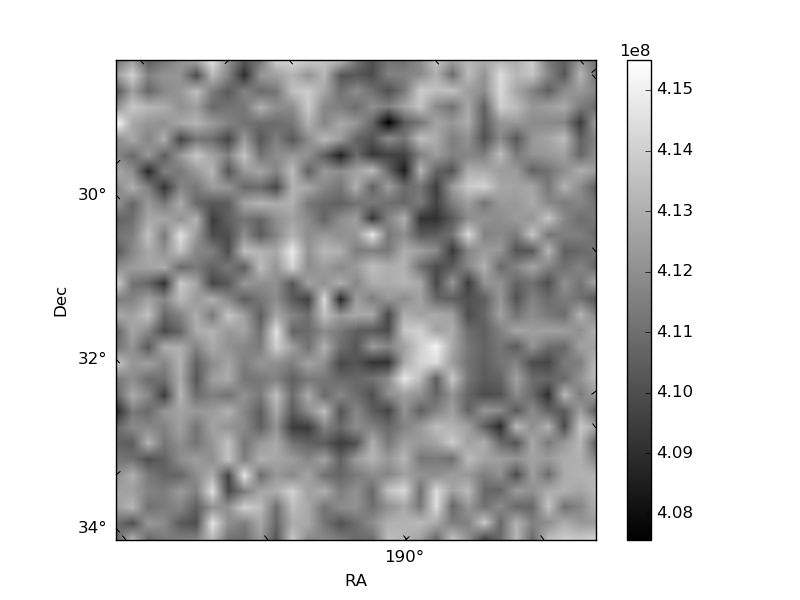
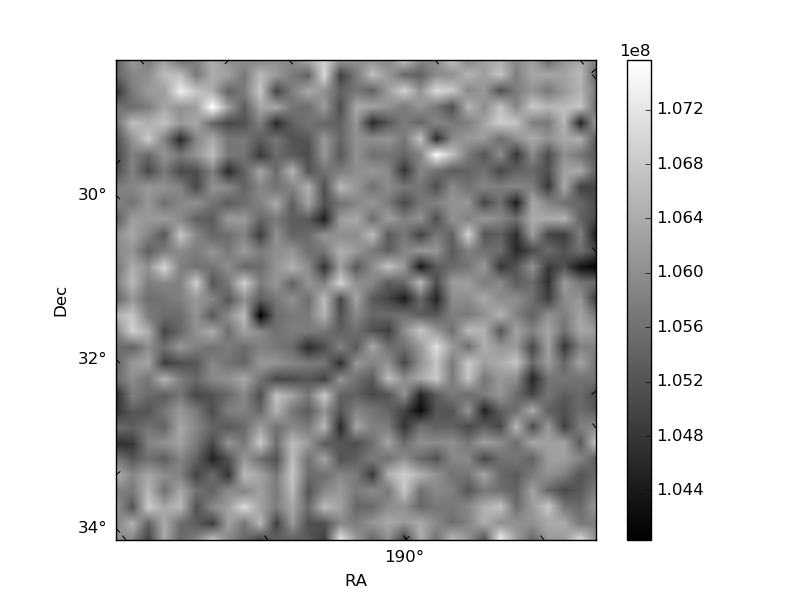
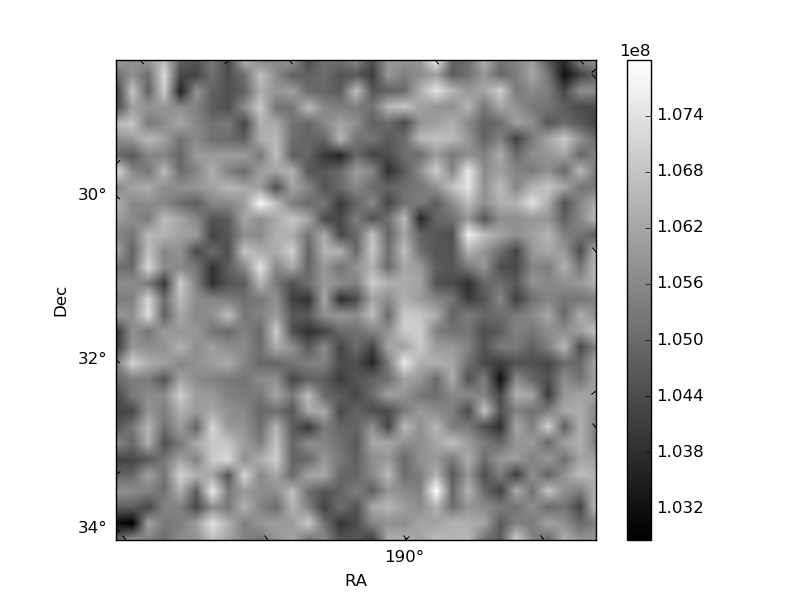
Histogram calculated using DETX and DETY for each event in the final _common_clean file
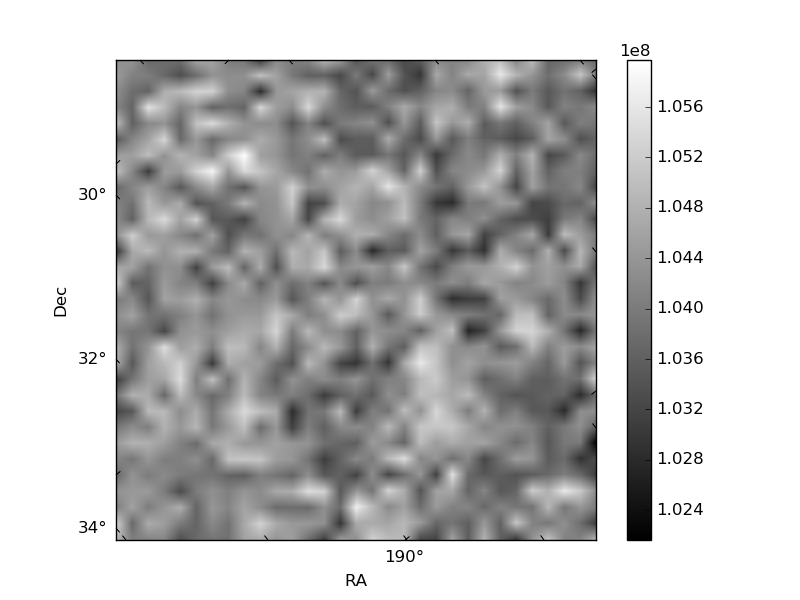
| Quadrant A | 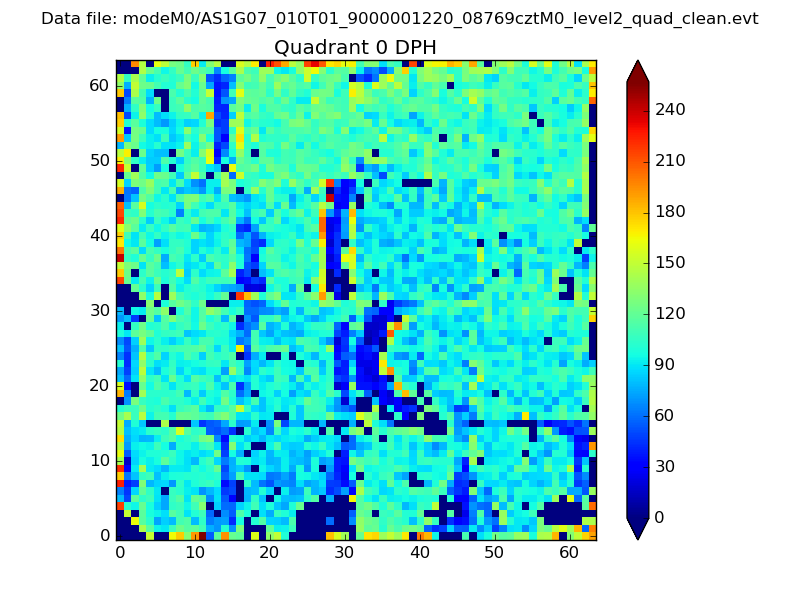 |
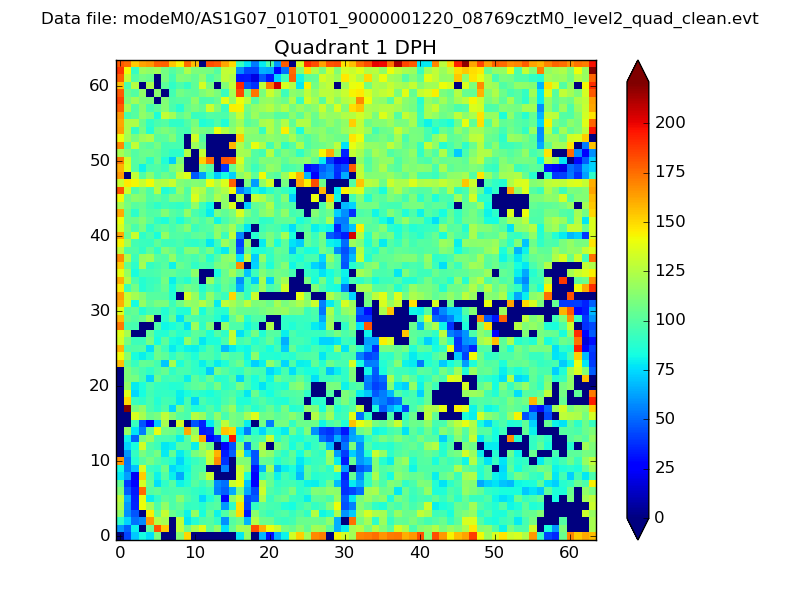 |
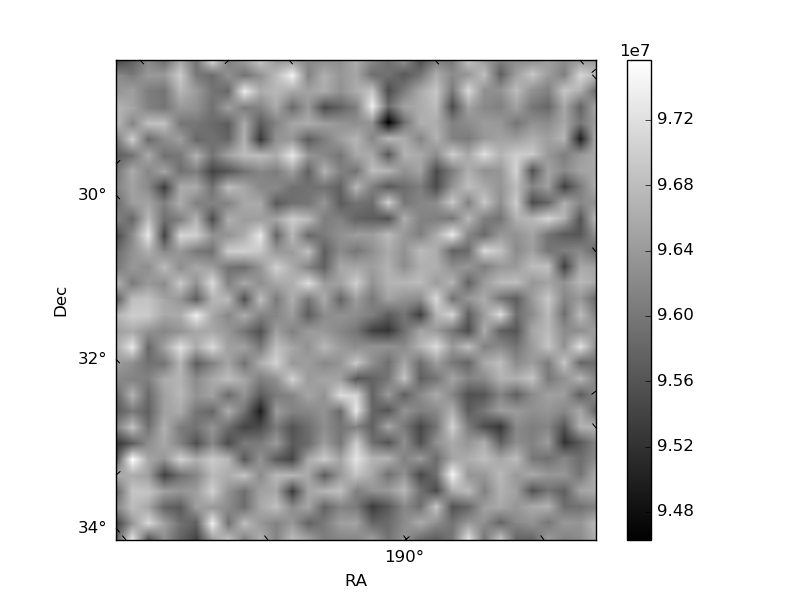
Quadrant B |
|---|---|---|---|
| Quadrant D | 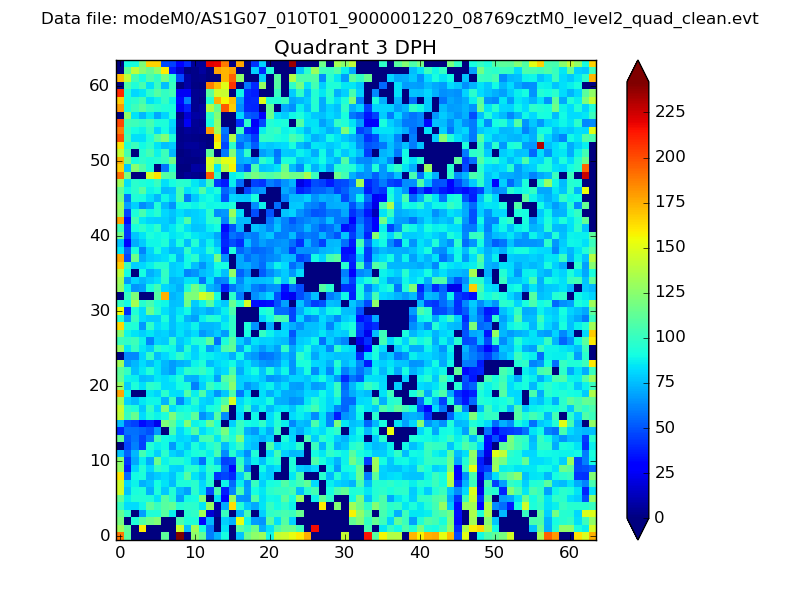 |
 |
Quadrant C |
| Plot type | Count rate plots | Images |
|---|---|---|
| Comparison with Poisson distribution Blue bars denote a histogram of data divided into 1 sec bins. Red curve is a Poisson curve with rate = median count rate of data. |
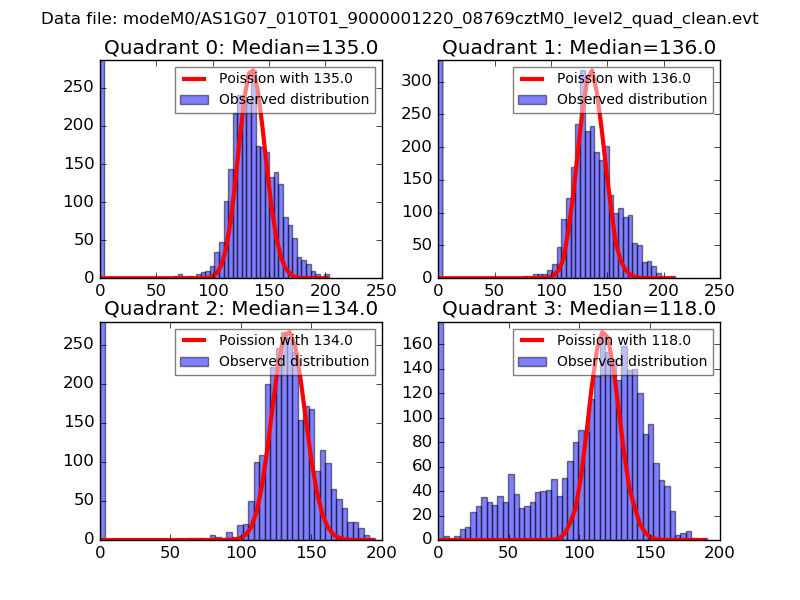 |
 |
| Quadrant-wise count rates Data is divided into 100 sec bins |
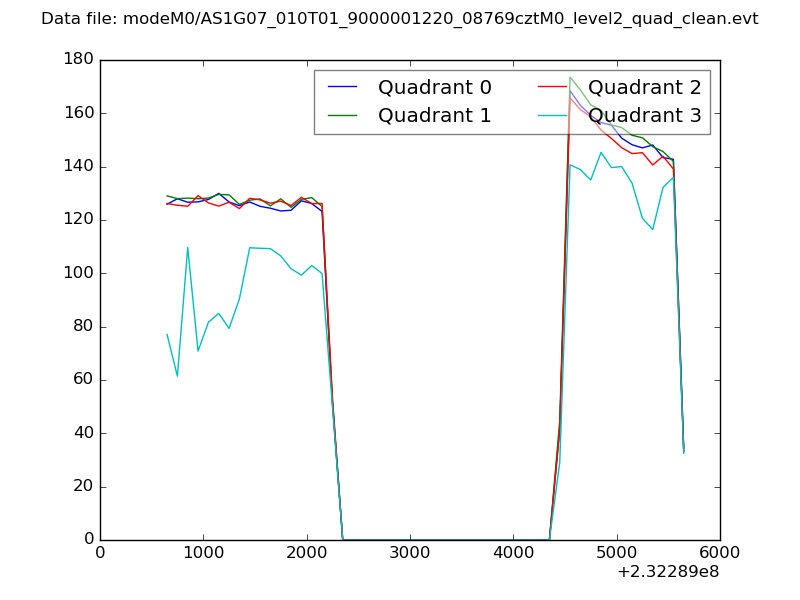 |
|
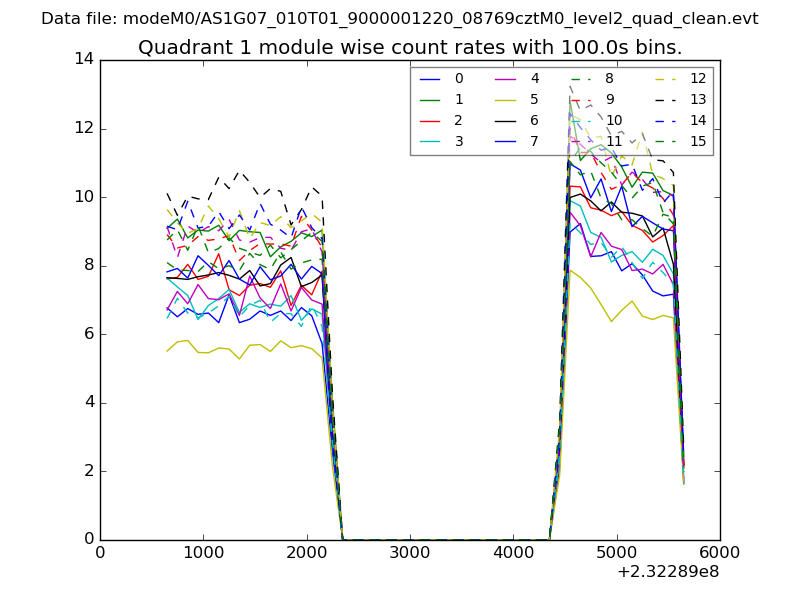
| Module-wise count rates for Quadrant A Data is divided into 100 sec bins |
 |
 |
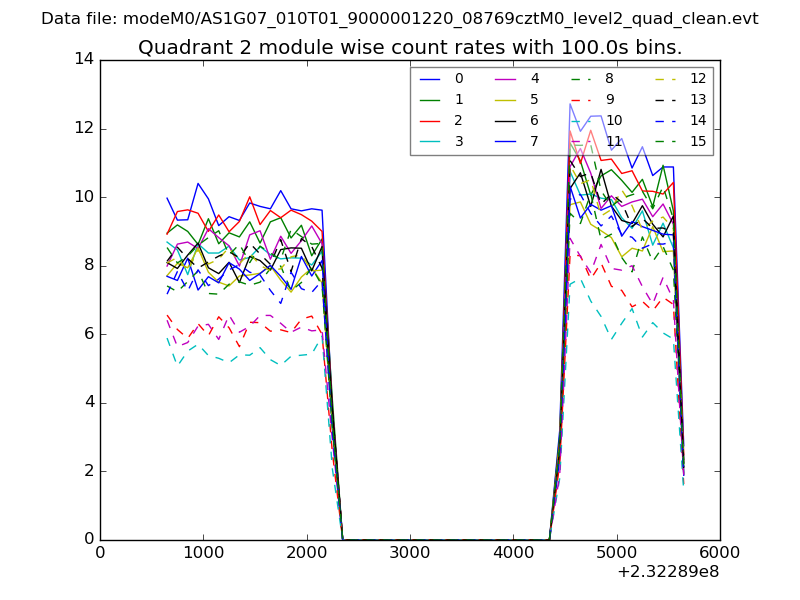
| Module-wise count rates for Quadrant B Data is divided into 100 sec bins |
 |
 |
| Module-wise count rates for Quadrant C Data is divided into 100 sec bins |
 |
 |
| Module-wise count rates for Quadrant D Data is divided into 100 sec bins |
 |
 |
| Parameter | Plot |
|---|---|
| CZT HV Monitor | 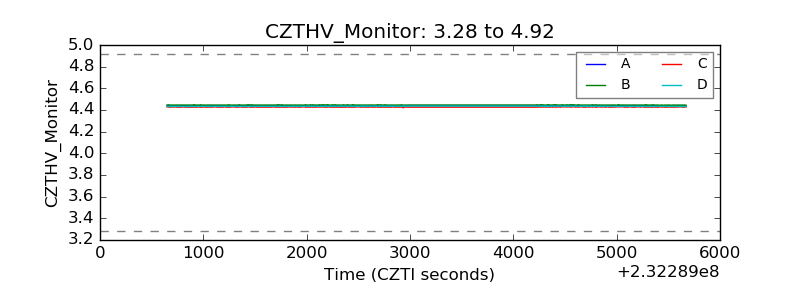 |
| D_VDD | 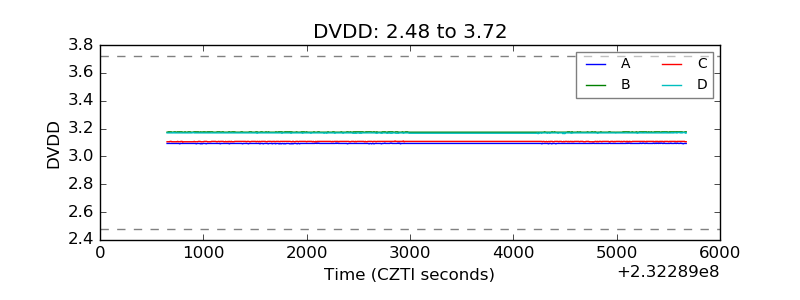 |
| Temperature 1 | 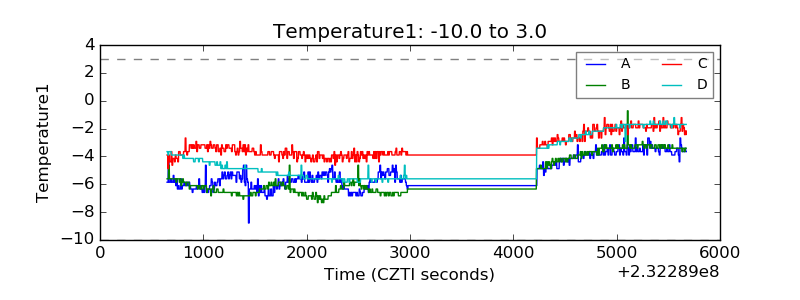 |
| Veto HV Monitor | 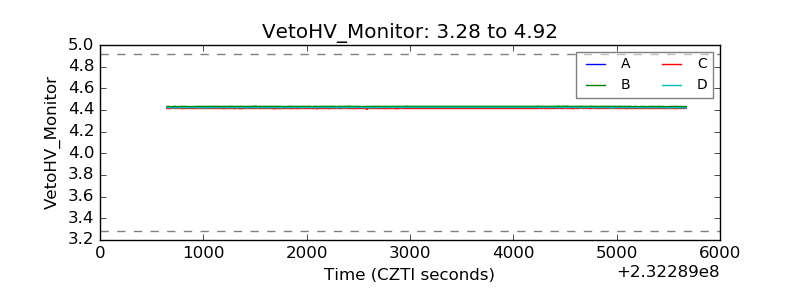 |
| Veto LLD | 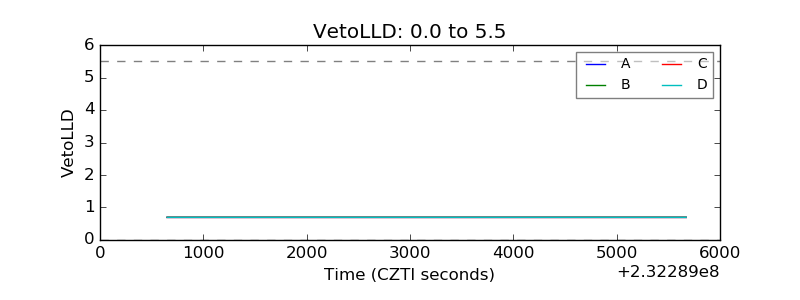 |
| Alpha Counter | 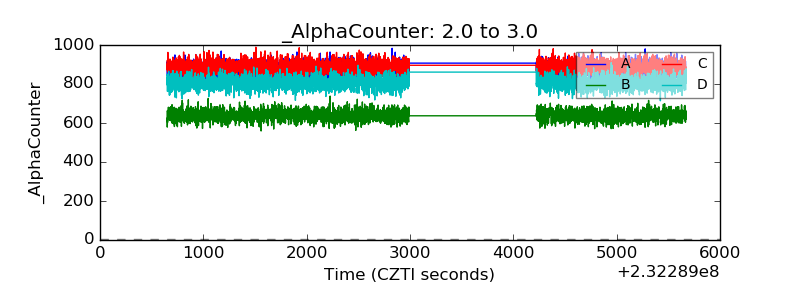 |
| _CPM_Rate | 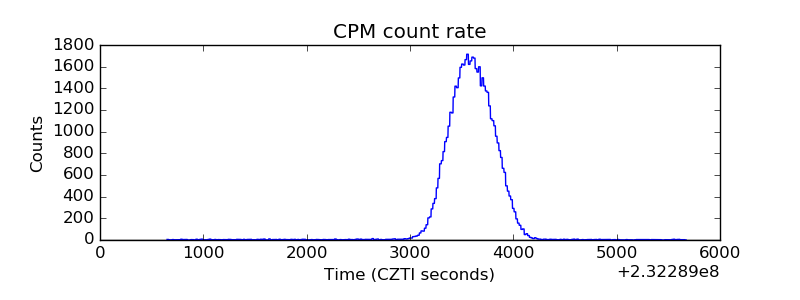 |
| CZT Counter | 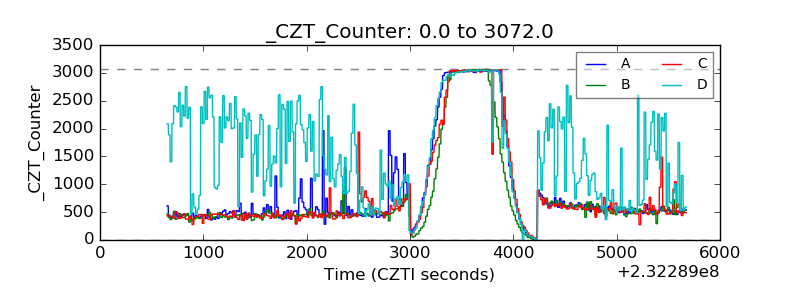 |
| +2.5 Volts monitor | 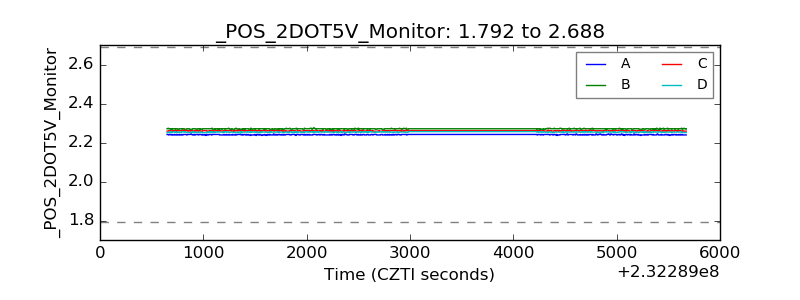 |
| +5 Volts monitor |  |
| _ROLL_ROT | 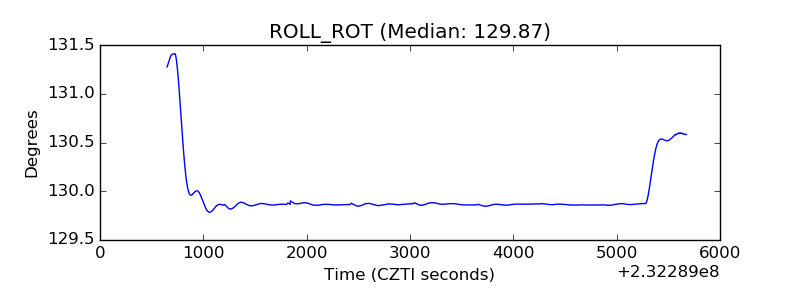 |
| _Roll_DEC | 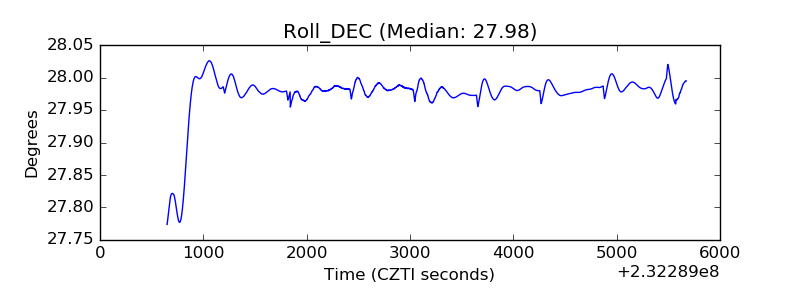 |
| _Roll_RA | 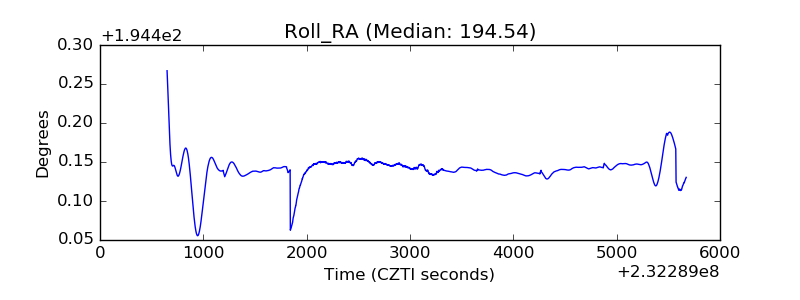 |
| Veto Counter | 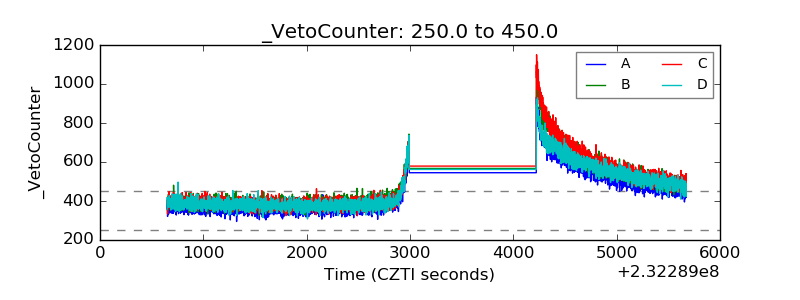 |