| Param | Original file | Final file |
|---|---|---|
| Filename | modeM0/AS1G07_010T01_9000001220_08770cztM0_level2.evt | modeM0/AS1G07_010T01_9000001220_08770cztM0_level2_quad_clean.evt |
| Size (bytes) | 522,763,200 | 109,748,160 |
| Size | 498.5 MB | 104.7 MB |
| Events in quadrant A | 3,207,164 | 740,955 |
| Events in quadrant B | 3,176,181 | 745,811 |
| Events in quadrant C | 3,123,566 | 734,062 |
| Events in quadrant D | 5,904,276 | 669,810 |
| Mode SS | |||
|---|---|---|---|
| Quadrant | BADHDUFLAG | Total packets | Discarded packets |
| A | 0 | 126 | 0 |
| B | 0 | 126 | 0 |
| C | 0 | 126 | 0 |
| D | 0 | 126 | 0 |
| Mode M0 | |||
|---|---|---|---|
| Quadrant | BADHDUFLAG | Total packets | Discarded packets |
| A | 0 | 13436 | 2 |
| B | 0 | 13346 | 1 |
| C | 0 | 13196 | 1 |
| D | 0 | 21798 | 1 |
| Mode M9 | |||
|---|---|---|---|
| Quadrant | BADHDUFLAG | Total packets | Discarded packets |
| A | 0 | 13 | 0 |
| B | 0 | 13 | 0 |
| C | 0 | 13 | 0 |
| D | 0 | 13 | 0 |
| Quadrant | Total seconds | Saturated seconds | Saturation percentage |
|---|---|---|---|
| A | 6205 | 88 | 1.418211% |
| B | 6205 | 71 | 1.144239% |
| C | 6205 | 73 | 1.176471% |
| D | 6205 | 801 | 12.908944% |
Noise dominated data is calculated using 1-second bins in cleaned event files. If a bin has >2000 counts, and if more than 50% of those come from <1% of pixels, then it is considered to be noise-dominated and hence unusable.
| Quadrant | # 1 sec bins | Bins with >0 counts | Bins with >2000 counts | High rate bins dominated by noise | Noise dominated (total time) | Noise dominated (detector-on time) | Marked lightcurve |
|---|---|---|---|---|---|---|---|
| A | 7490 | 6205 | 0 | 0 | 0.00% | 0.00% | 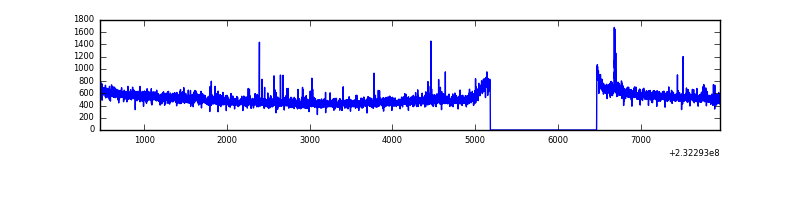 |
| B | 7490 | 6205 | 3 | 3 | 0.04% | 0.05% | 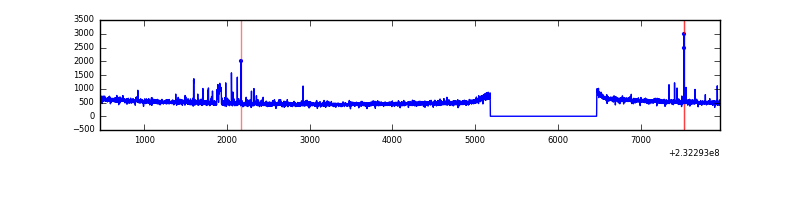 |
| C | 7490 | 6205 | 10 | 10 | 0.13% | 0.16% | 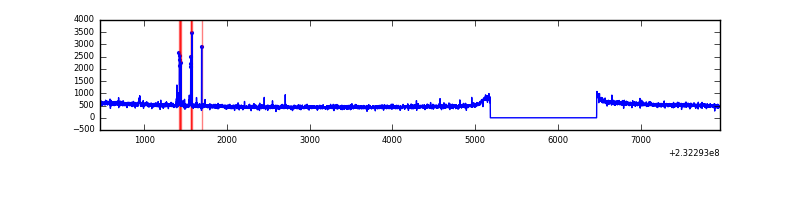 |
| D | 7490 | 6205 | 680 | 680 | 9.08% | 10.96% | 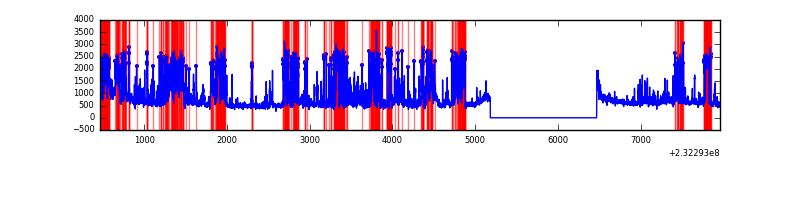 |
Top three noisy pixels from each quadrant. If the there are fewer than three noisy pixels in the level2.evt file, extra rows are filled as -1
| Pixel properties | Quadrant properties | ||||||
|---|---|---|---|---|---|---|---|
| Quadrant | DetID | PixID | Counts | Sigma | Mean | Median | Sigma |
| A | 8 | 5 | 47937 | 291.81 | 806 | 790 | 161.6 |
| A | 13 | 251 | 18187 | 107.67 | 806 | 790 | 161.6 |
| A | 13 | 248 | 16894 | 99.67 | 806 | 790 | 161.6 |
| B | 10 | 16 | 42773 | 279.46 | 798 | 780 | 150.3 |
| B | 5 | 255 | 32176 | 208.94 | 798 | 780 | 150.3 |
| B | 12 | 111 | 15956 | 101.0 | 798 | 780 | 150.3 |
| C | 14 | 234 | 43825 | 237.39 | 786 | 790 | 181.3 |
| C | 9 | 68 | 13175 | 68.32 | 786 | 790 | 181.3 |
| C | 13 | 61 | 5856 | 27.95 | 786 | 790 | 181.3 |
| D | 2 | 16 | 2226714 | 12032.05 | 753 | 736 | 185.0 |
| D | 13 | 122 | 425716 | 2297.14 | 753 | 736 | 185.0 |
| D | 2 | 152 | 151945 | 817.33 | 753 | 736 | 185.0 |
Histogram calculated using DETX and DETY for each event in the final _common_clean file
| Quadrant A | 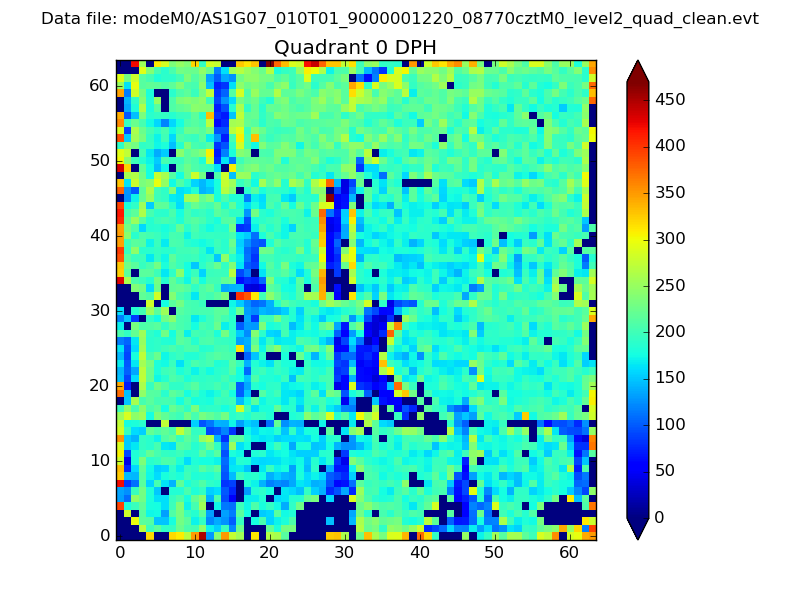 |
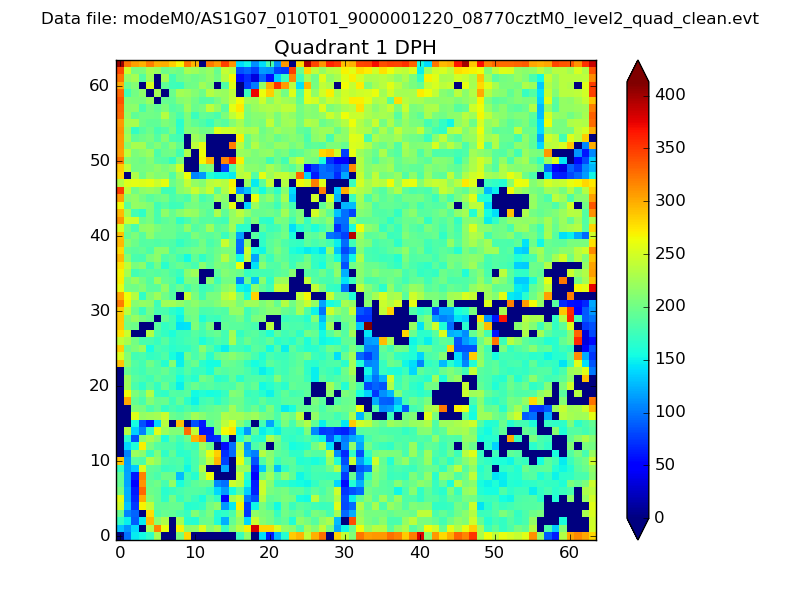 |
Quadrant B |
|---|---|---|---|
| Quadrant D |  |
 |
Quadrant C |
| Plot type | Count rate plots | Images |
|---|---|---|
| Comparison with Poisson distribution Blue bars denote a histogram of data divided into 1 sec bins. Red curve is a Poisson curve with rate = median count rate of data. |
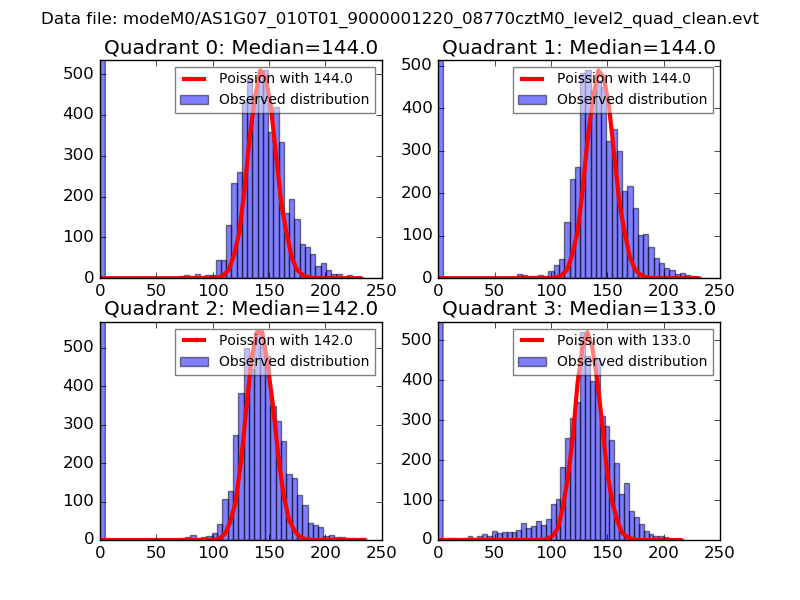 |
 |
| Quadrant-wise count rates Data is divided into 100 sec bins |
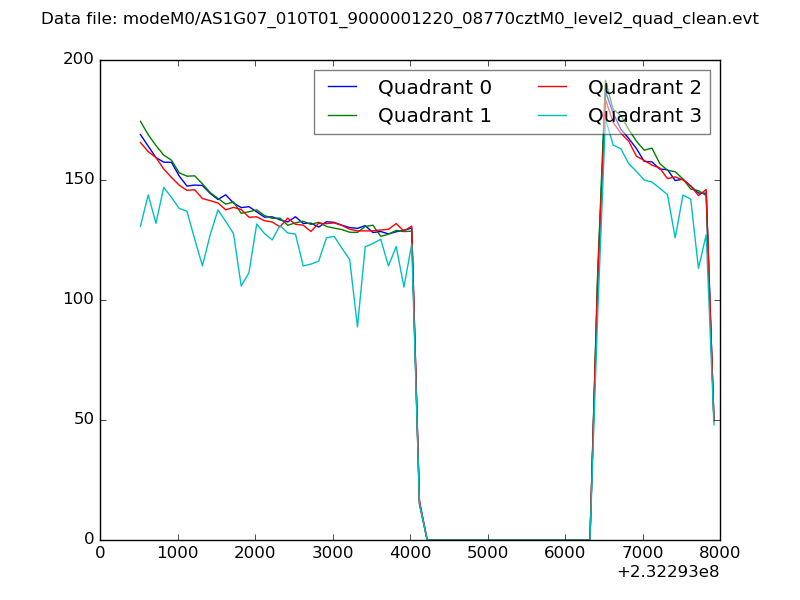 |
|
| Module-wise count rates for Quadrant A Data is divided into 100 sec bins |
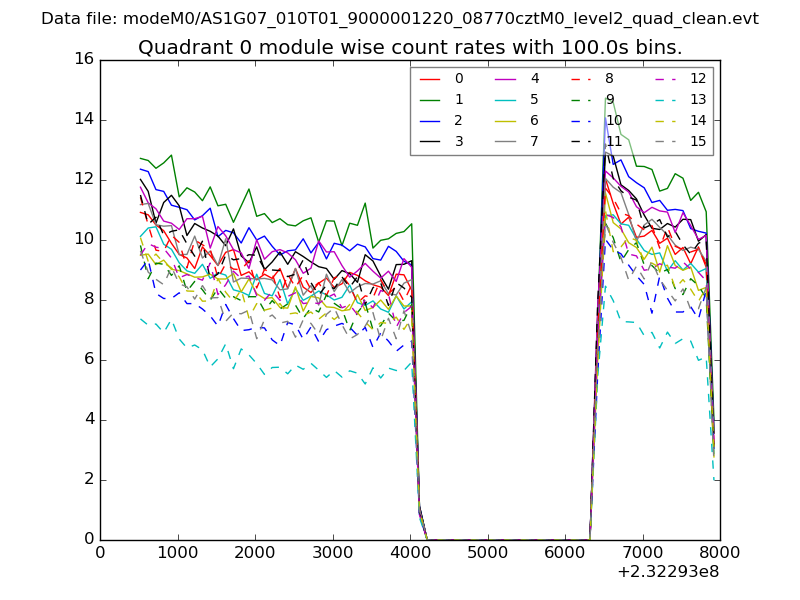 |
 |
| Module-wise count rates for Quadrant B Data is divided into 100 sec bins |
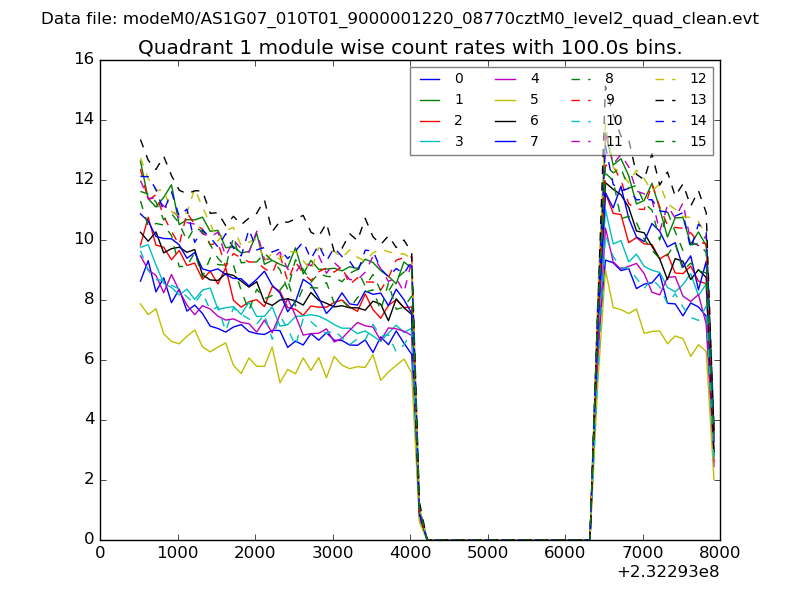 |
 |
| Module-wise count rates for Quadrant C Data is divided into 100 sec bins |
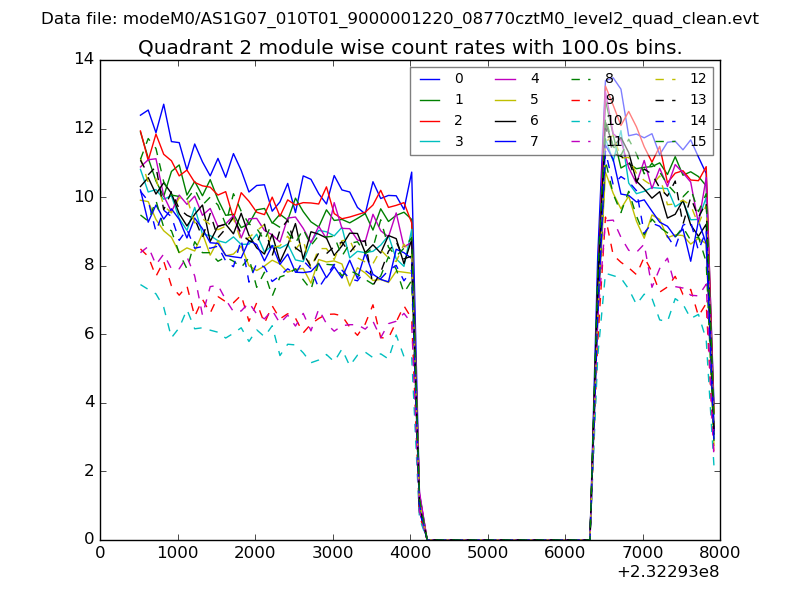 |
 |
| Module-wise count rates for Quadrant D Data is divided into 100 sec bins |
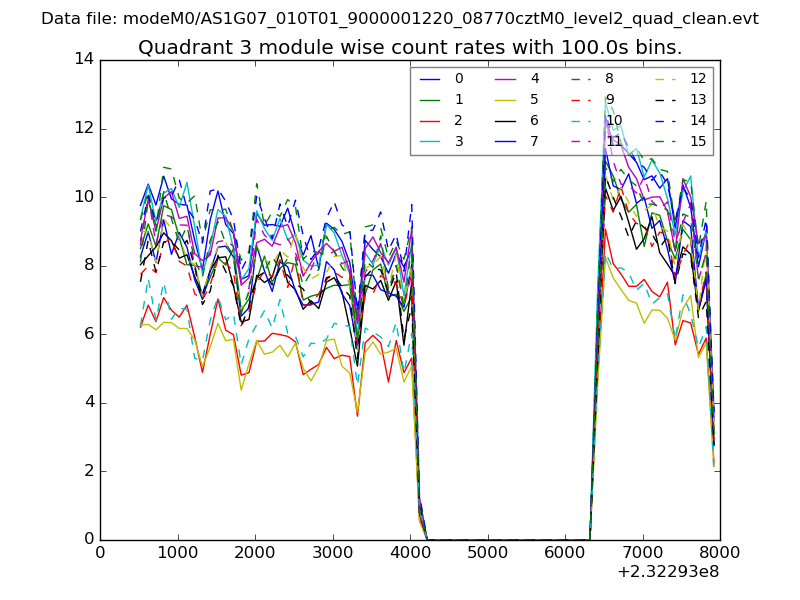 |
 |
| Parameter | Plot |
|---|---|
| CZT HV Monitor | 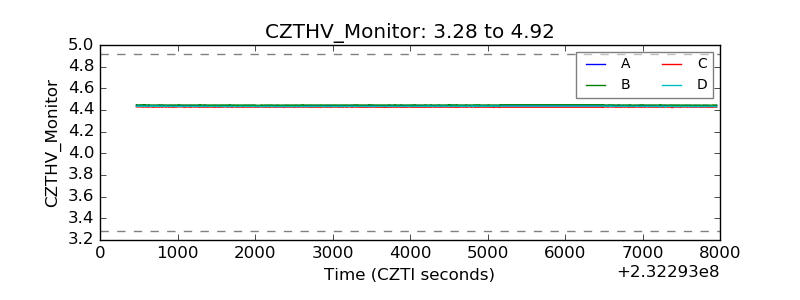 |
| D_VDD | 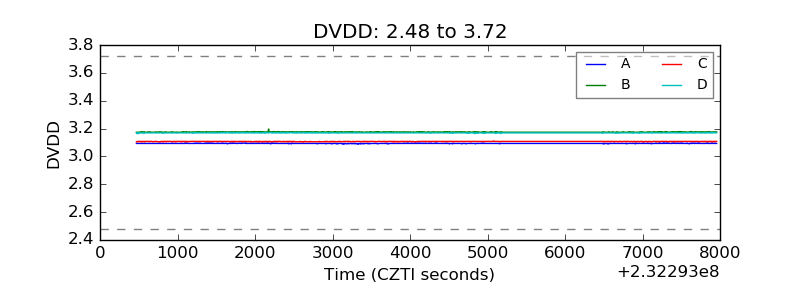 |
| Temperature 1 | 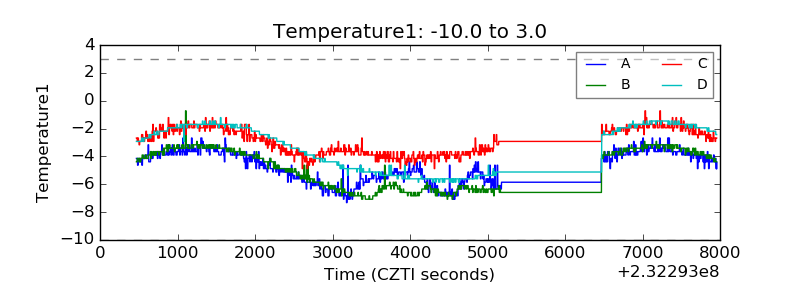 |
| Veto HV Monitor | 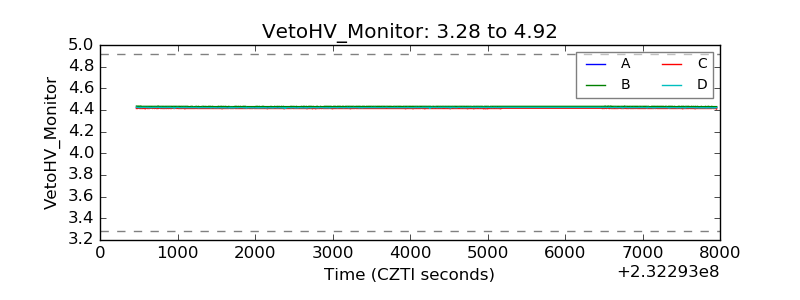 |
| Veto LLD | 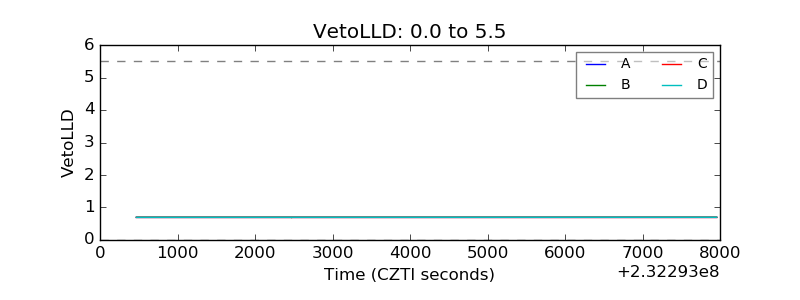 |
| Alpha Counter | 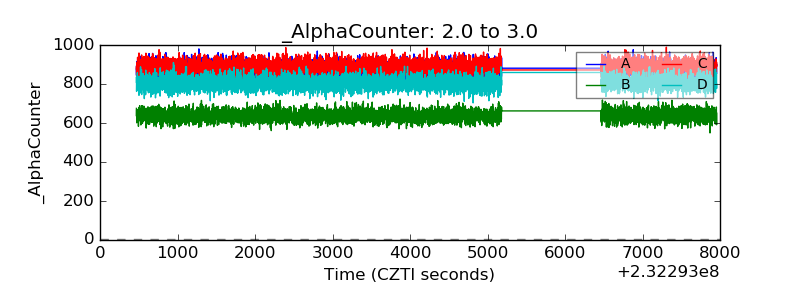 |
| _CPM_Rate | 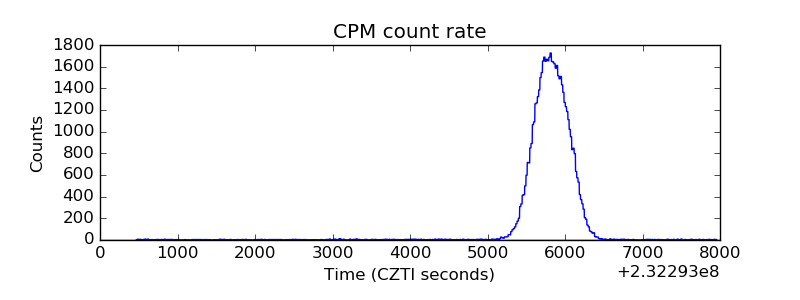 |
| CZT Counter | 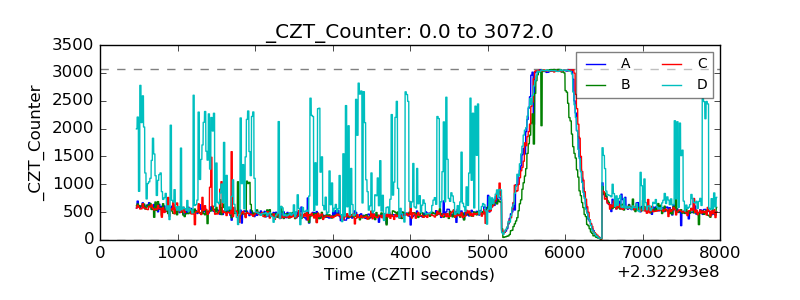 |
| +2.5 Volts monitor |  |
| +5 Volts monitor |  |
| _ROLL_ROT | 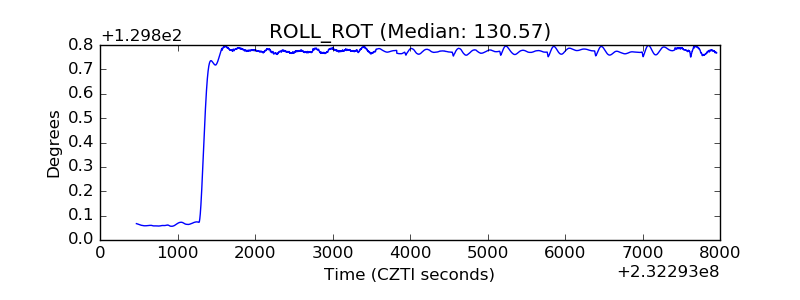 |
| _Roll_DEC | 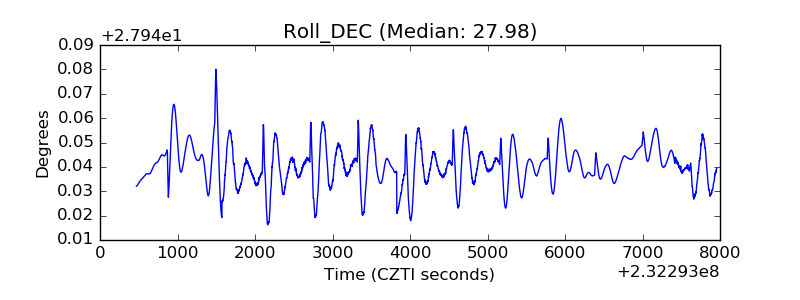 |
| _Roll_RA | 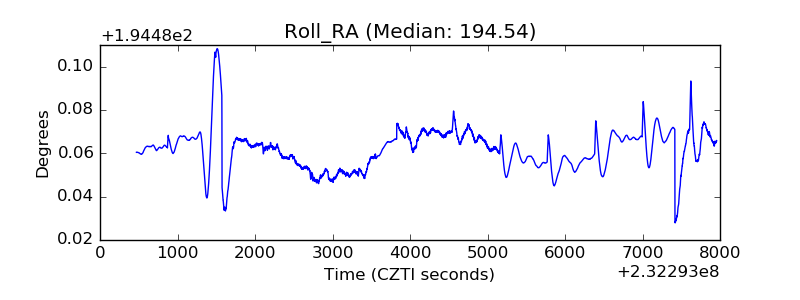 |
| Veto Counter | 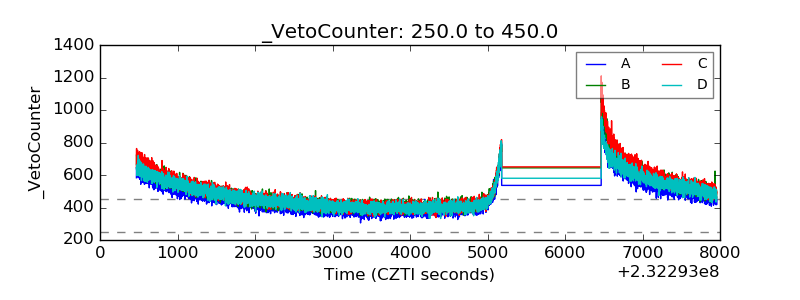 |