| Param | Original file | Final file |
|---|---|---|
| Filename | modeM0/AS1G07_010T01_9000001220_08771cztM0_level2.evt | modeM0/AS1G07_010T01_9000001220_08771cztM0_level2_quad_clean.evt |
| Size (bytes) | 474,042,240 | 105,465,600 |
| Size | 452.1 MB | 100.6 MB |
| Events in quadrant A | 3,420,382 | 697,706 |
| Events in quadrant B | 3,133,653 | 707,254 |
| Events in quadrant C | 3,115,330 | 698,866 |
| Events in quadrant D | 4,269,884 | 661,131 |
| Mode SS | |||
|---|---|---|---|
| Quadrant | BADHDUFLAG | Total packets | Discarded packets |
| A | 0 | 124 | 0 |
| B | 0 | 124 | 0 |
| C | 0 | 124 | 0 |
| D | 0 | 124 | 0 |
| Mode M0 | |||
|---|---|---|---|
| Quadrant | BADHDUFLAG | Total packets | Discarded packets |
| A | 0 | 14116 | 3 |
| B | 0 | 13199 | 2 |
| C | 0 | 13132 | 2 |
| D | 0 | 16811 | 2 |
| Mode M9 | |||
|---|---|---|---|
| Quadrant | BADHDUFLAG | Total packets | Discarded packets |
| A | 0 | 23 | 0 |
| B | 0 | 23 | 0 |
| C | 0 | 23 | 0 |
| D | 0 | 24 | 0 |
| Quadrant | Total seconds | Saturated seconds | Saturation percentage |
|---|---|---|---|
| A | 6151 | 79 | 1.284344% |
| B | 6151 | 81 | 1.316859% |
| C | 6151 | 66 | 1.072996% |
| D | 6151 | 212 | 3.446594% |
Noise dominated data is calculated using 1-second bins in cleaned event files. If a bin has >2000 counts, and if more than 50% of those come from <1% of pixels, then it is considered to be noise-dominated and hence unusable.
| Quadrant | # 1 sec bins | Bins with >0 counts | Bins with >2000 counts | High rate bins dominated by noise | Noise dominated (total time) | Noise dominated (detector-on time) | Marked lightcurve |
|---|---|---|---|---|---|---|---|
| A | 7486 | 6151 | 1 | 1 | 0.01% | 0.02% | 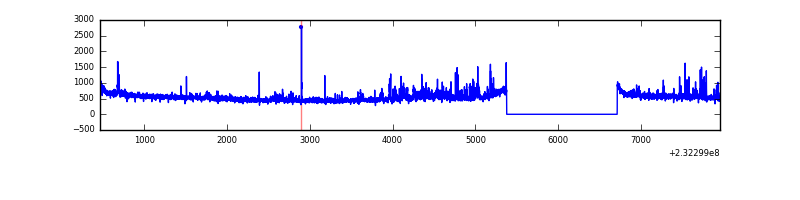 |
| B | 7486 | 6151 | 6 | 6 | 0.08% | 0.10% | 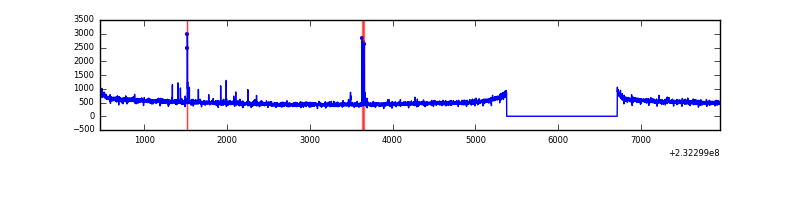 |
| C | 7486 | 6151 | 5 | 5 | 0.07% | 0.08% | 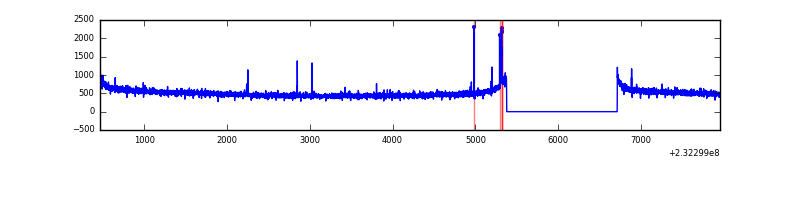 |
| D | 7486 | 6151 | 147 | 147 | 1.96% | 2.39% | 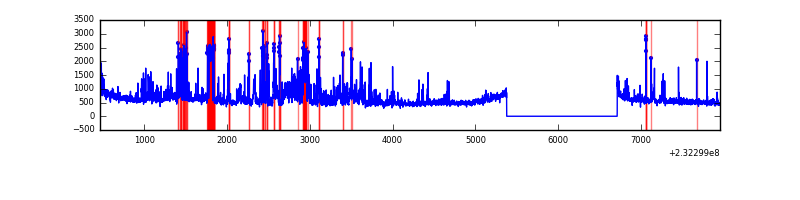 |
Top three noisy pixels from each quadrant. If the there are fewer than three noisy pixels in the level2.evt file, extra rows are filled as -1
| Pixel properties | Quadrant properties | ||||||
|---|---|---|---|---|---|---|---|
| Quadrant | DetID | PixID | Counts | Sigma | Mean | Median | Sigma |
| A | 8 | 5 | 257614 | 1595.98 | 802 | 787 | 160.9 |
| A | 13 | 251 | 33071 | 200.62 | 802 | 787 | 160.9 |
| A | 13 | 248 | 32443 | 196.72 | 802 | 787 | 160.9 |
| B | 10 | 16 | 36292 | 238.32 | 798 | 780 | 149.0 |
| B | 12 | 111 | 16003 | 102.16 | 798 | 780 | 149.0 |
| B | 11 | 111 | 12824 | 80.83 | 798 | 780 | 149.0 |
| C | 9 | 68 | 39857 | 216.35 | 787 | 793 | 180.6 |
| C | 13 | 61 | 5936 | 28.48 | 787 | 793 | 180.6 |
| C | 12 | 4 | 4322 | 19.54 | 787 | 793 | 180.6 |
| D | 13 | 122 | 702499 | 3701.1 | 777 | 759 | 189.6 |
| D | 2 | 152 | 323423 | 1701.79 | 777 | 759 | 189.6 |
| D | 2 | 16 | 87430 | 457.12 | 777 | 759 | 189.6 |
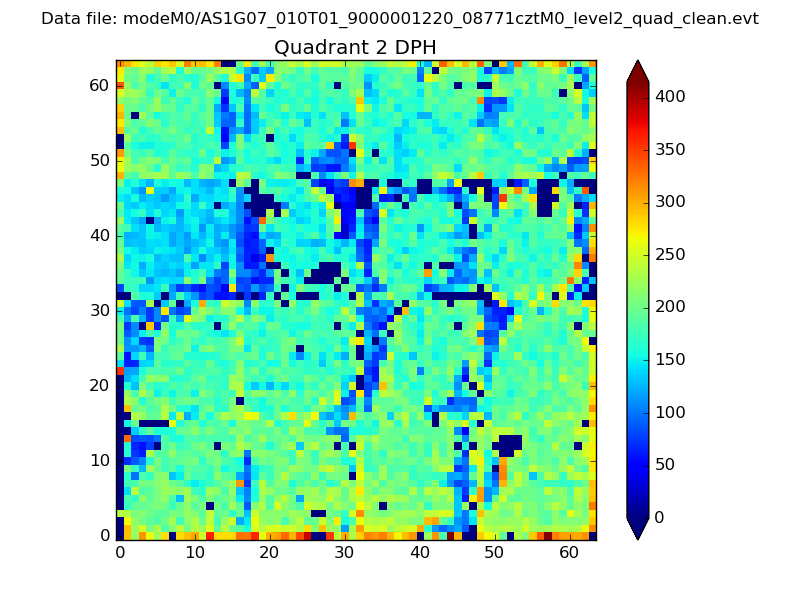
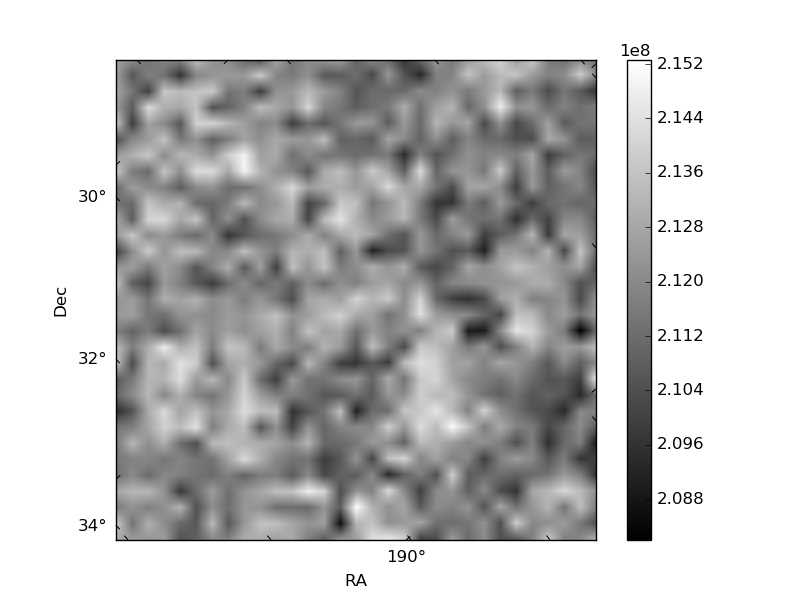
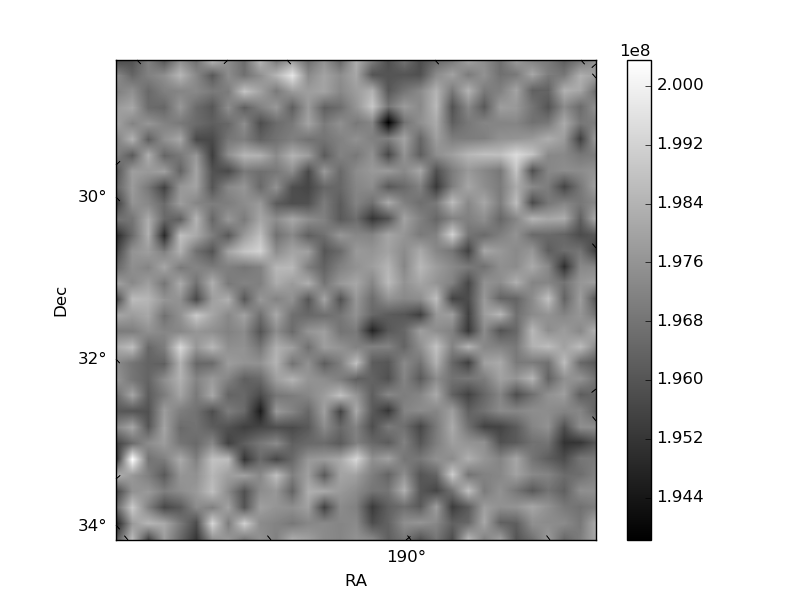
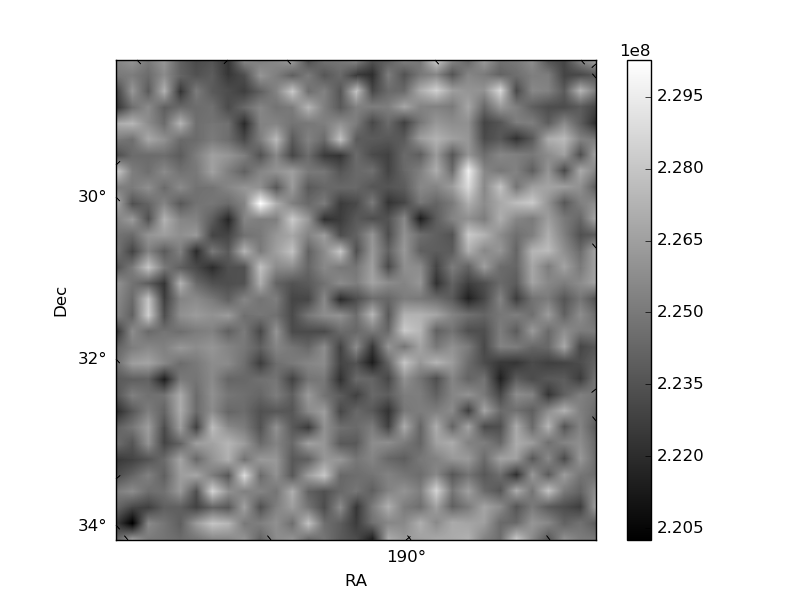
Histogram calculated using DETX and DETY for each event in the final _common_clean file
| Quadrant A | 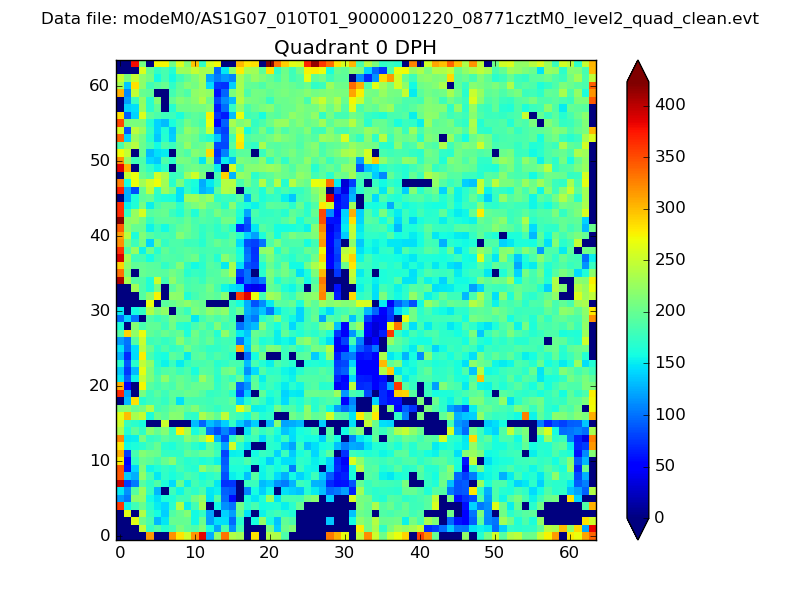 |
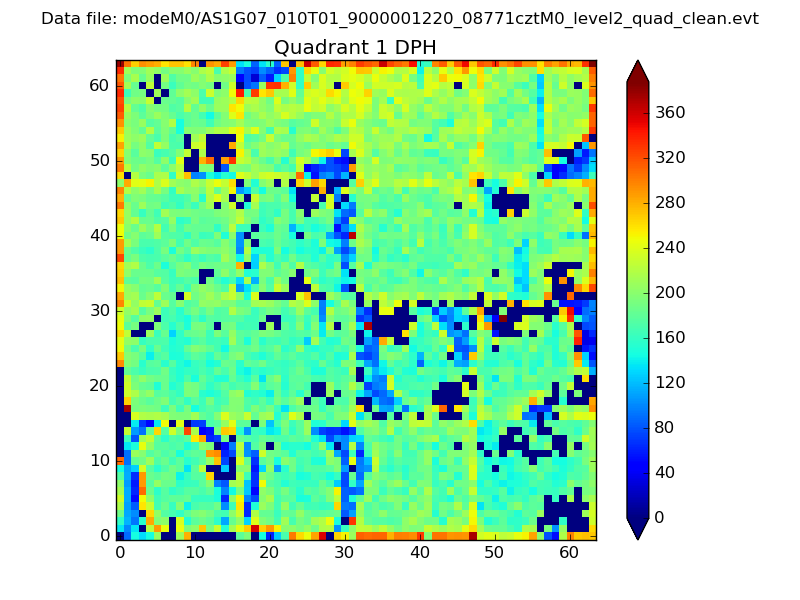 |
Quadrant B |
|---|---|---|---|
| Quadrant D | 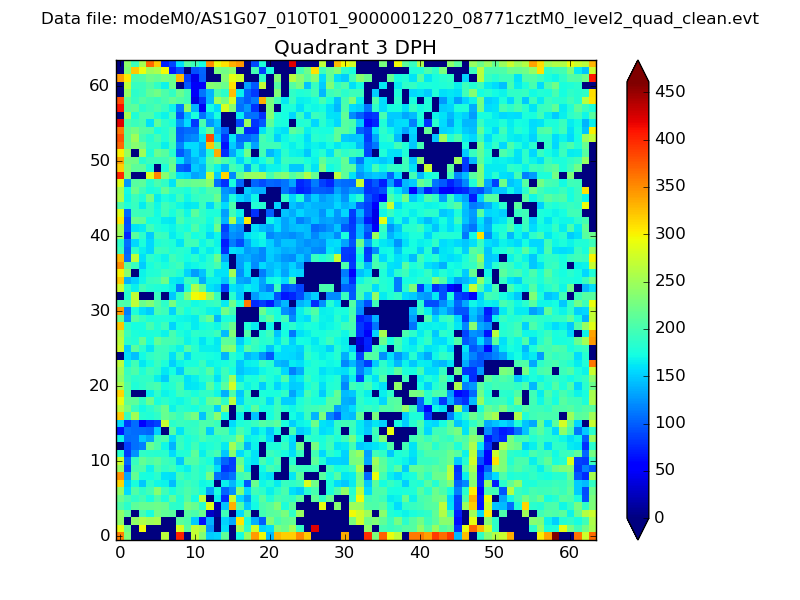 |
 |
Quadrant C |
| Plot type | Count rate plots | Images |
|---|---|---|
| Comparison with Poisson distribution Blue bars denote a histogram of data divided into 1 sec bins. Red curve is a Poisson curve with rate = median count rate of data. |
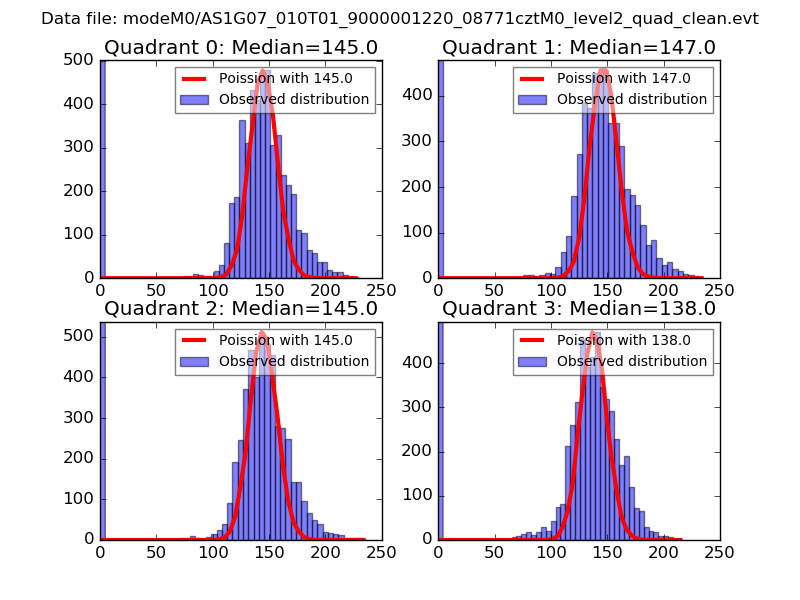 |
 |
| Quadrant-wise count rates Data is divided into 100 sec bins |
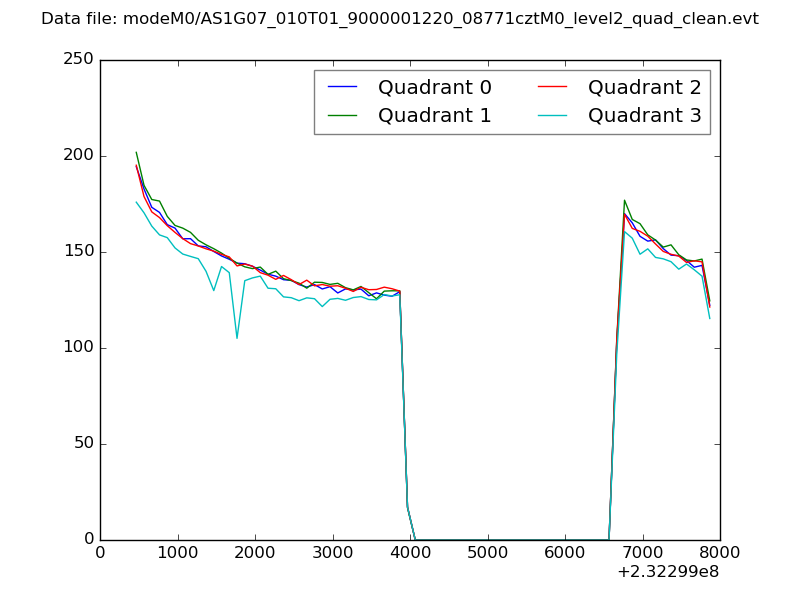 |
|
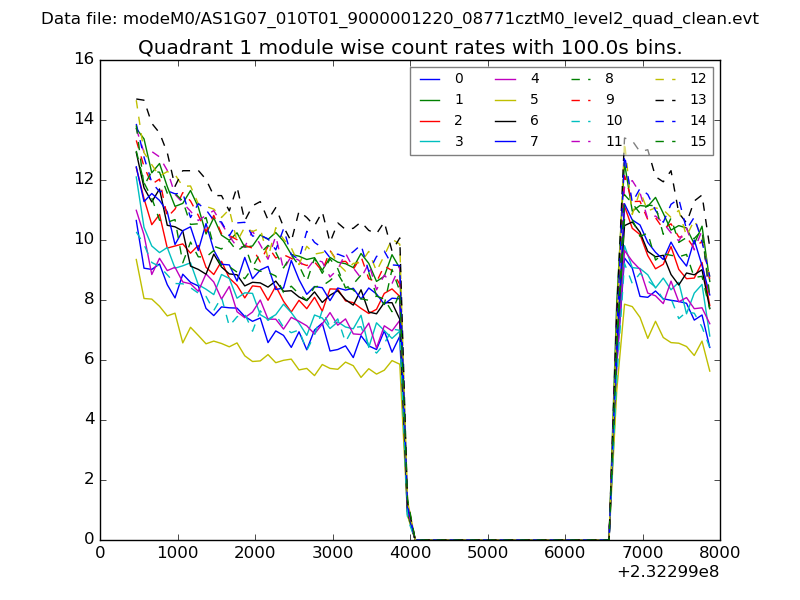
| Module-wise count rates for Quadrant A Data is divided into 100 sec bins |
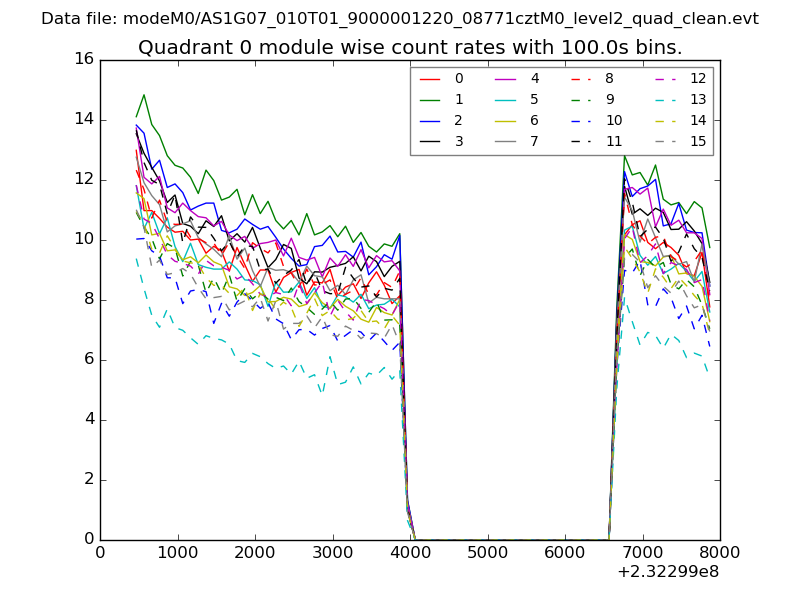 |
 |
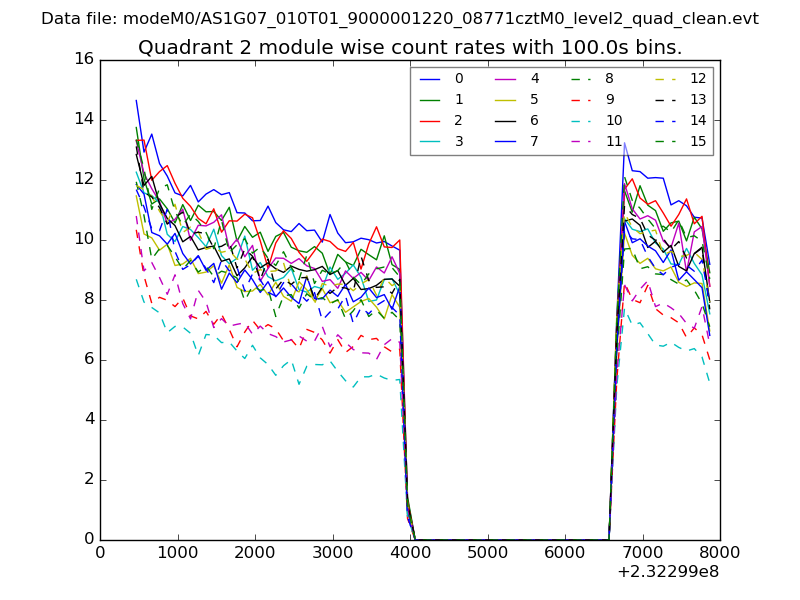
| Module-wise count rates for Quadrant B Data is divided into 100 sec bins |
 |
 |
| Module-wise count rates for Quadrant C Data is divided into 100 sec bins |
 |
 |
| Module-wise count rates for Quadrant D Data is divided into 100 sec bins |
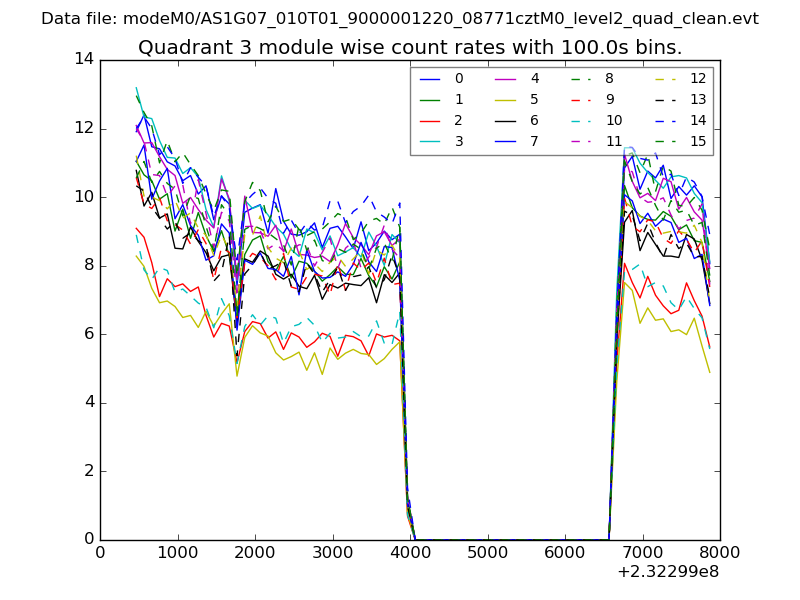 |
 |
| Parameter | Plot |
|---|---|
| CZT HV Monitor | 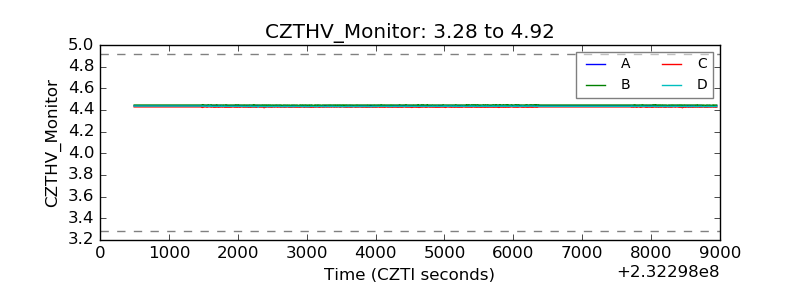 |
| D_VDD |  |
| Temperature 1 | 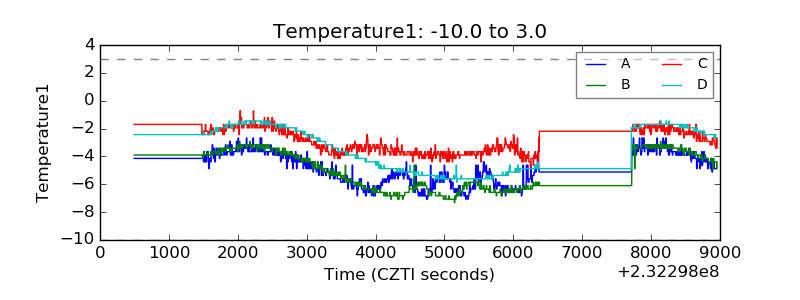 |
| Veto HV Monitor |  |
| Veto LLD | 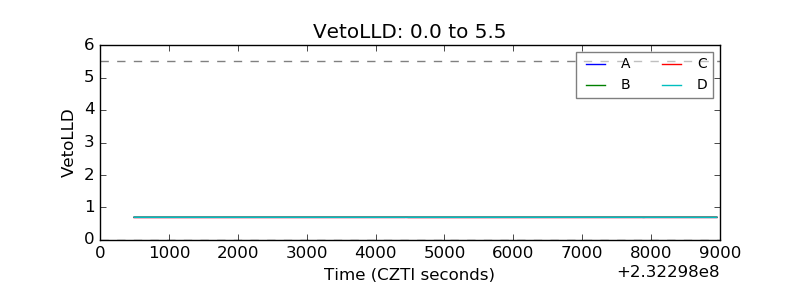 |
| Alpha Counter | 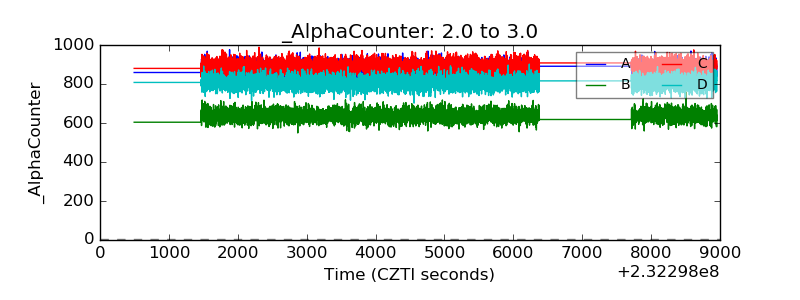 |
| _CPM_Rate | 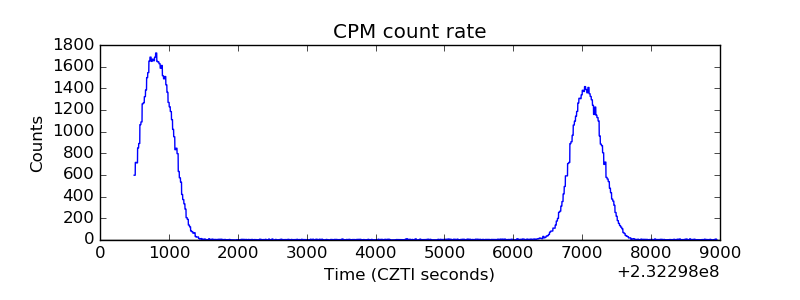 |
| CZT Counter | 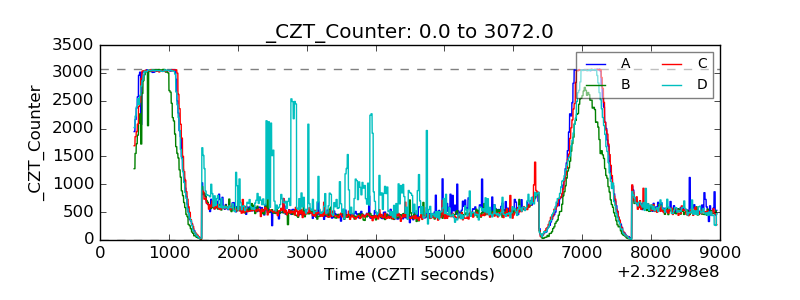 |
| +2.5 Volts monitor |  |
| +5 Volts monitor |  |
| _ROLL_ROT | 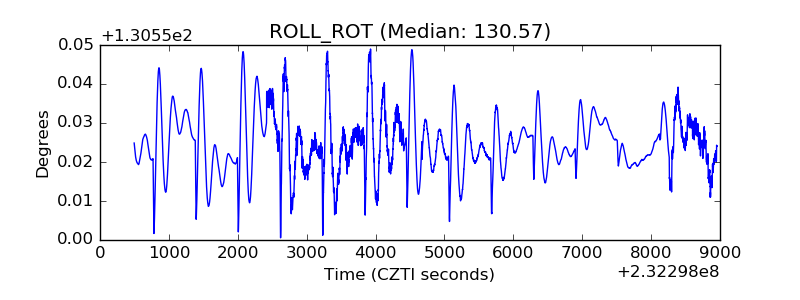 |
| _Roll_DEC | 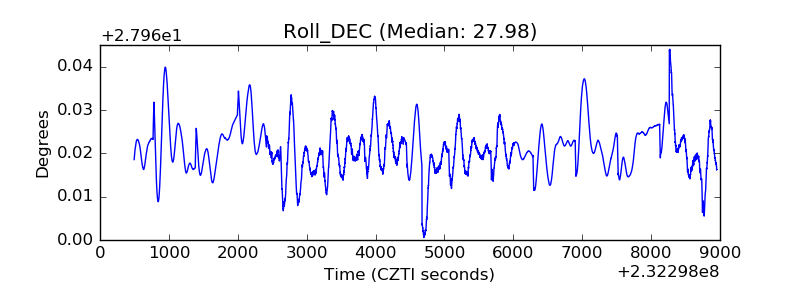 |
| _Roll_RA |  |
| Veto Counter | 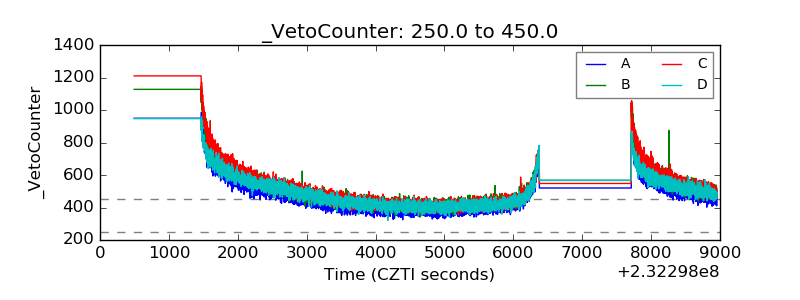 |