| Param | Original file | Final file |
|---|---|---|
| Filename | modeM0/AS1G07_010T01_9000001220_08772cztM0_level2.evt | modeM0/AS1G07_010T01_9000001220_08772cztM0_level2_quad_clean.evt |
| Size (bytes) | 474,471,360 | 97,416,000 |
| Size | 452.5 MB | 92.9 MB |
| Events in quadrant A | 3,564,882 | 627,065 |
| Events in quadrant B | 3,328,662 | 633,501 |
| Events in quadrant C | 3,270,963 | 627,476 |
| Events in quadrant D | 3,759,249 | 604,728 |
| Mode SS | |||
|---|---|---|---|
| Quadrant | BADHDUFLAG | Total packets | Discarded packets |
| A | 0 | 136 | 0 |
| B | 0 | 136 | 0 |
| C | 0 | 136 | 0 |
| D | 0 | 136 | 0 |
| Mode M0 | |||
|---|---|---|---|
| Quadrant | BADHDUFLAG | Total packets | Discarded packets |
| A | 0 | 14804 | 3 |
| B | 0 | 14140 | 2 |
| C | 0 | 14028 | 2 |
| D | 0 | 15451 | 2 |
| Mode M9 | |||
|---|---|---|---|
| Quadrant | BADHDUFLAG | Total packets | Discarded packets |
| A | 0 | 26 | 0 |
| B | 0 | 26 | 0 |
| C | 0 | 26 | 0 |
| D | 0 | 26 | 0 |
| Quadrant | Total seconds | Saturated seconds | Saturation percentage |
|---|---|---|---|
| A | 6557 | 136 | 2.074119% |
| B | 6557 | 152 | 2.318133% |
| C | 6557 | 135 | 2.058868% |
| D | 6557 | 155 | 2.363886% |
Noise dominated data is calculated using 1-second bins in cleaned event files. If a bin has >2000 counts, and if more than 50% of those come from <1% of pixels, then it is considered to be noise-dominated and hence unusable.
| Quadrant | # 1 sec bins | Bins with >0 counts | Bins with >2000 counts | High rate bins dominated by noise | Noise dominated (total time) | Noise dominated (detector-on time) | Marked lightcurve |
|---|---|---|---|---|---|---|---|
| A | 9132 | 6557 | 0 | 0 | 0.00% | 0.00% |  |
| B | 9132 | 6557 | 14 | 14 | 0.15% | 0.21% | 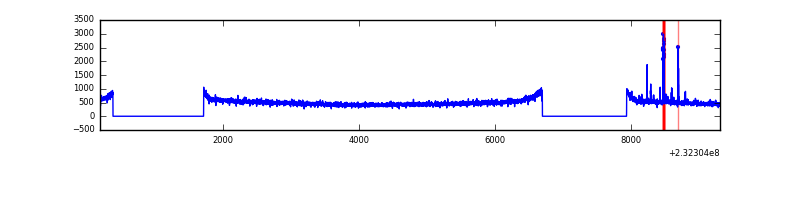 |
| C | 9132 | 6557 | 4 | 4 | 0.04% | 0.06% | 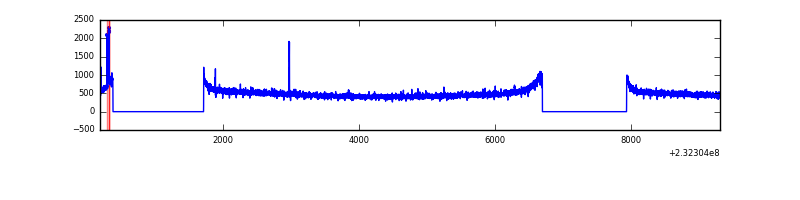 |
| D | 9132 | 6557 | 38 | 38 | 0.42% | 0.58% | 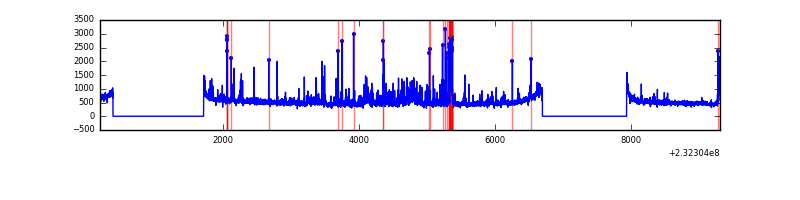 |
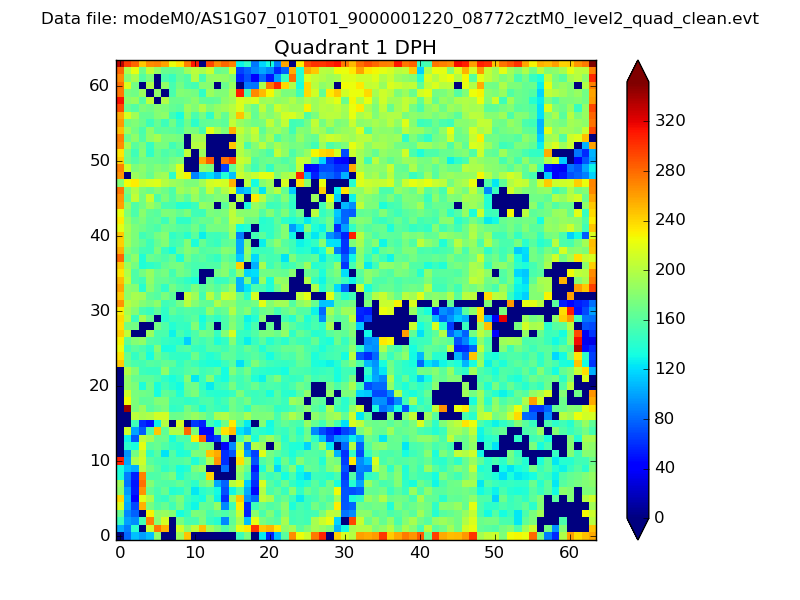
Top three noisy pixels from each quadrant. If the there are fewer than three noisy pixels in the level2.evt file, extra rows are filled as -1
| Pixel properties | Quadrant properties | ||||||
|---|---|---|---|---|---|---|---|
| Quadrant | DetID | PixID | Counts | Sigma | Mean | Median | Sigma |
| A | 8 | 5 | 267402 | 1568.3 | 842 | 825 | 170.0 |
| A | 13 | 251 | 31815 | 182.31 | 842 | 825 | 170.0 |
| A | 13 | 248 | 29281 | 167.41 | 842 | 825 | 170.0 |
| B | 10 | 16 | 53827 | 333.26 | 839 | 818 | 159.1 |
| B | 12 | 111 | 17431 | 104.44 | 839 | 818 | 159.1 |
| B | 4 | 173 | 14248 | 84.43 | 839 | 818 | 159.1 |
| C | 9 | 68 | 28966 | 146.33 | 827 | 829 | 192.3 |
| C | 14 | 234 | 10979 | 52.78 | 827 | 829 | 192.3 |
| C | 13 | 61 | 6106 | 27.44 | 827 | 829 | 192.3 |
| D | 2 | 152 | 315885 | 1569.93 | 822 | 803 | 200.7 |
| D | 2 | 16 | 88629 | 437.6 | 822 | 803 | 200.7 |
| D | 1 | 52 | 84122 | 415.15 | 822 | 803 | 200.7 |
Histogram calculated using DETX and DETY for each event in the final _common_clean file
| Quadrant A |  |
 |
Quadrant B |
|---|---|---|---|
| Quadrant D | 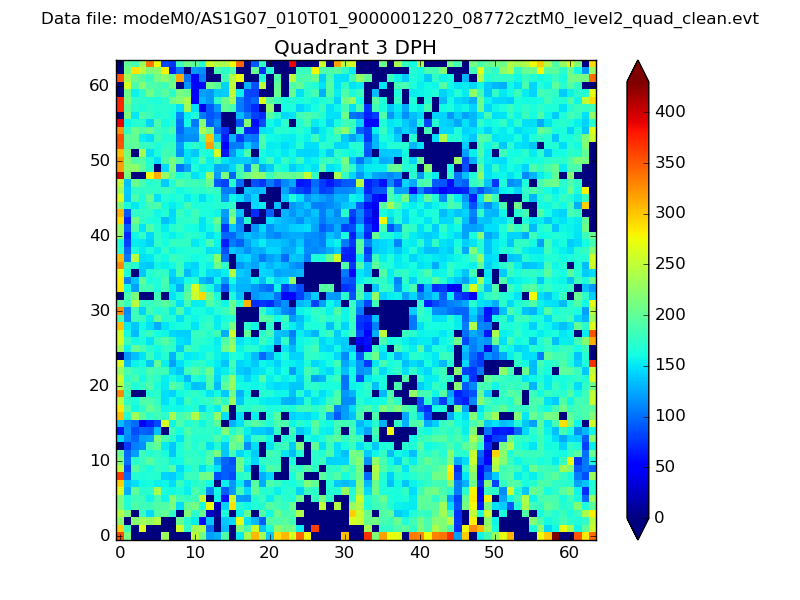 |
 |
Quadrant C |
| Plot type | Count rate plots | Images |
|---|---|---|
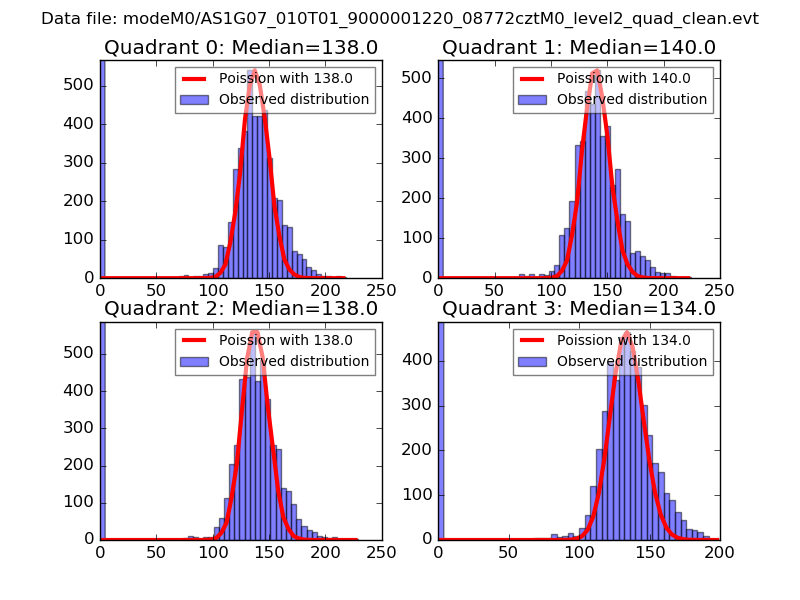
| Comparison with Poisson distribution Blue bars denote a histogram of data divided into 1 sec bins. Red curve is a Poisson curve with rate = median count rate of data. |
 |
 |
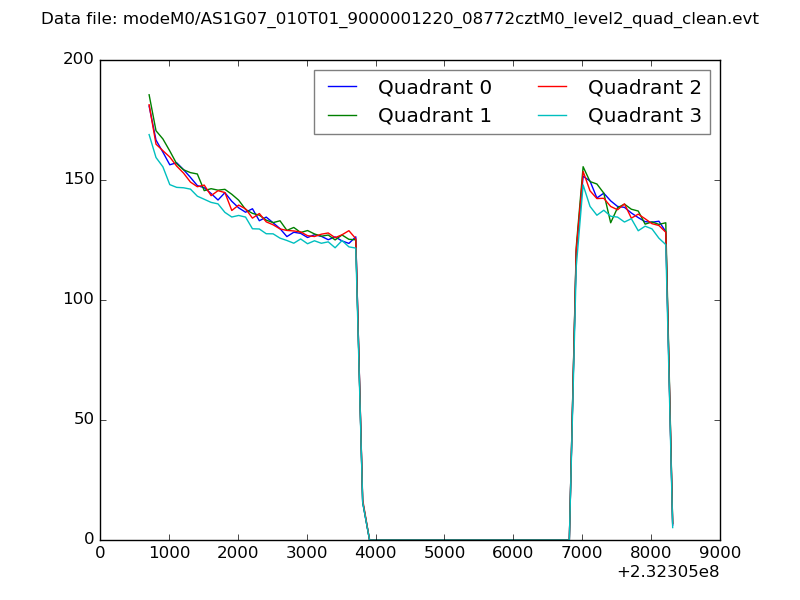
| Quadrant-wise count rates Data is divided into 100 sec bins |
 |
|
| Module-wise count rates for Quadrant A Data is divided into 100 sec bins |
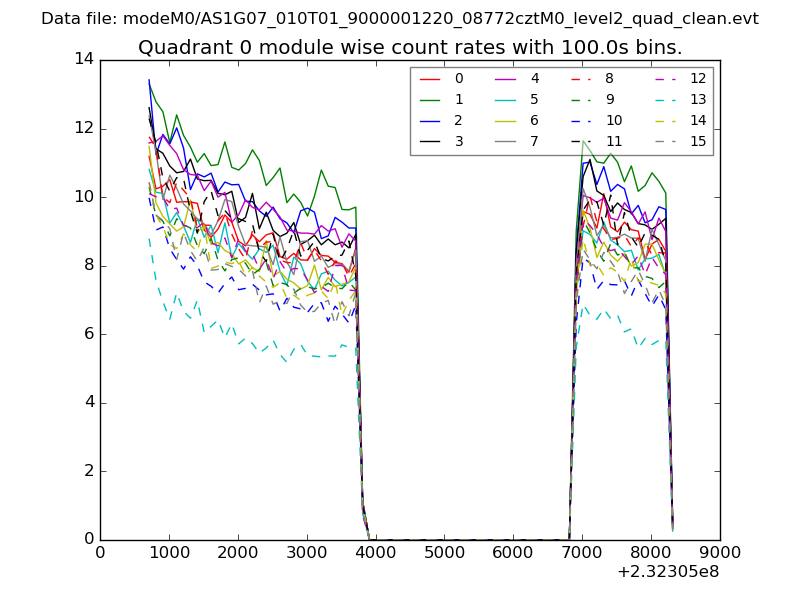 |
 |
| Module-wise count rates for Quadrant B Data is divided into 100 sec bins |
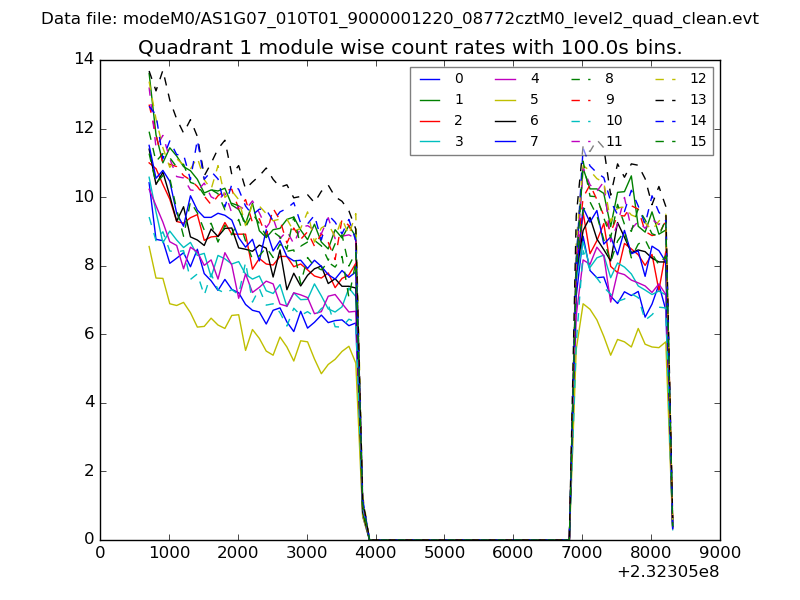 |
 |
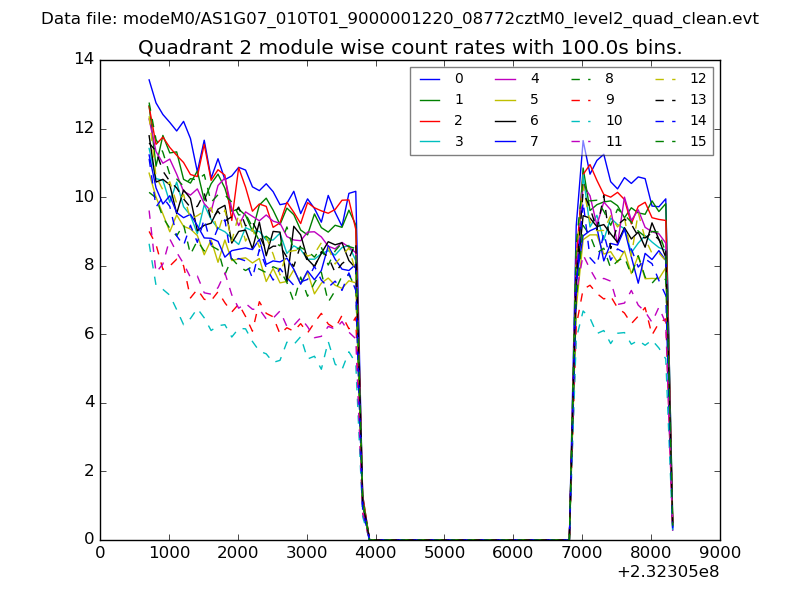
| Module-wise count rates for Quadrant C Data is divided into 100 sec bins |
 |
 |
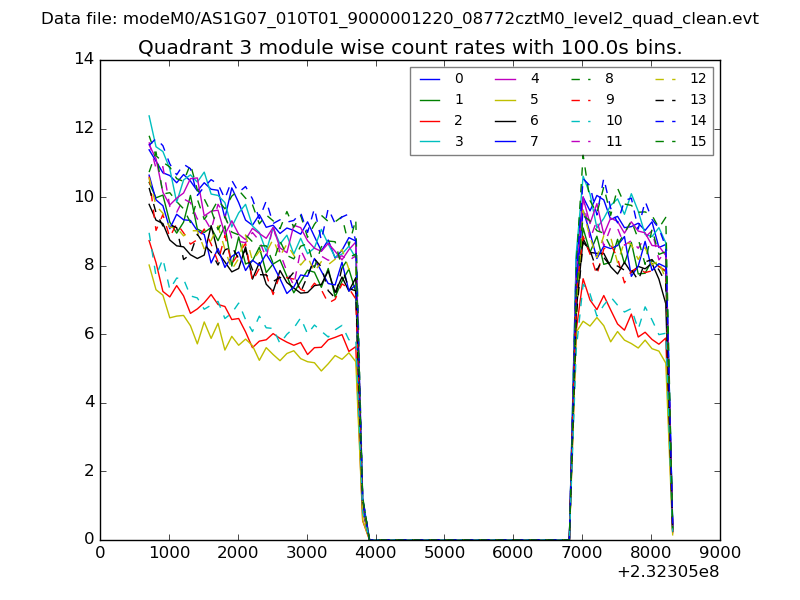
| Module-wise count rates for Quadrant D Data is divided into 100 sec bins |
 |
 |
| Parameter | Plot |
|---|---|
| CZT HV Monitor | 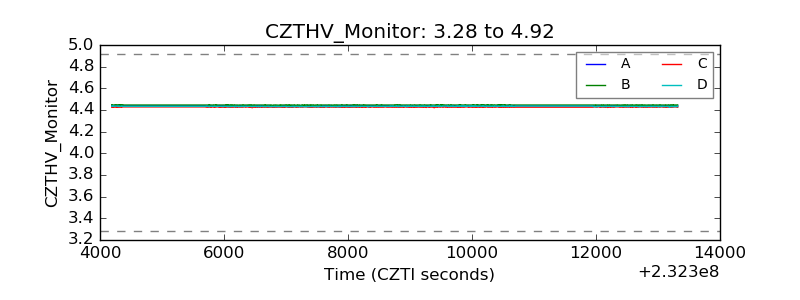 |
| D_VDD | 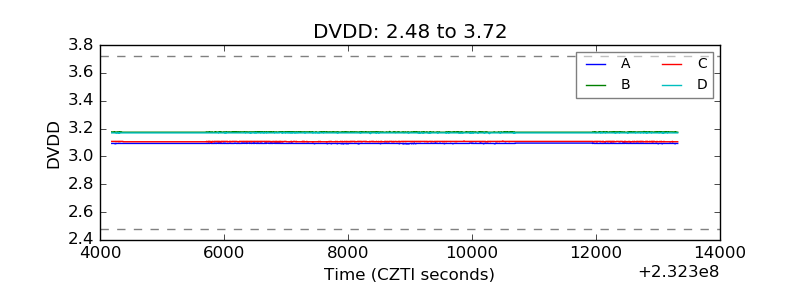 |
| Temperature 1 | 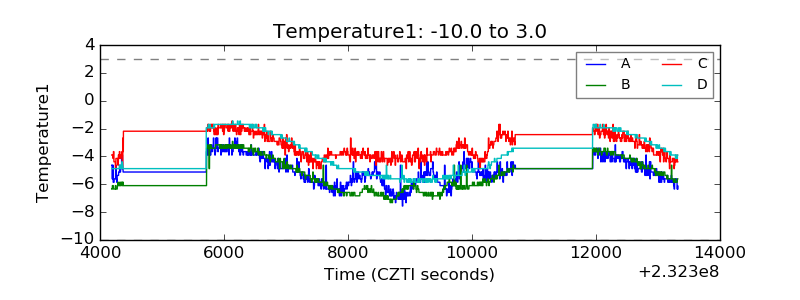 |
| Veto HV Monitor | 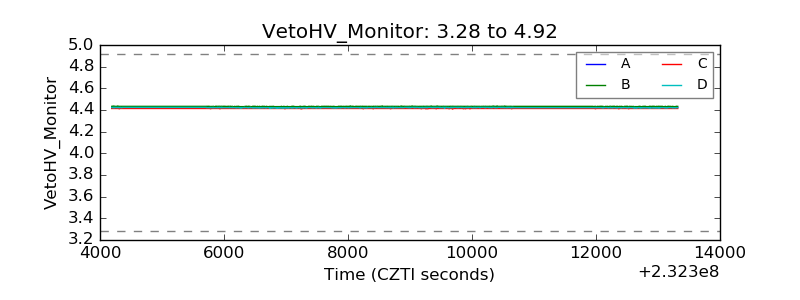 |
| Veto LLD | 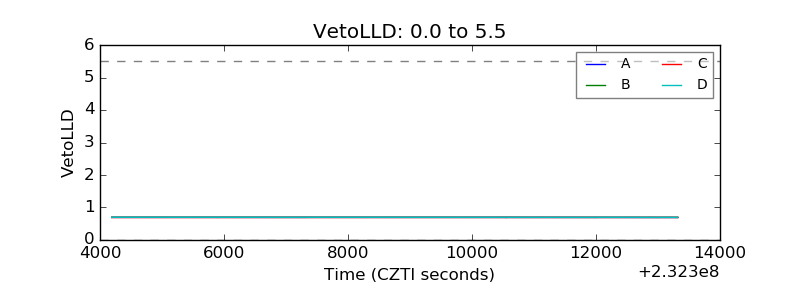 |
| Alpha Counter | 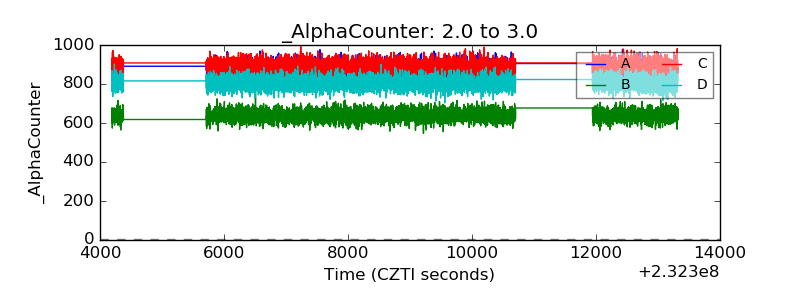 |
| _CPM_Rate | 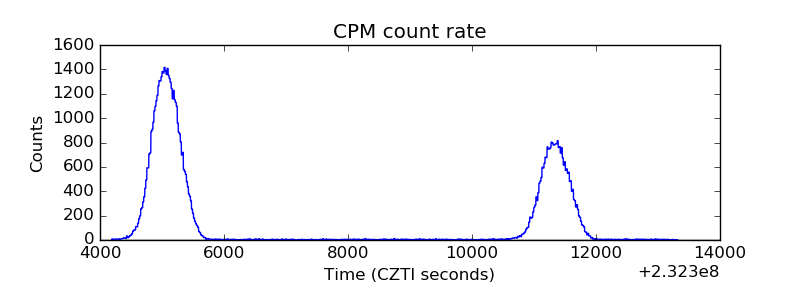 |
| CZT Counter | 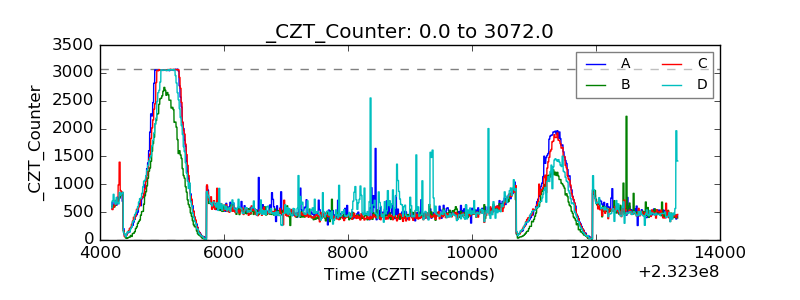 |
| +2.5 Volts monitor |  |
| +5 Volts monitor |  |
| _ROLL_ROT | 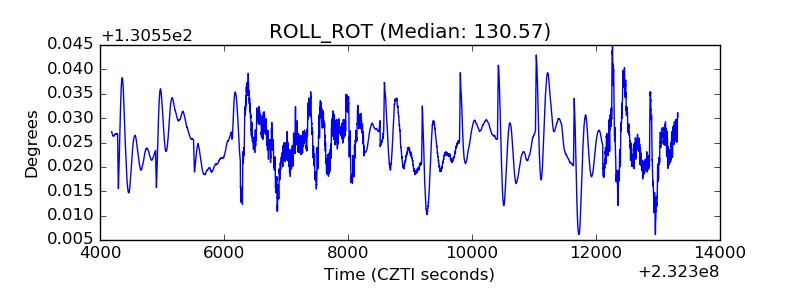 |
| _Roll_DEC | 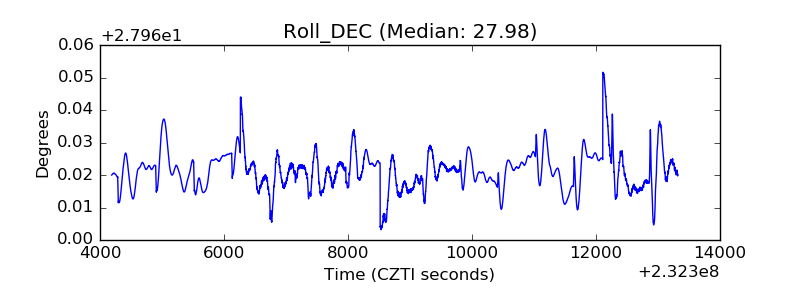 |
| _Roll_RA | 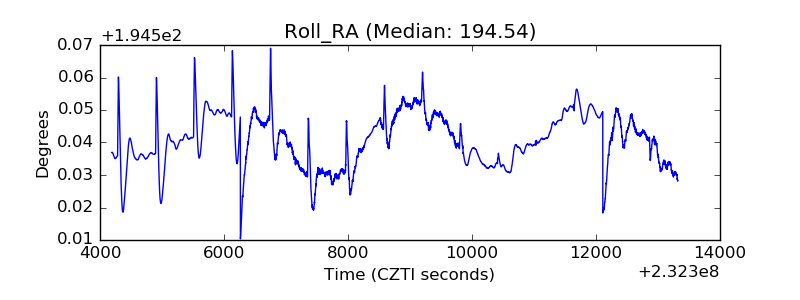 |
| Veto Counter | 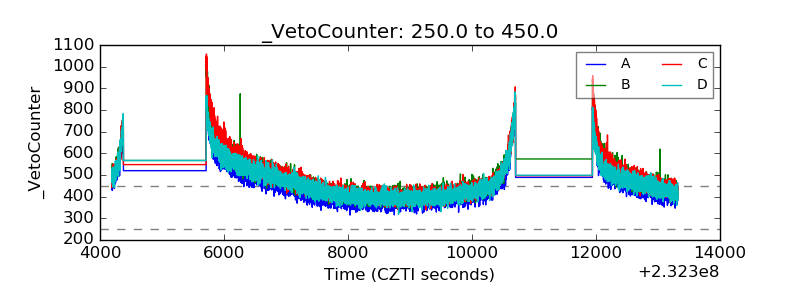 |