| Param | Original file | Final file |
|---|---|---|
| Filename | modeM0/AS1G07_010T01_9000001220_08773cztM0_level2.evt | modeM0/AS1G07_010T01_9000001220_08773cztM0_level2_quad_clean.evt |
| Size (bytes) | 464,126,400 | 90,365,760 |
| Size | 442.6 MB | 86.2 MB |
| Events in quadrant A | 3,241,242 | 573,483 |
| Events in quadrant B | 3,280,339 | 578,548 |
| Events in quadrant C | 3,089,612 | 574,168 |
| Events in quadrant D | 3,996,343 | 549,980 |
| Mode SS | |||
|---|---|---|---|
| Quadrant | BADHDUFLAG | Total packets | Discarded packets |
| A | 0 | 134 | 0 |
| B | 0 | 134 | 0 |
| C | 0 | 134 | 0 |
| D | 0 | 134 | 0 |
| Mode M0 | |||
|---|---|---|---|
| Quadrant | BADHDUFLAG | Total packets | Discarded packets |
| A | 0 | 14117 | 3 |
| B | 0 | 14181 | 2 |
| C | 0 | 13703 | 2 |
| D | 0 | 16397 | 2 |
| Mode M9 | |||
|---|---|---|---|
| Quadrant | BADHDUFLAG | Total packets | Discarded packets |
| A | 0 | 13 | 0 |
| B | 0 | 13 | 0 |
| C | 0 | 13 | 0 |
| D | 0 | 14 | 0 |
| Quadrant | Total seconds | Saturated seconds | Saturation percentage |
|---|---|---|---|
| A | 6602 | 56 | 0.848228% |
| B | 6602 | 85 | 1.287489% |
| C | 6602 | 39 | 0.590730% |
| D | 6602 | 132 | 1.999394% |
Noise dominated data is calculated using 1-second bins in cleaned event files. If a bin has >2000 counts, and if more than 50% of those come from <1% of pixels, then it is considered to be noise-dominated and hence unusable.
| Quadrant | # 1 sec bins | Bins with >0 counts | Bins with >2000 counts | High rate bins dominated by noise | Noise dominated (total time) | Noise dominated (detector-on time) | Marked lightcurve |
|---|---|---|---|---|---|---|---|
| A | 7657 | 6602 | 1 | 1 | 0.01% | 0.02% | 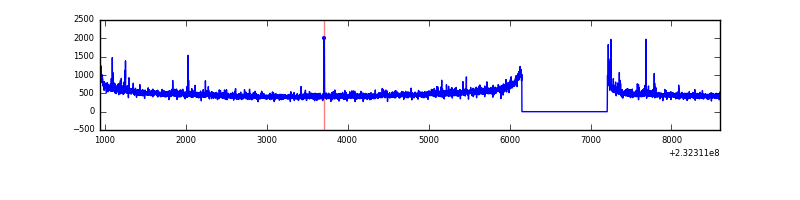 |
| B | 7657 | 6602 | 21 | 21 | 0.27% | 0.32% |  |
| C | 7657 | 6602 | 0 | 0 | 0.00% | 0.00% | 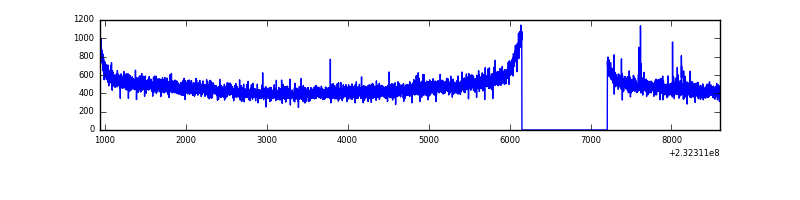 |
| D | 7657 | 6602 | 86 | 86 | 1.12% | 1.30% |  |
Top three noisy pixels from each quadrant. If the there are fewer than three noisy pixels in the level2.evt file, extra rows are filled as -1
| Pixel properties | Quadrant properties | ||||||
|---|---|---|---|---|---|---|---|
| Quadrant | DetID | PixID | Counts | Sigma | Mean | Median | Sigma |
| A | 8 | 5 | 124465 | 754.24 | 802 | 785 | 164.0 |
| A | 5 | 16 | 14927 | 86.24 | 802 | 785 | 164.0 |
| A | 13 | 251 | 9875 | 55.43 | 802 | 785 | 164.0 |
| B | 10 | 16 | 122221 | 786.57 | 804 | 785 | 154.4 |
| B | 4 | 173 | 27328 | 171.93 | 804 | 785 | 154.4 |
| B | 12 | 111 | 17054 | 105.38 | 804 | 785 | 154.4 |
| C | 13 | 61 | 5822 | 27.26 | 789 | 794 | 184.4 |
| C | 14 | 234 | 4874 | 22.12 | 789 | 794 | 184.4 |
| C | 9 | 54 | 4684 | 21.09 | 789 | 794 | 184.4 |
| D | 2 | 16 | 553634 | 2821.68 | 779 | 762 | 195.9 |
| D | 2 | 152 | 248708 | 1265.44 | 779 | 762 | 195.9 |
| D | 7 | 71 | 130322 | 661.23 | 779 | 762 | 195.9 |
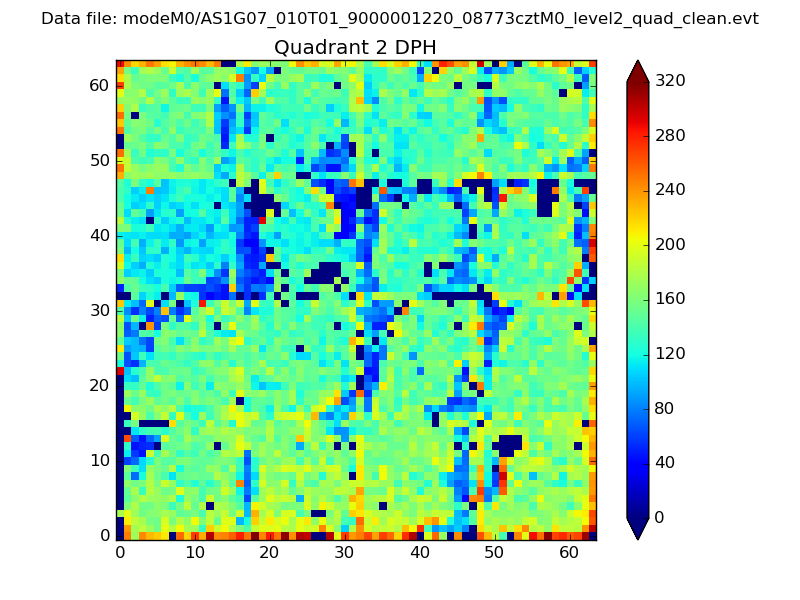
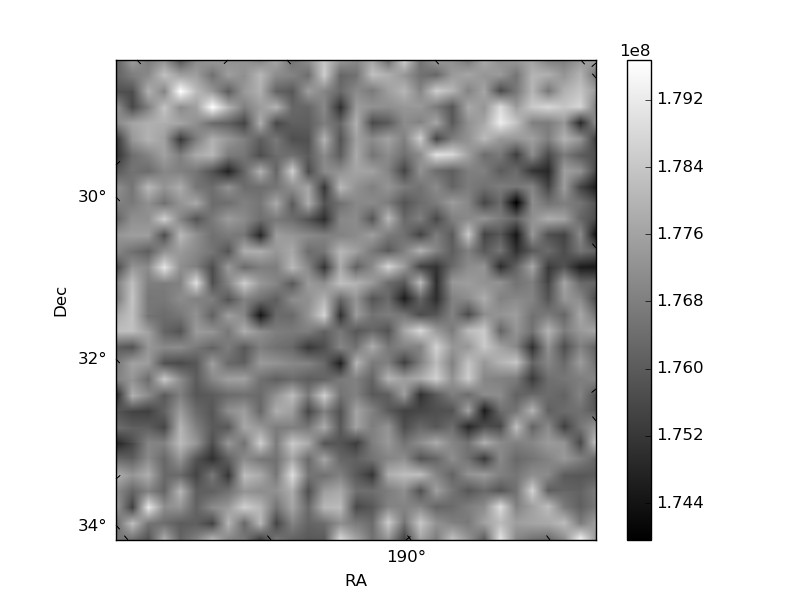
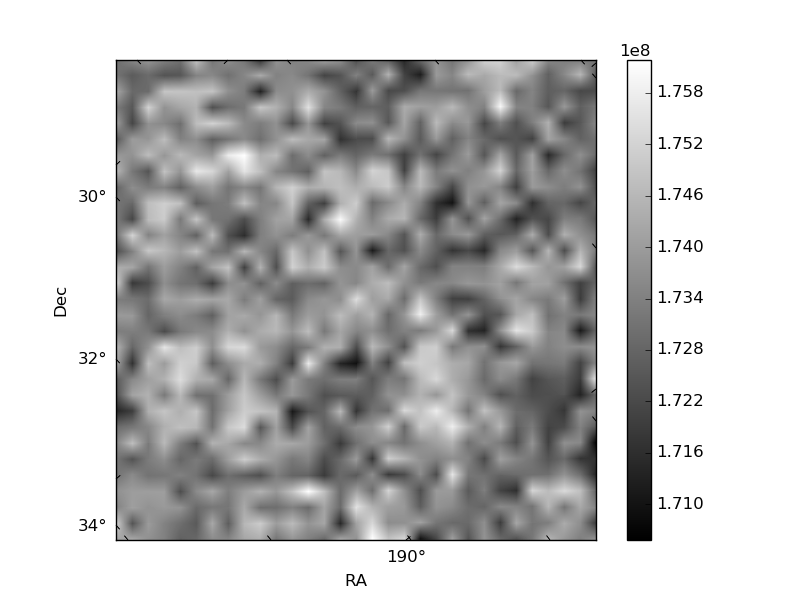
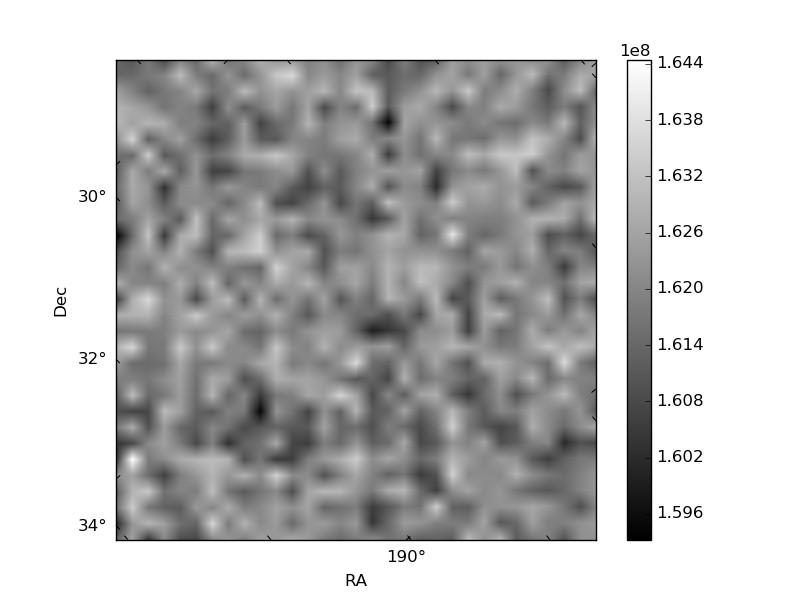
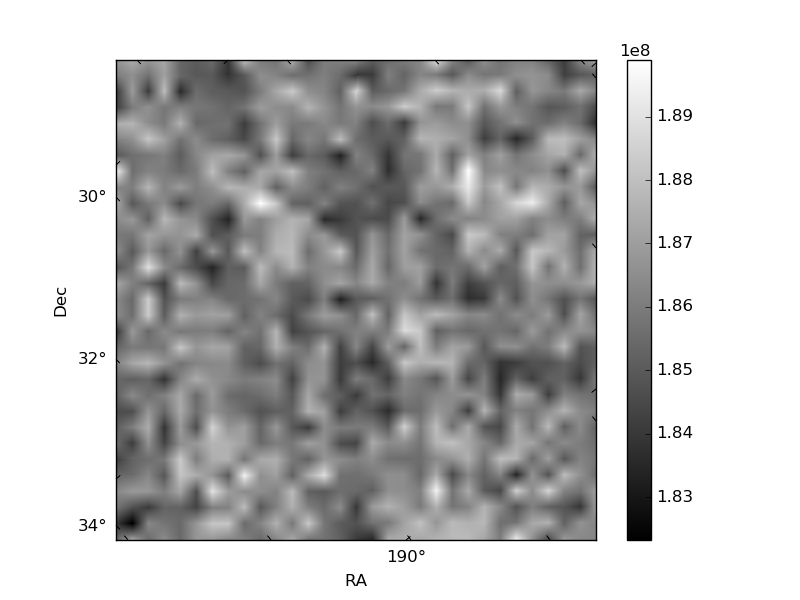
Histogram calculated using DETX and DETY for each event in the final _common_clean file
| Quadrant A | 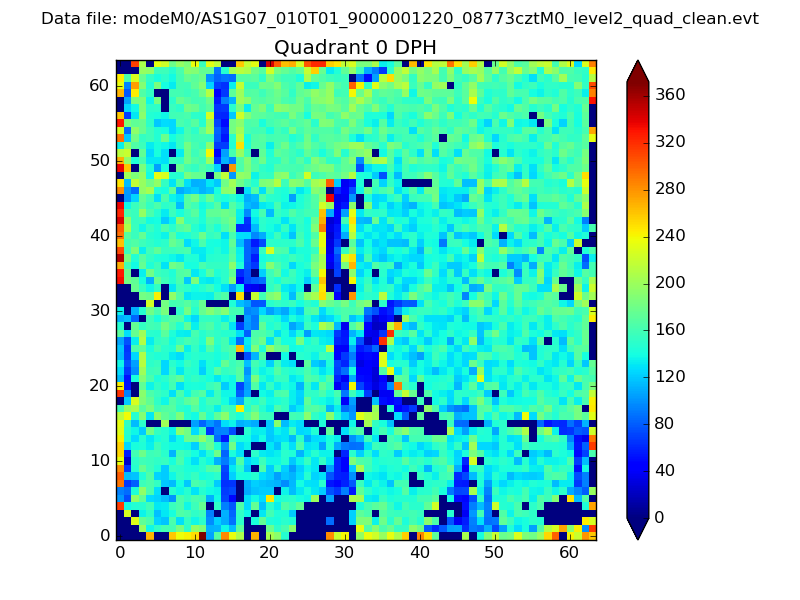 |
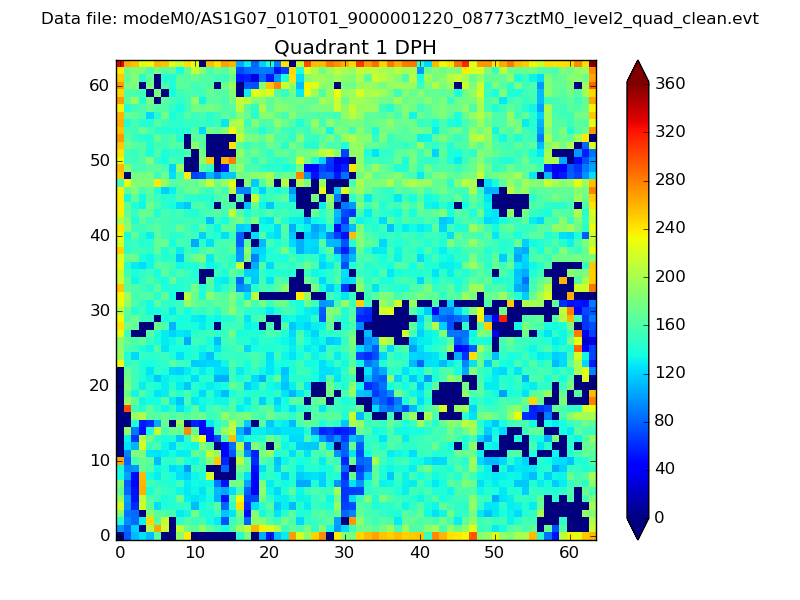 |
Quadrant B |
|---|---|---|---|
| Quadrant D | 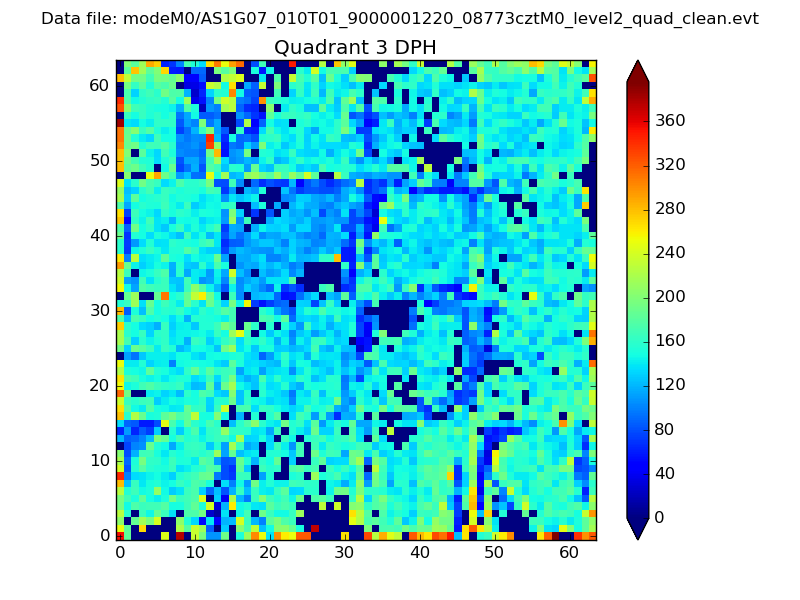 |
 |
Quadrant C |
| Plot type | Count rate plots | Images |
|---|---|---|
| Comparison with Poisson distribution Blue bars denote a histogram of data divided into 1 sec bins. Red curve is a Poisson curve with rate = median count rate of data. |
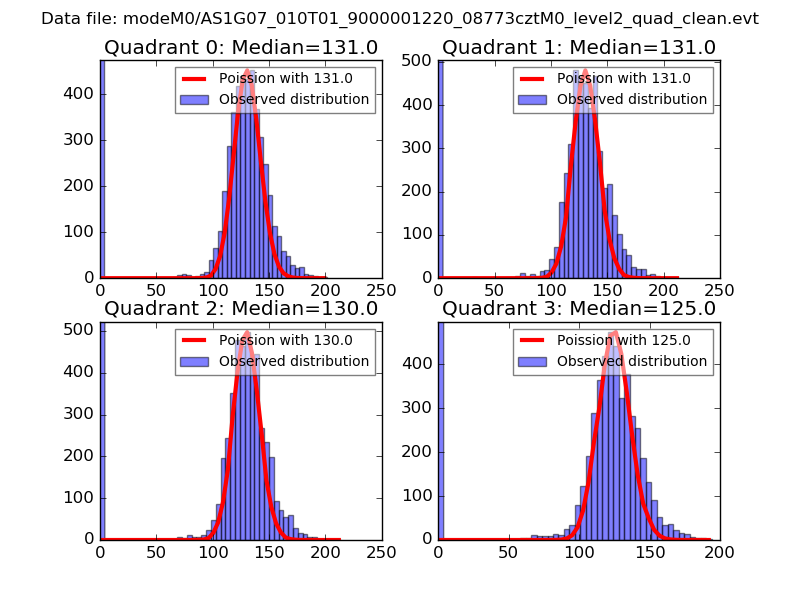 |
 |
| Quadrant-wise count rates Data is divided into 100 sec bins |
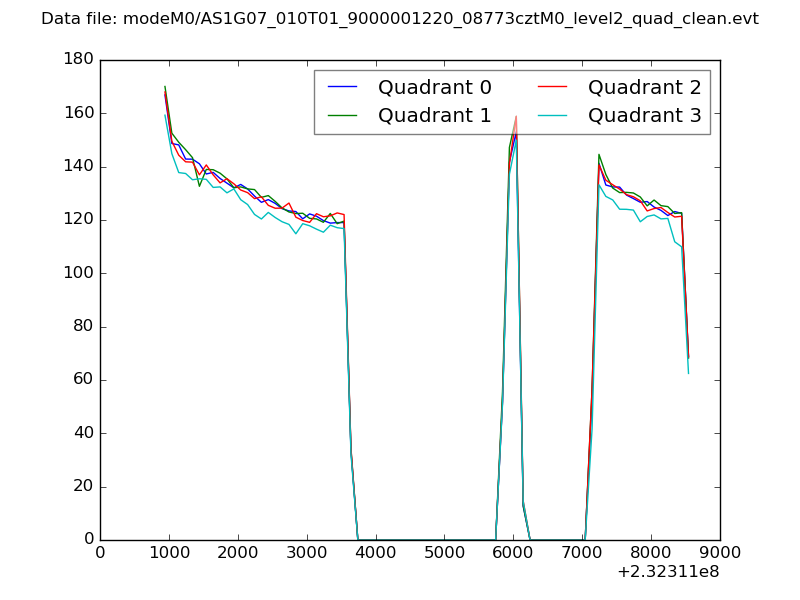 |
|
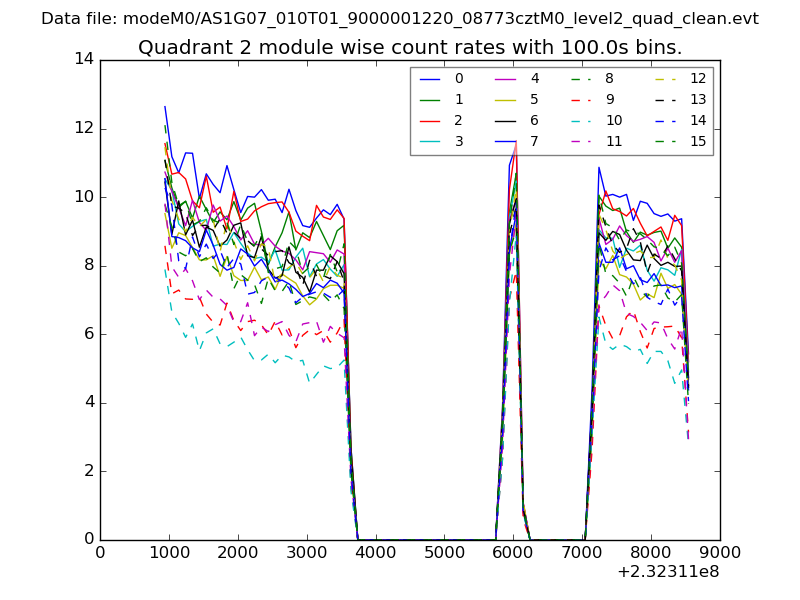
| Module-wise count rates for Quadrant A Data is divided into 100 sec bins |
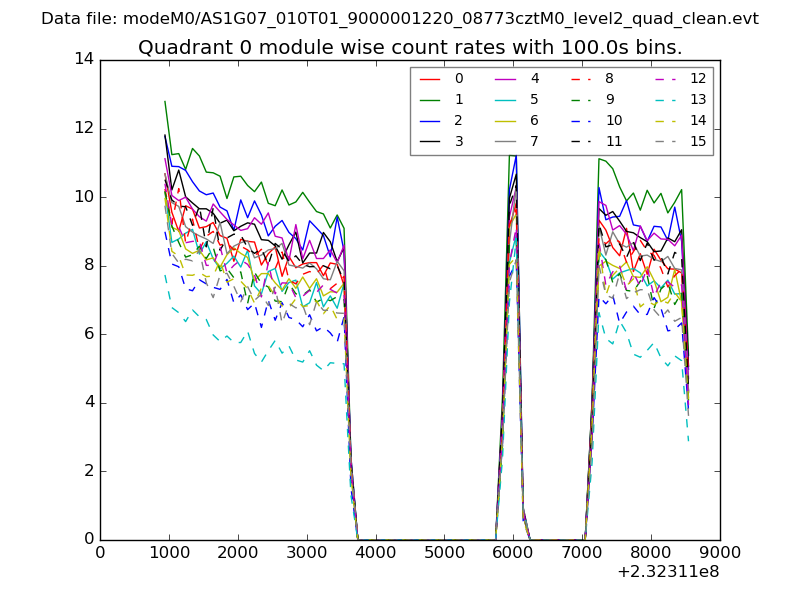 |
 |
| Module-wise count rates for Quadrant B Data is divided into 100 sec bins |
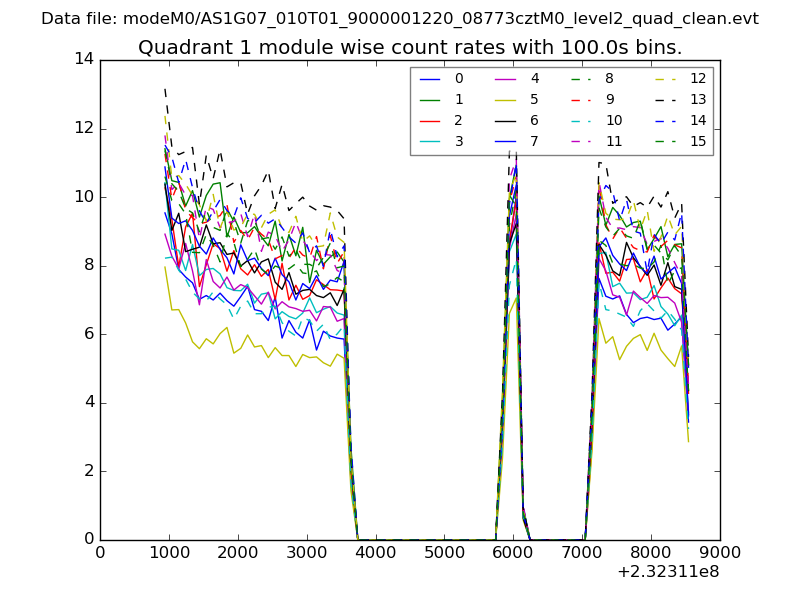 |
 |
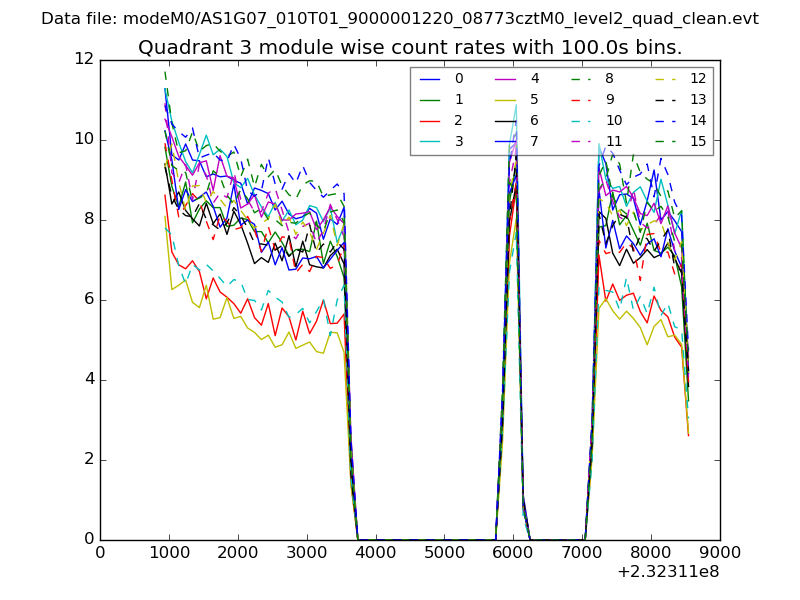
| Module-wise count rates for Quadrant C Data is divided into 100 sec bins |
 |
 |
| Module-wise count rates for Quadrant D Data is divided into 100 sec bins |
 |
 |
| Parameter | Plot |
|---|---|
| CZT HV Monitor | 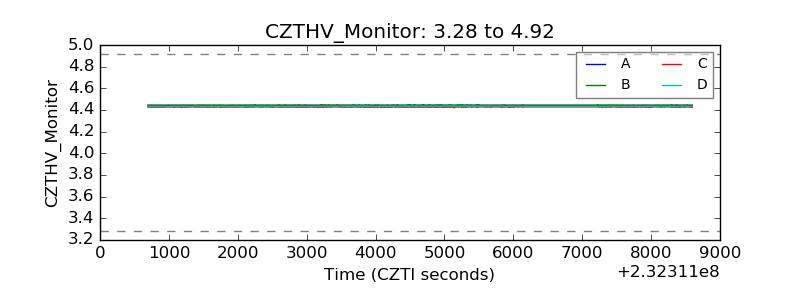 |
| D_VDD | 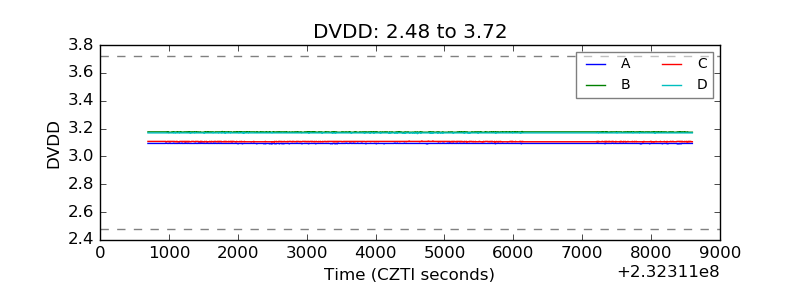 |
| Temperature 1 | 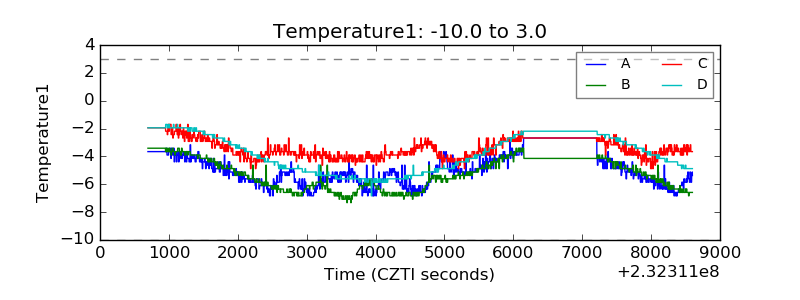 |
| Veto HV Monitor |  |
| Veto LLD | 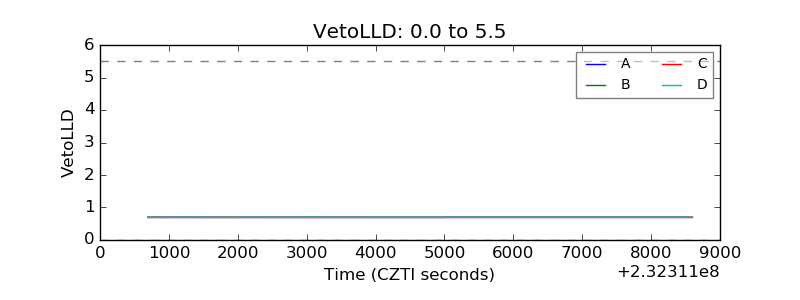 |
| Alpha Counter | 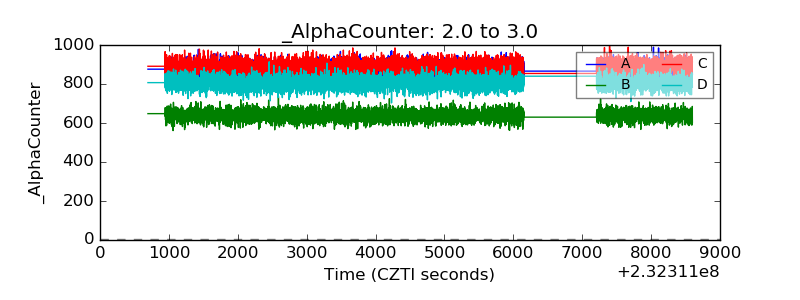 |
| _CPM_Rate | 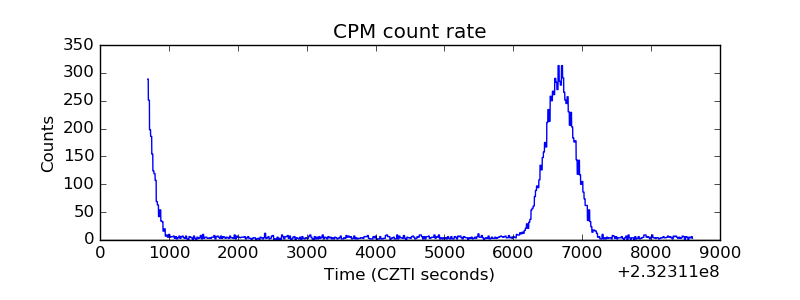 |
| CZT Counter | 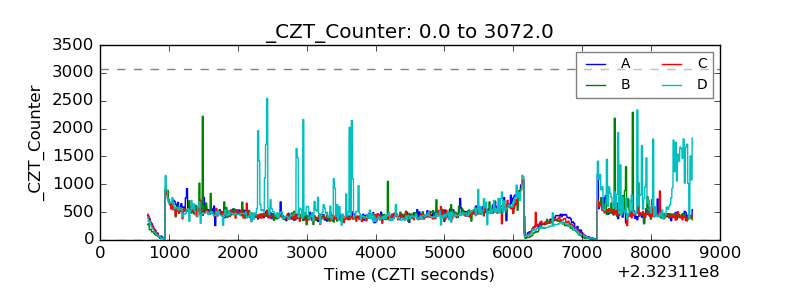 |
| +2.5 Volts monitor |  |
| +5 Volts monitor |  |
| _ROLL_ROT | 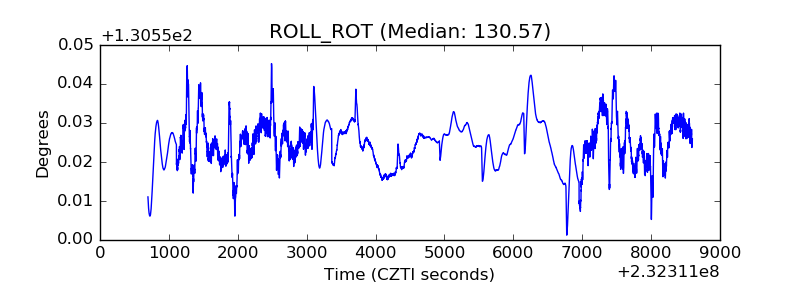 |
| _Roll_DEC | 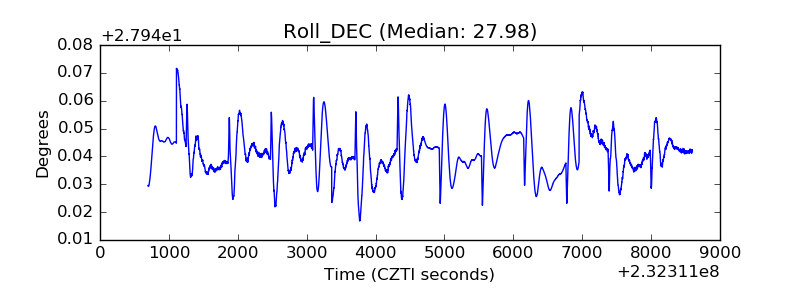 |
| _Roll_RA | 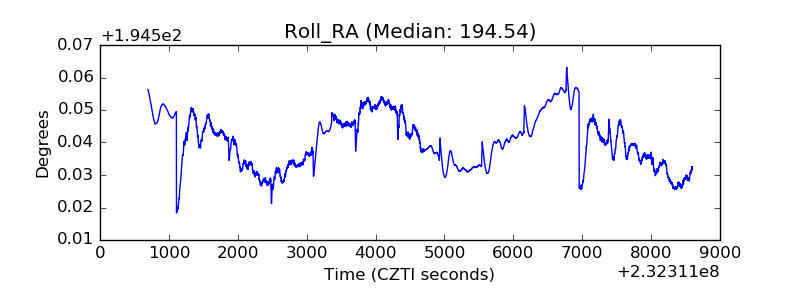 |
| Veto Counter | 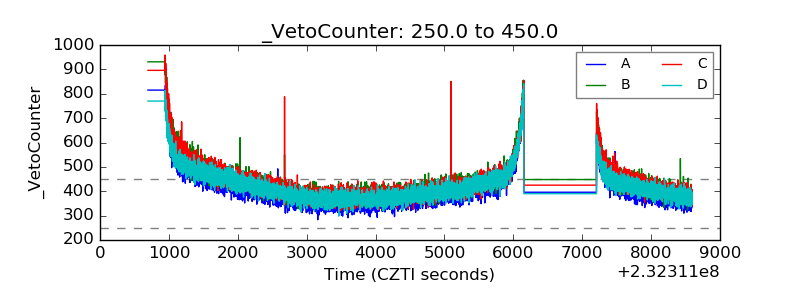 |