| Param | Original file | Final file |
|---|---|---|
| Filename | modeM0/AS1G07_010T01_9000001220_08774cztM0_level2.evt | modeM0/AS1G07_010T01_9000001220_08774cztM0_level2_quad_clean.evt |
| Size (bytes) | 577,077,120 | 91,249,920 |
| Size | 550.3 MB | 87.0 MB |
| Events in quadrant A | 3,336,858 | 583,923 |
| Events in quadrant B | 3,300,978 | 589,778 |
| Events in quadrant C | 3,129,112 | 584,624 |
| Events in quadrant D | 7,244,031 | 525,788 |
| Mode SS | |||
|---|---|---|---|
| Quadrant | BADHDUFLAG | Total packets | Discarded packets |
| A | 0 | 138 | 0 |
| B | 0 | 138 | 0 |
| C | 0 | 138 | 0 |
| D | 0 | 138 | 0 |
| Mode M0 | |||
|---|---|---|---|
| Quadrant | BADHDUFLAG | Total packets | Discarded packets |
| A | 0 | 14574 | 3 |
| B | 0 | 14514 | 2 |
| C | 0 | 14120 | 2 |
| D | 0 | 26289 | 2 |
| Mode M9 | |||
|---|---|---|---|
| Quadrant | BADHDUFLAG | Total packets | Discarded packets |
| A | 0 | 14 | 0 |
| B | 0 | 14 | 0 |
| C | 0 | 14 | 0 |
| D | 0 | 15 | 0 |
| Quadrant | Total seconds | Saturated seconds | Saturation percentage |
|---|---|---|---|
| A | 6880 | 32 | 0.465116% |
| B | 6880 | 59 | 0.857558% |
| C | 6880 | 19 | 0.276163% |
| D | 6880 | 904 | 13.139535% |
Noise dominated data is calculated using 1-second bins in cleaned event files. If a bin has >2000 counts, and if more than 50% of those come from <1% of pixels, then it is considered to be noise-dominated and hence unusable.
| Quadrant | # 1 sec bins | Bins with >0 counts | Bins with >2000 counts | High rate bins dominated by noise | Noise dominated (total time) | Noise dominated (detector-on time) | Marked lightcurve |
|---|---|---|---|---|---|---|---|
| A | 7570 | 6881 | 1 | 1 | 0.01% | 0.01% | 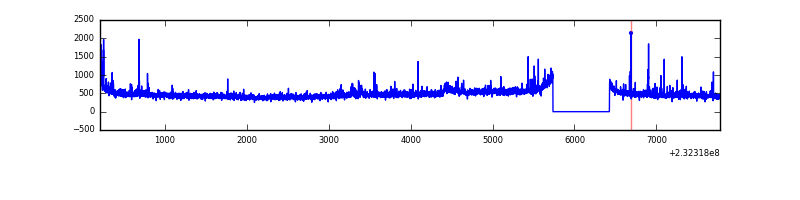 |
| B | 7570 | 6881 | 10 | 10 | 0.13% | 0.15% | 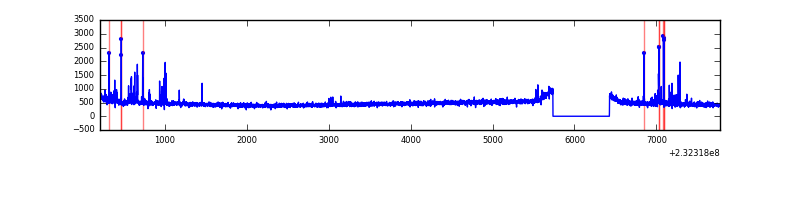 |
| C | 7570 | 6881 | 0 | 0 | 0.00% | 0.00% | 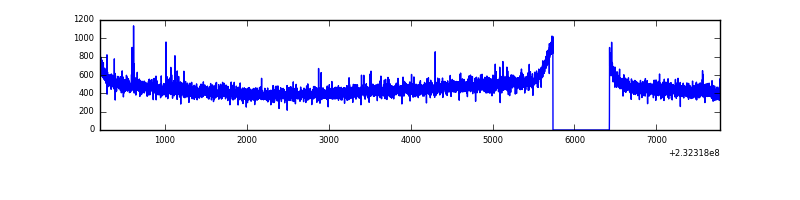 |
| D | 7570 | 6881 | 901 | 901 | 11.90% | 13.09% | 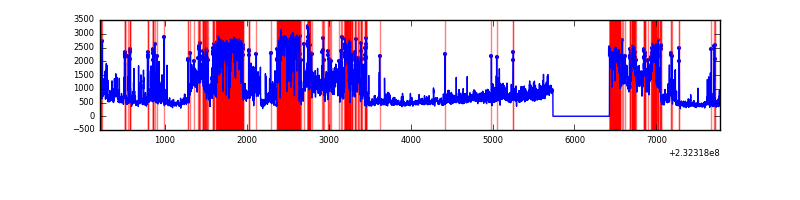 |
Top three noisy pixels from each quadrant. If the there are fewer than three noisy pixels in the level2.evt file, extra rows are filled as -1
| Pixel properties | Quadrant properties | ||||||
|---|---|---|---|---|---|---|---|
| Quadrant | DetID | PixID | Counts | Sigma | Mean | Median | Sigma |
| A | 8 | 5 | 169606 | 1021.35 | 811 | 794 | 165.3 |
| A | 13 | 251 | 23463 | 137.15 | 811 | 794 | 165.3 |
| A | 5 | 16 | 13995 | 79.87 | 811 | 794 | 165.3 |
| B | 10 | 16 | 109253 | 691.13 | 814 | 792 | 156.9 |
| B | 12 | 111 | 17661 | 107.49 | 814 | 792 | 156.9 |
| B | 4 | 173 | 16278 | 98.68 | 814 | 792 | 156.9 |
| C | 9 | 68 | 13497 | 68.4 | 796 | 800 | 185.6 |
| C | 13 | 61 | 5861 | 27.26 | 796 | 800 | 185.6 |
| C | 14 | 234 | 4813 | 21.62 | 796 | 800 | 185.6 |
| D | 2 | 16 | 3907721 | 21163.69 | 751 | 733 | 184.6 |
| D | 2 | 152 | 264717 | 1429.97 | 751 | 733 | 184.6 |
| D | 7 | 71 | 149887 | 807.95 | 751 | 733 | 184.6 |
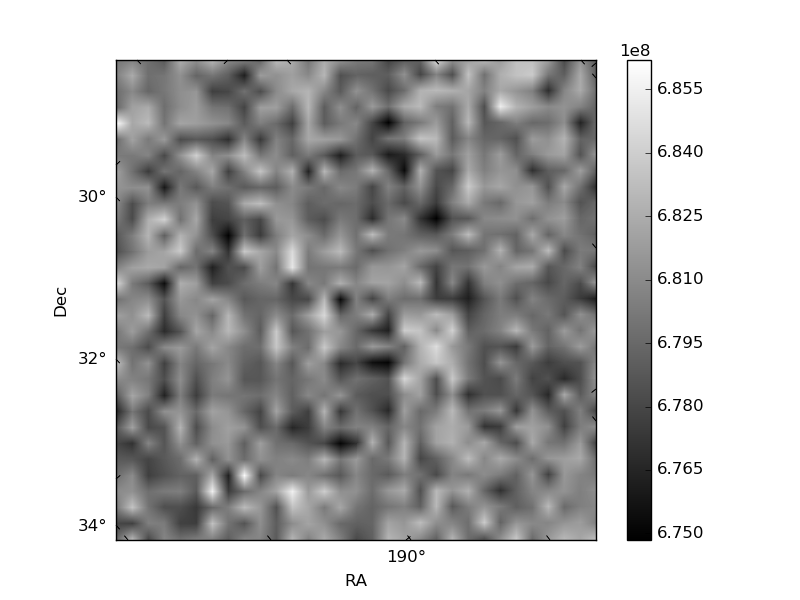
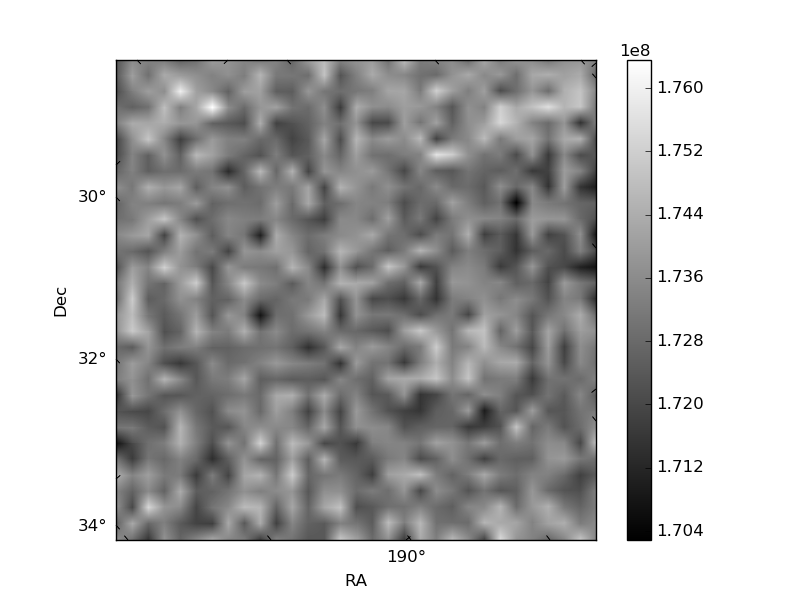
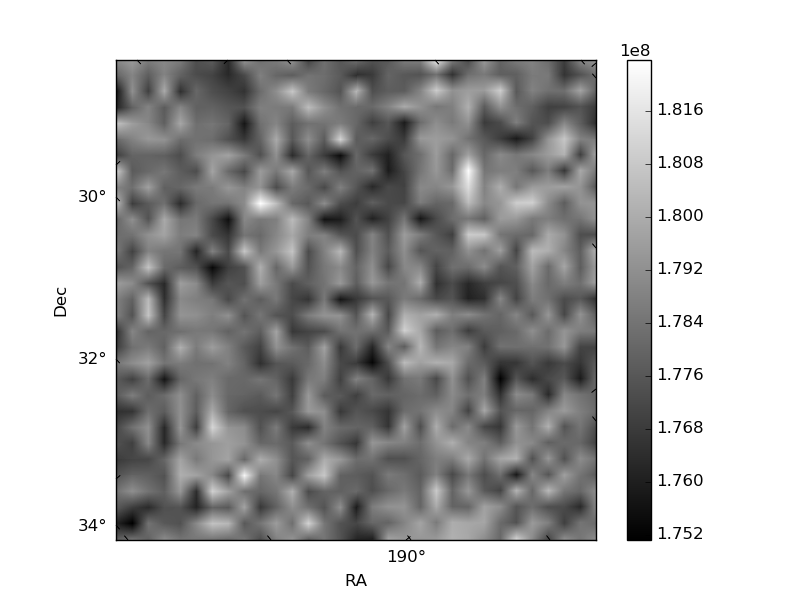
Histogram calculated using DETX and DETY for each event in the final _common_clean file
| Quadrant A | 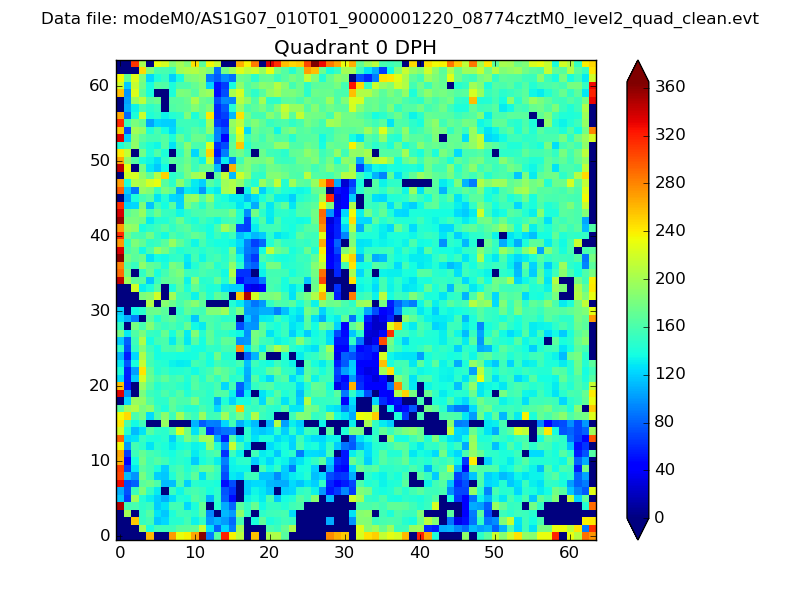 |
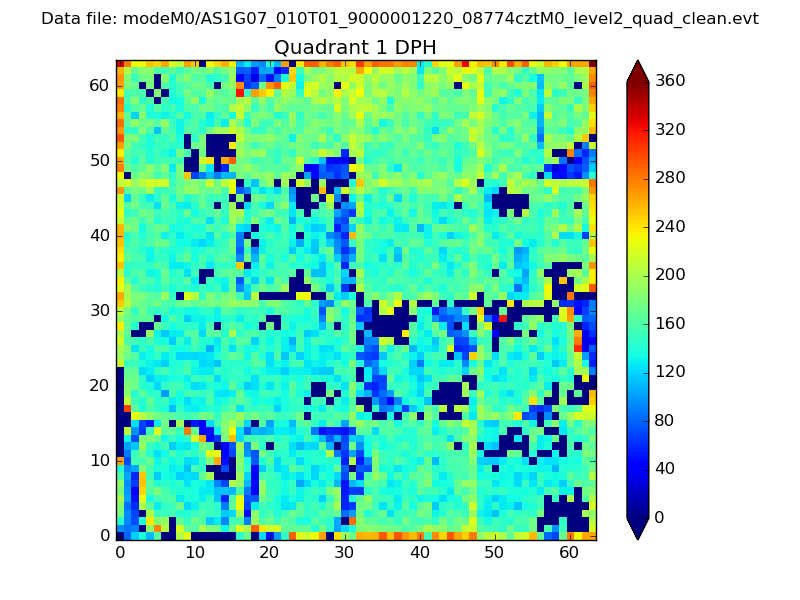 |
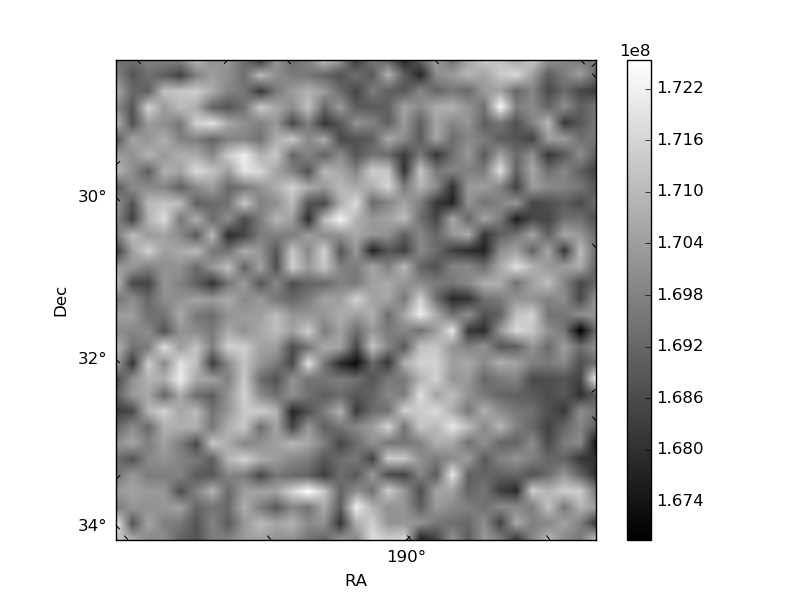
Quadrant B |
|---|---|---|---|
| Quadrant D | 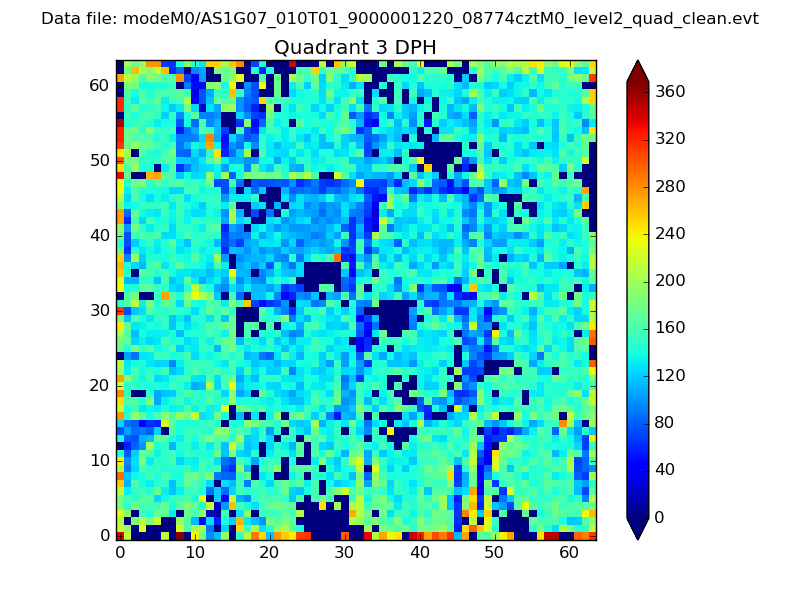 |
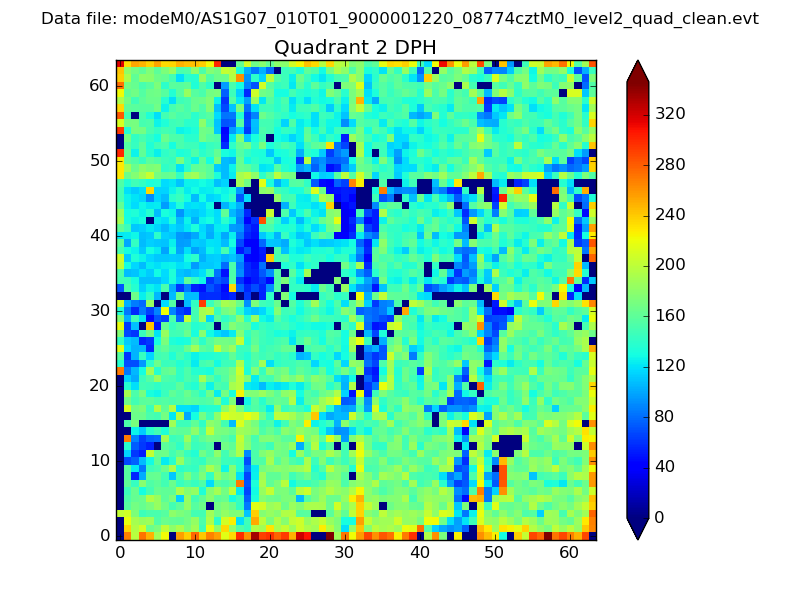 |
Quadrant C |
| Plot type | Count rate plots | Images |
|---|---|---|
| Comparison with Poisson distribution Blue bars denote a histogram of data divided into 1 sec bins. Red curve is a Poisson curve with rate = median count rate of data. |
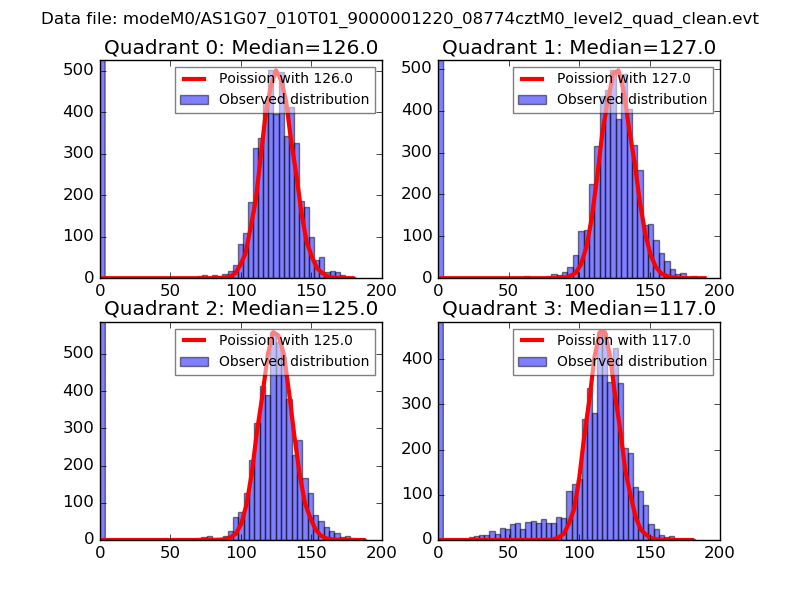 |
 |
| Quadrant-wise count rates Data is divided into 100 sec bins |
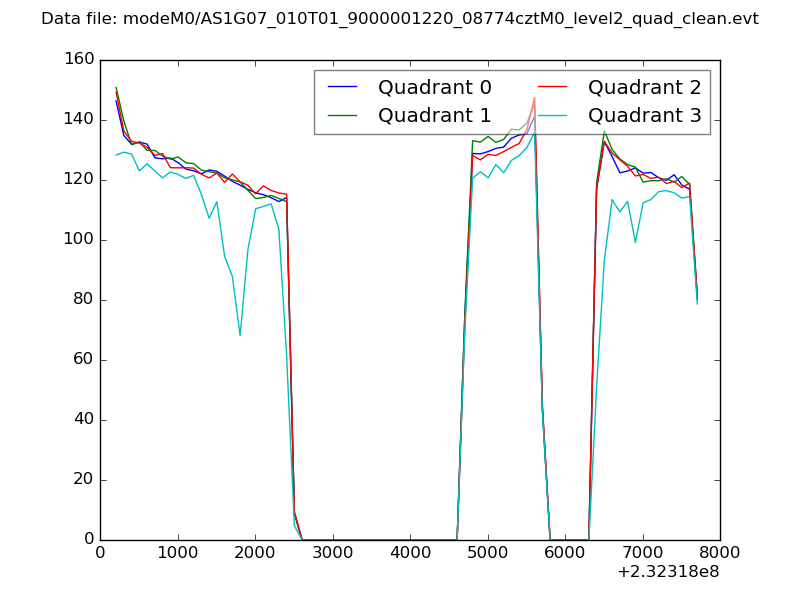 |
|
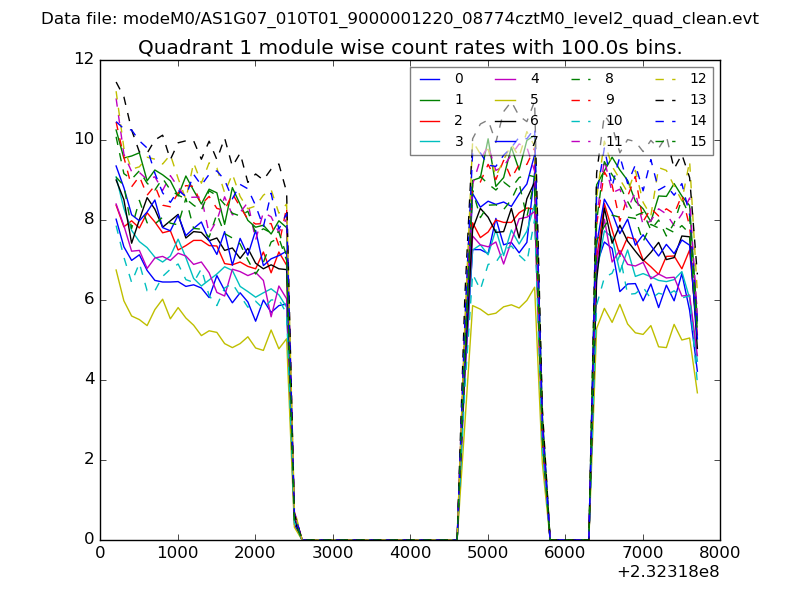
| Module-wise count rates for Quadrant A Data is divided into 100 sec bins |
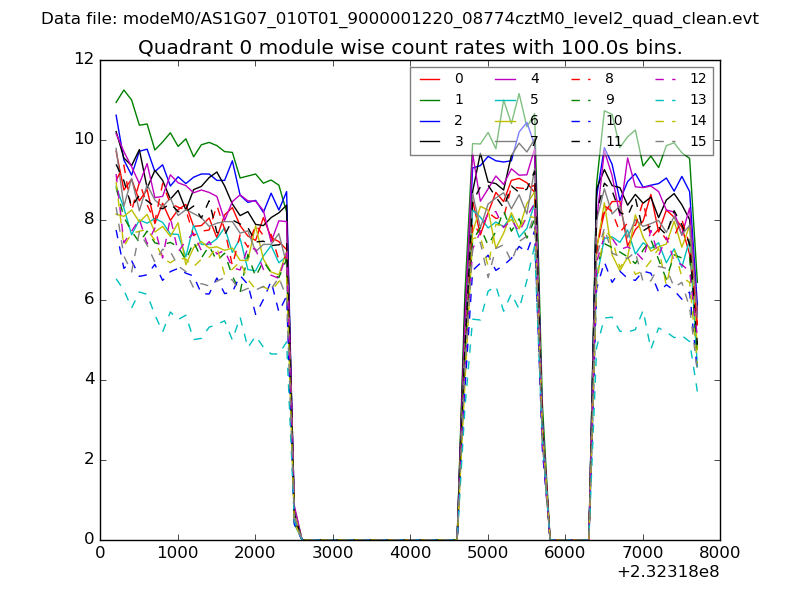 |
 |
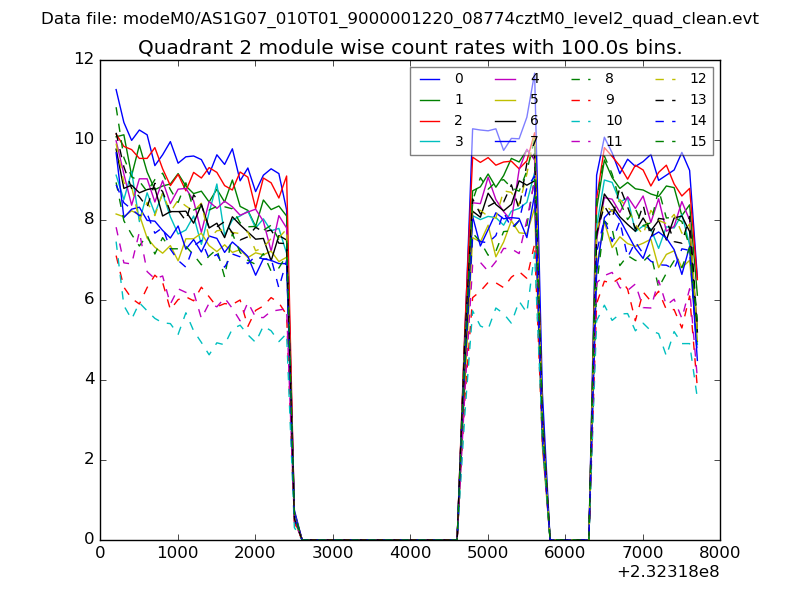
| Module-wise count rates for Quadrant B Data is divided into 100 sec bins |
 |
 |
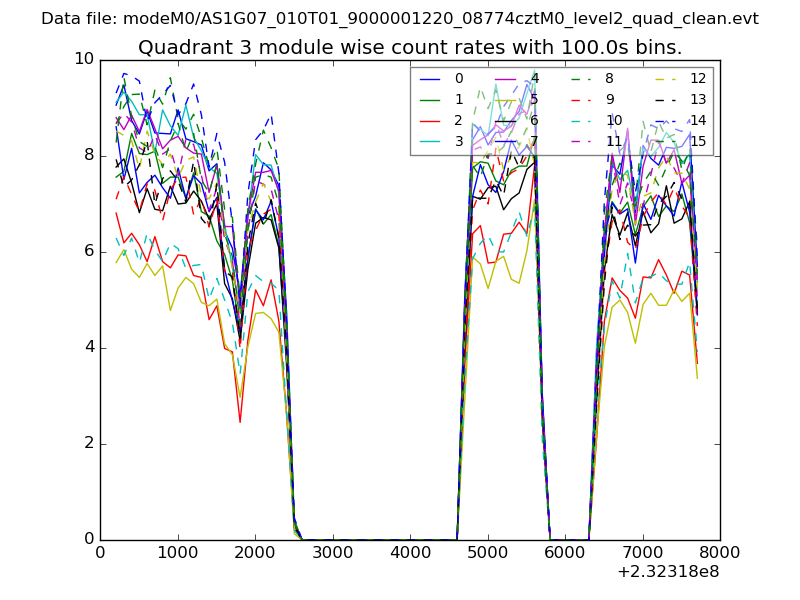
| Module-wise count rates for Quadrant C Data is divided into 100 sec bins |
 |
 |
| Module-wise count rates for Quadrant D Data is divided into 100 sec bins |
 |
 |
| Parameter | Plot |
|---|---|
| CZT HV Monitor | 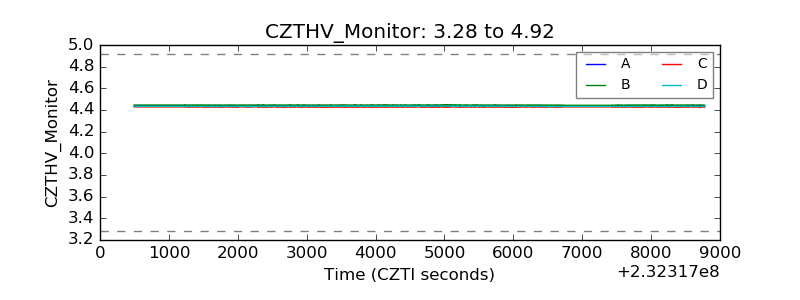 |
| D_VDD | 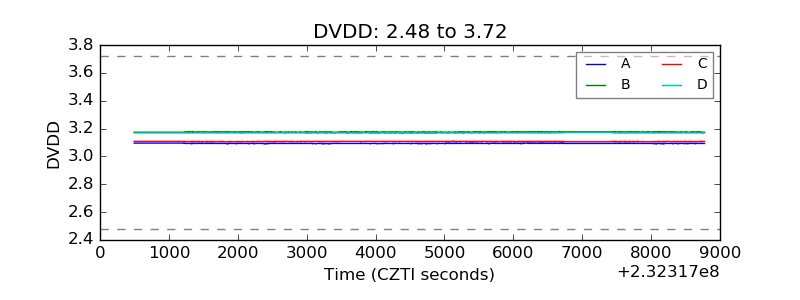 |
| Temperature 1 | 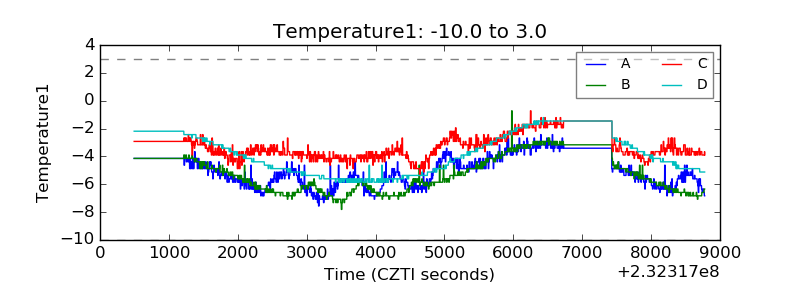 |
| Veto HV Monitor | 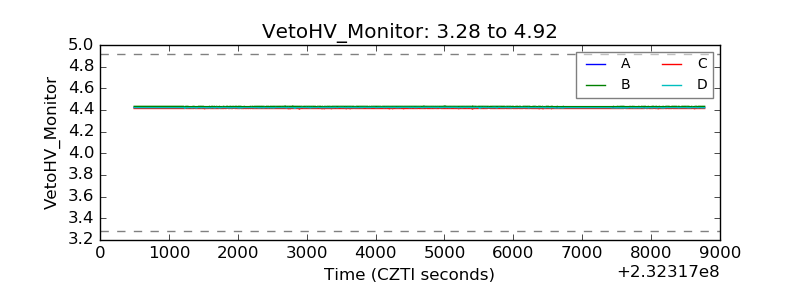 |
| Veto LLD | 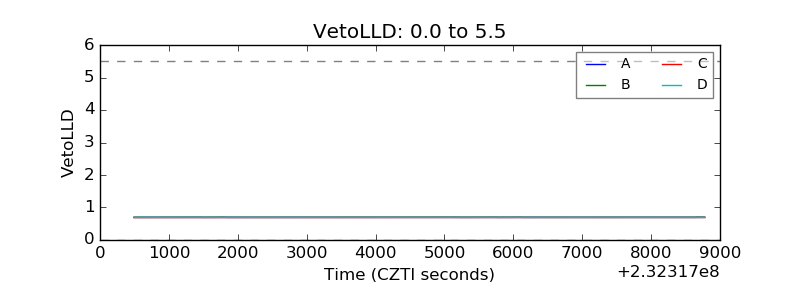 |
| Alpha Counter | 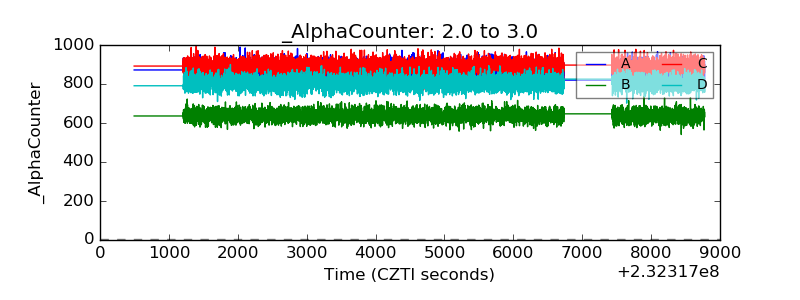 |
| _CPM_Rate | 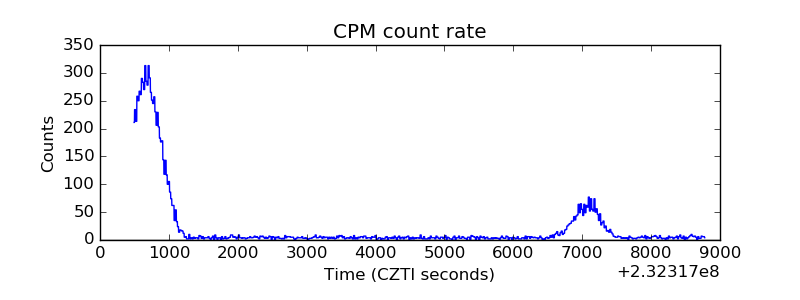 |
| CZT Counter | 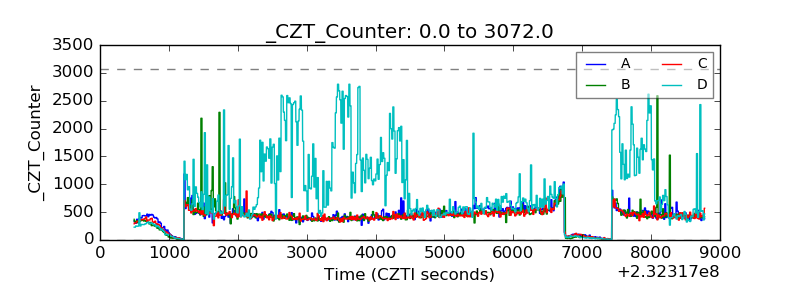 |
| +2.5 Volts monitor |  |
| +5 Volts monitor |  |
| _ROLL_ROT | 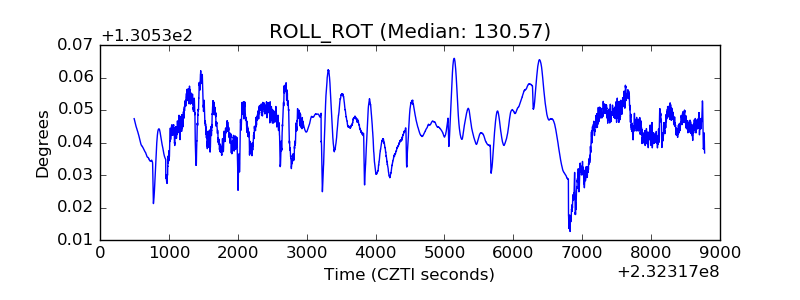 |
| _Roll_DEC | 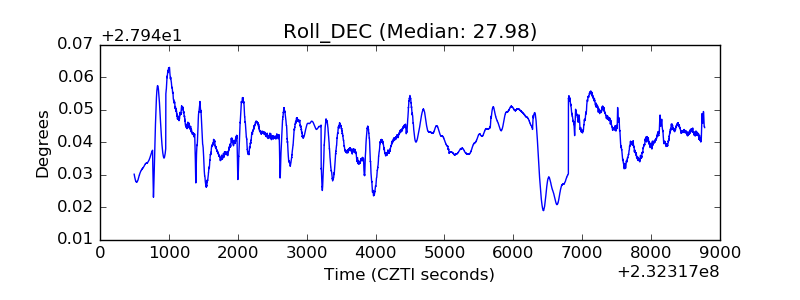 |
| _Roll_RA | 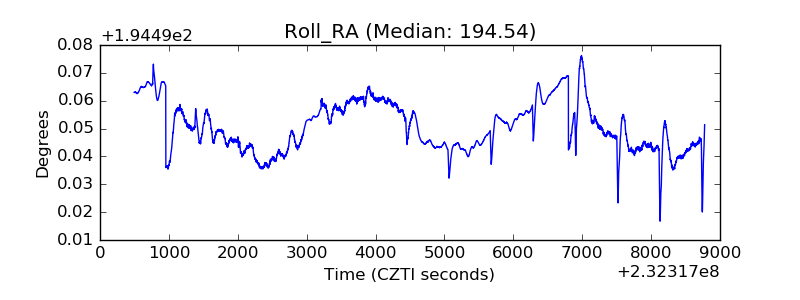 |
| Veto Counter | 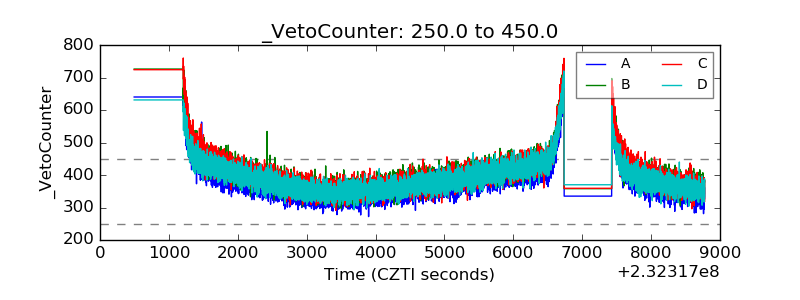 |