| Param | Original file | Final file |
|---|---|---|
| Filename | modeM0/AS1G07_010T01_9000001220_08775cztM0_level2.evt | modeM0/AS1G07_010T01_9000001220_08775cztM0_level2_quad_clean.evt |
| Size (bytes) | 647,357,760 | 112,777,920 |
| Size | 617.4 MB | 107.6 MB |
| Events in quadrant A | 4,304,218 | 725,106 |
| Events in quadrant B | 3,890,565 | 733,902 |
| Events in quadrant C | 3,691,775 | 728,643 |
| Events in quadrant D | 7,172,415 | 666,844 |
| Mode SS | |||
|---|---|---|---|
| Quadrant | BADHDUFLAG | Total packets | Discarded packets |
| A | 0 | 166 | 0 |
| B | 0 | 166 | 0 |
| C | 0 | 166 | 0 |
| D | 0 | 166 | 0 |
| Mode M0 | |||
|---|---|---|---|
| Quadrant | BADHDUFLAG | Total packets | Discarded packets |
| A | 0 | 18075 | 3 |
| B | 0 | 17036 | 2 |
| C | 0 | 16615 | 2 |
| D | 0 | 27131 | 2 |
| Mode M9 | |||
|---|---|---|---|
| Quadrant | BADHDUFLAG | Total packets | Discarded packets |
| A | 0 | 10 | 0 |
| B | 0 | 10 | 0 |
| C | 0 | 10 | 0 |
| D | 0 | 10 | 0 |
| Quadrant | Total seconds | Saturated seconds | Saturation percentage |
|---|---|---|---|
| A | 8066 | 85 | 1.053806% |
| B | 8066 | 84 | 1.041408% |
| C | 8066 | 24 | 0.297545% |
| D | 8066 | 572 | 7.091495% |
Noise dominated data is calculated using 1-second bins in cleaned event files. If a bin has >2000 counts, and if more than 50% of those come from <1% of pixels, then it is considered to be noise-dominated and hence unusable.
| Quadrant | # 1 sec bins | Bins with >0 counts | Bins with >2000 counts | High rate bins dominated by noise | Noise dominated (total time) | Noise dominated (detector-on time) | Marked lightcurve |
|---|---|---|---|---|---|---|---|
| A | 9042 | 8068 | 42 | 42 | 0.46% | 0.52% |  |
| B | 9042 | 8068 | 12 | 12 | 0.13% | 0.15% | 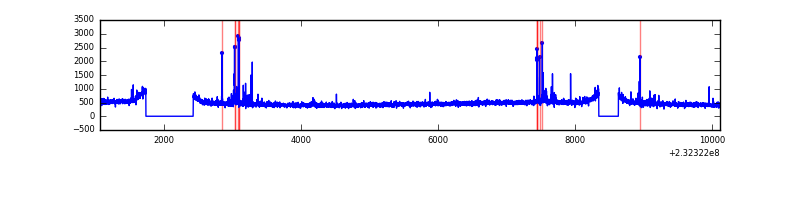 |
| C | 9042 | 8068 | 0 | 0 | 0.00% | 0.00% | 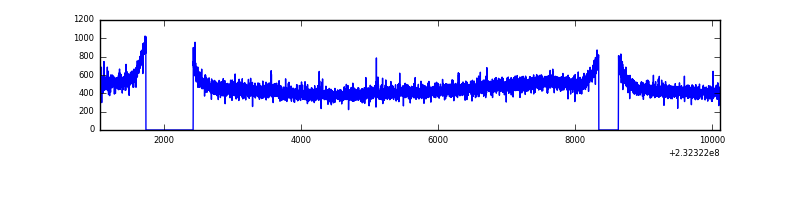 |
| D | 9042 | 8068 | 440 | 440 | 4.87% | 5.45% | 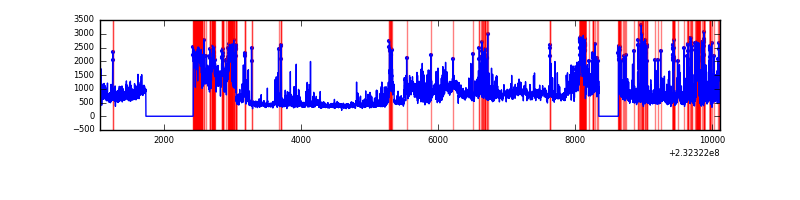 |
Top three noisy pixels from each quadrant. If the there are fewer than three noisy pixels in the level2.evt file, extra rows are filled as -1
| Pixel properties | Quadrant properties | ||||||
|---|---|---|---|---|---|---|---|
| Quadrant | DetID | PixID | Counts | Sigma | Mean | Median | Sigma |
| A | 8 | 5 | 482080 | 2413.93 | 963 | 940 | 199.3 |
| A | 13 | 251 | 53016 | 261.27 | 963 | 940 | 199.3 |
| A | 13 | 248 | 33830 | 165.01 | 963 | 940 | 199.3 |
| B | 10 | 16 | 86728 | 462.41 | 966 | 941 | 185.5 |
| B | 4 | 173 | 24225 | 125.51 | 966 | 941 | 185.5 |
| B | 12 | 111 | 21132 | 108.83 | 966 | 941 | 185.5 |
| C | 9 | 68 | 9430 | 38.52 | 943 | 946 | 220.3 |
| C | 13 | 61 | 6954 | 27.28 | 943 | 946 | 220.3 |
| C | 9 | 54 | 4949 | 18.17 | 943 | 946 | 220.3 |
| D | 2 | 16 | 2639722 | 11965.05 | 907 | 884 | 220.5 |
| D | 2 | 152 | 411248 | 1860.68 | 907 | 884 | 220.5 |
| D | 1 | 52 | 311482 | 1408.31 | 907 | 884 | 220.5 |
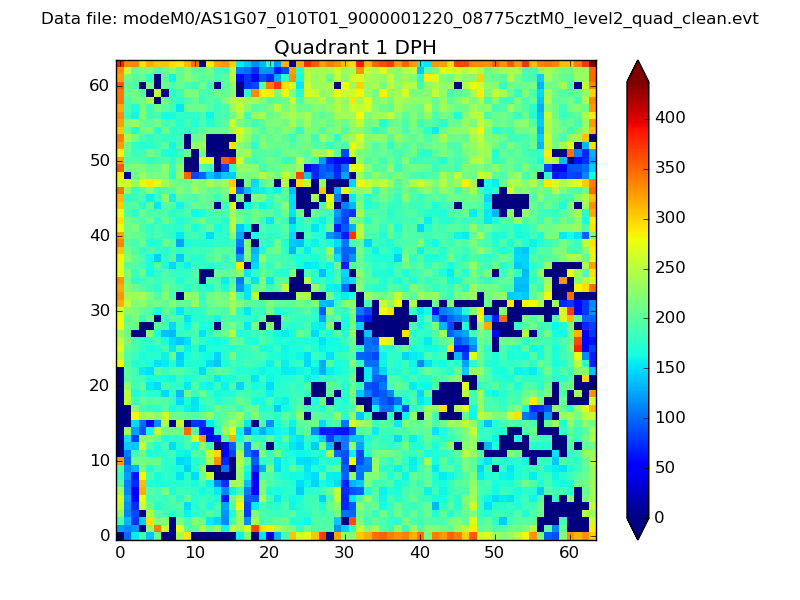
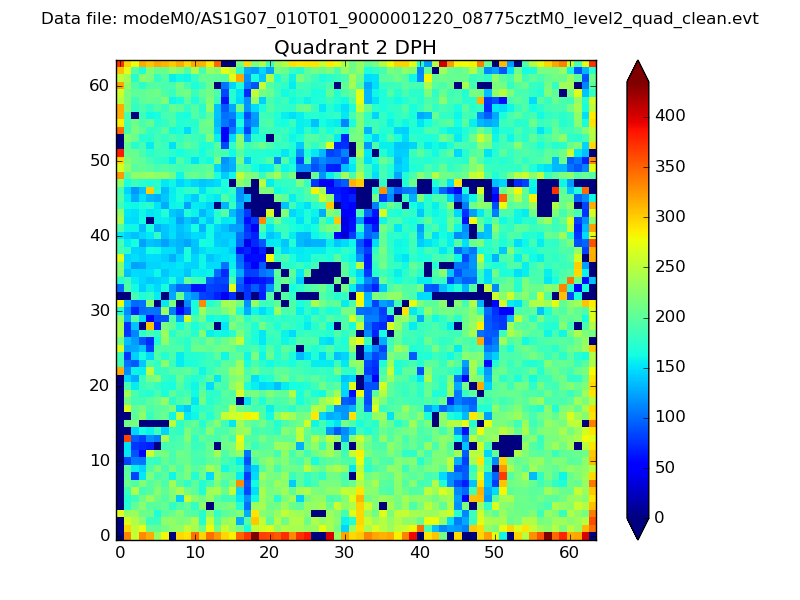
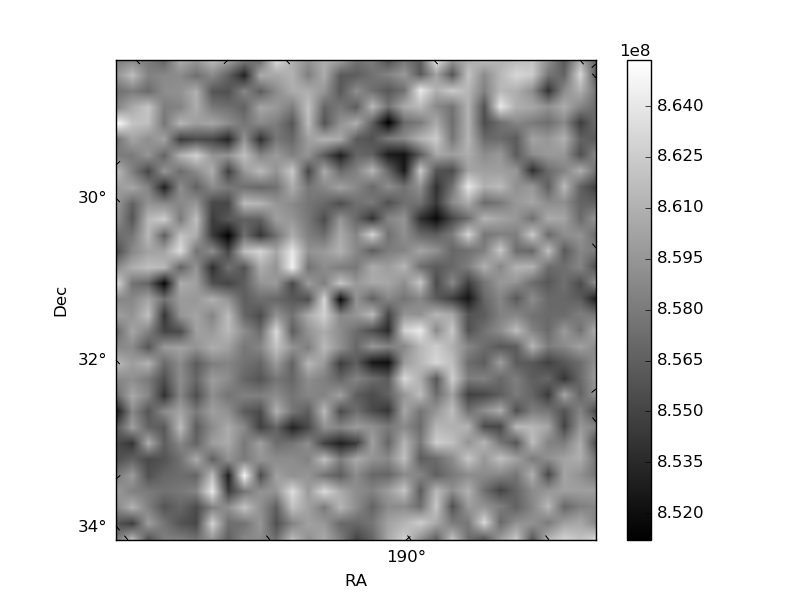
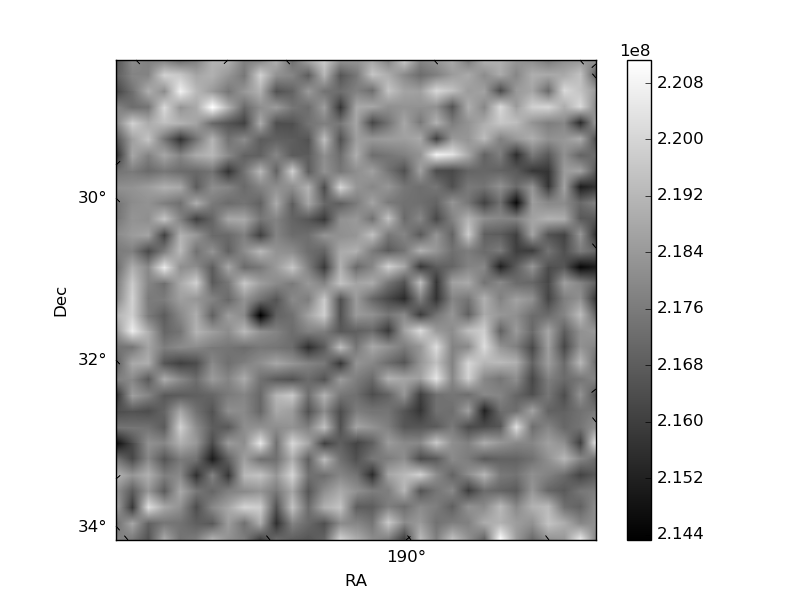
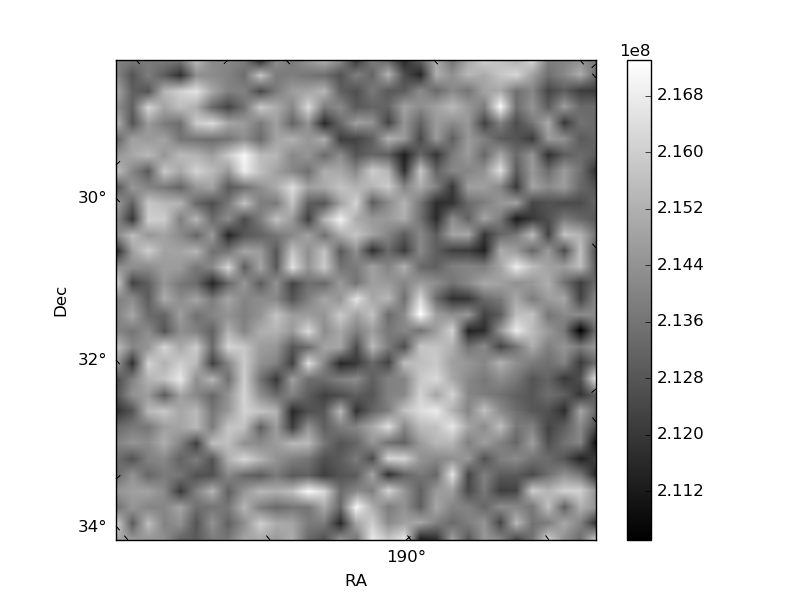
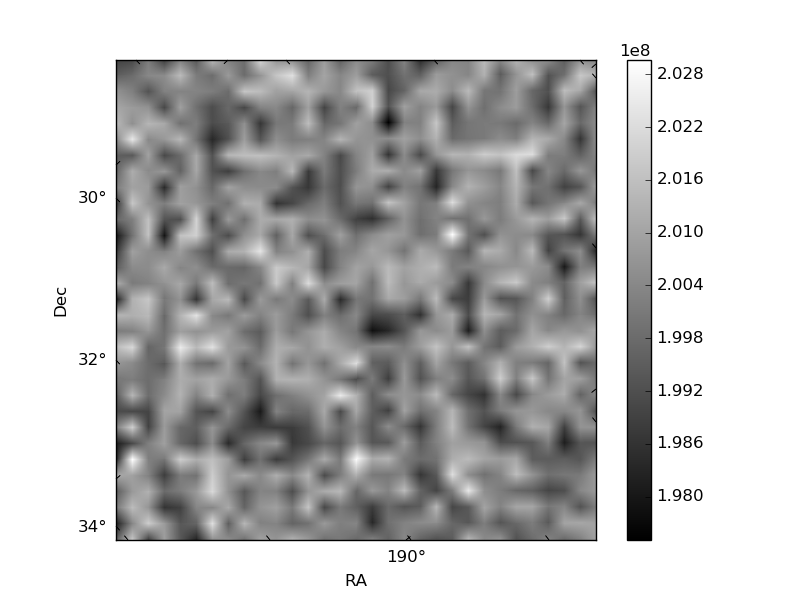
Histogram calculated using DETX and DETY for each event in the final _common_clean file
| Quadrant A | 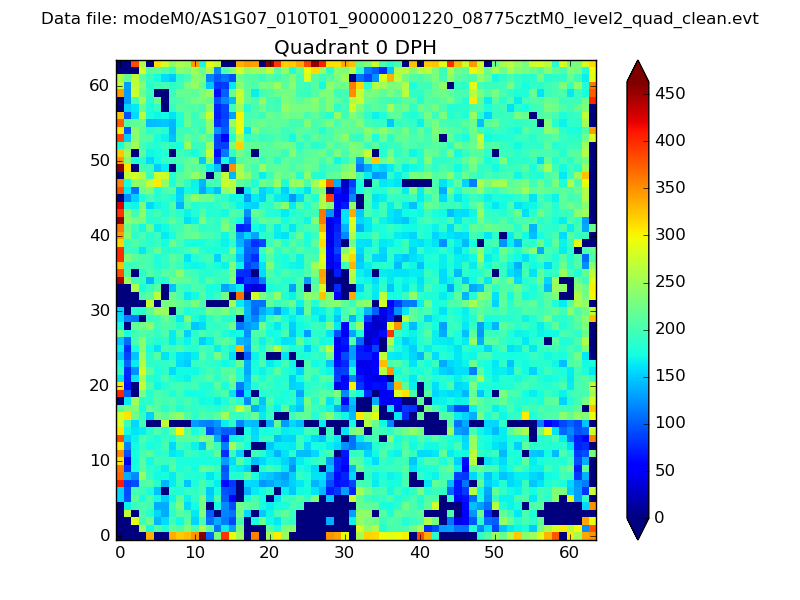 |
 |
Quadrant B |
|---|---|---|---|
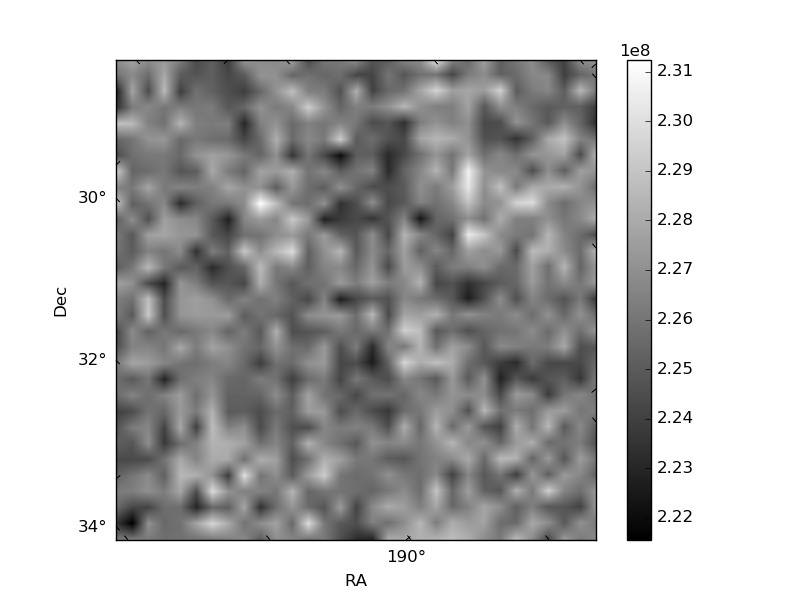
| Quadrant D | 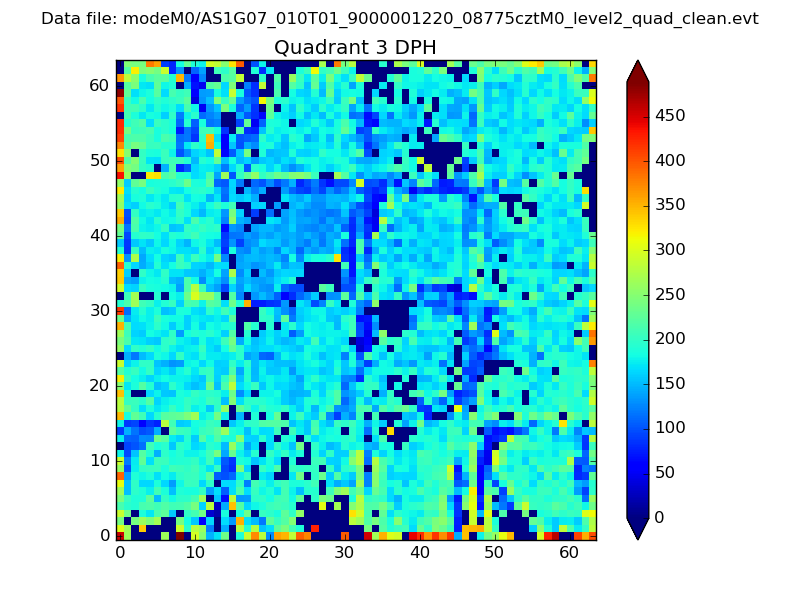 |
 |
Quadrant C |
| Plot type | Count rate plots | Images |
|---|---|---|
| Comparison with Poisson distribution Blue bars denote a histogram of data divided into 1 sec bins. Red curve is a Poisson curve with rate = median count rate of data. |
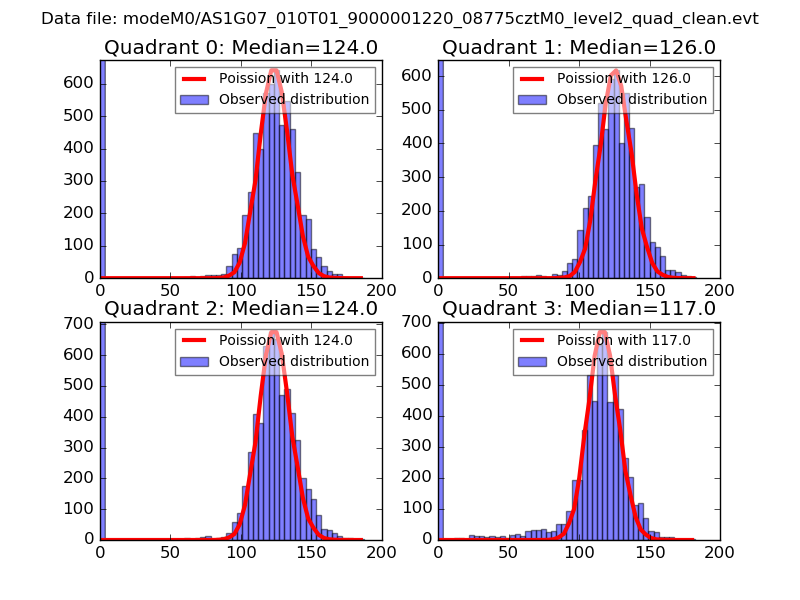 |
 |
| Quadrant-wise count rates Data is divided into 100 sec bins |
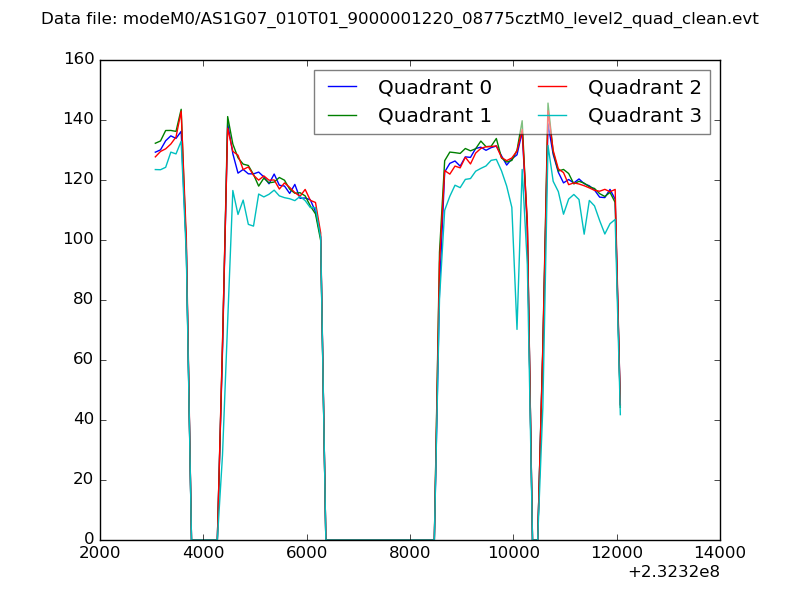 |
|
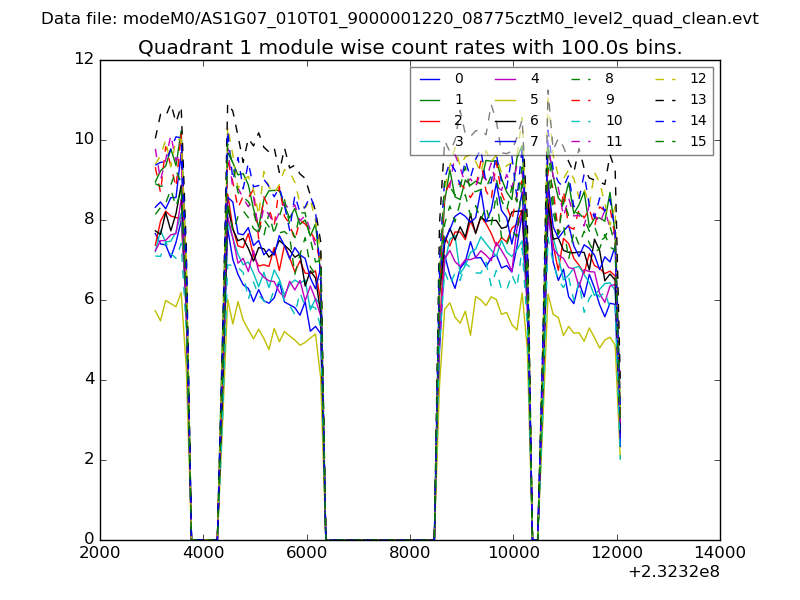
| Module-wise count rates for Quadrant A Data is divided into 100 sec bins |
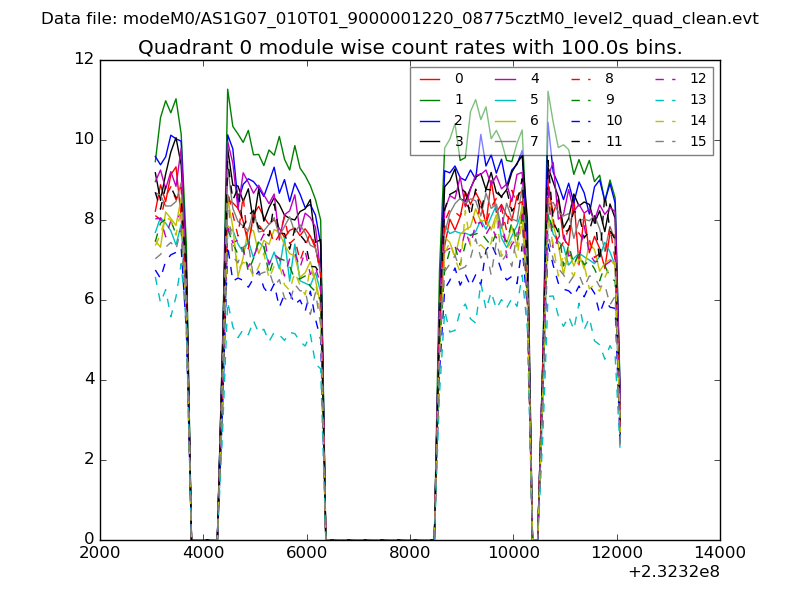 |
 |
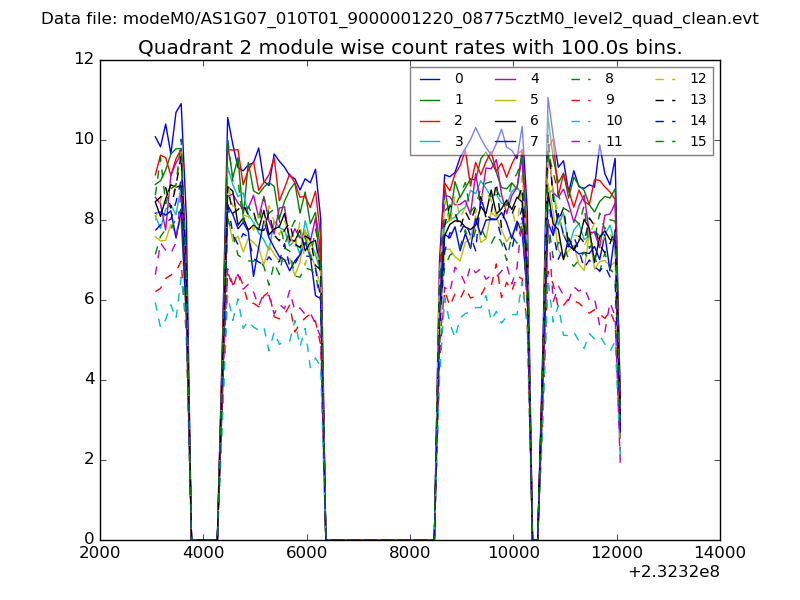
| Module-wise count rates for Quadrant B Data is divided into 100 sec bins |
 |
 |
| Module-wise count rates for Quadrant C Data is divided into 100 sec bins |
 |
 |
| Module-wise count rates for Quadrant D Data is divided into 100 sec bins |
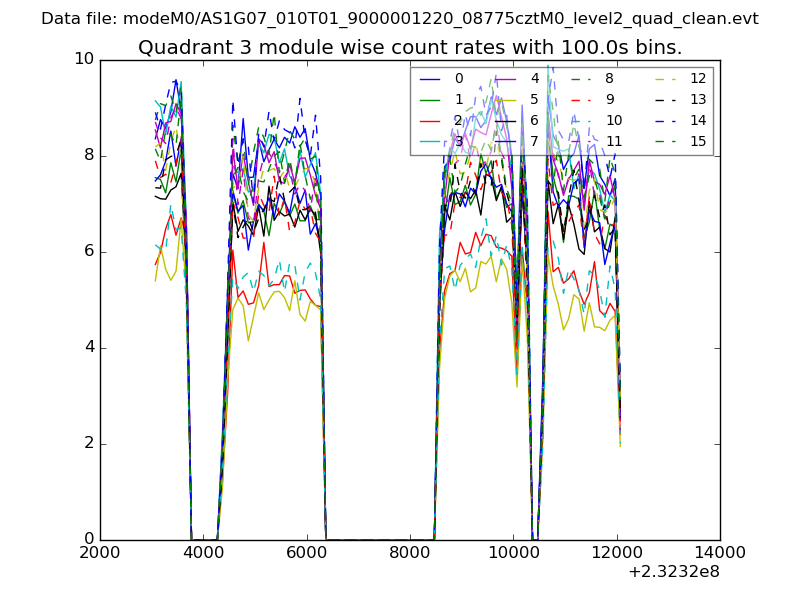 |
 |
| Parameter | Plot |
|---|---|
| CZT HV Monitor | 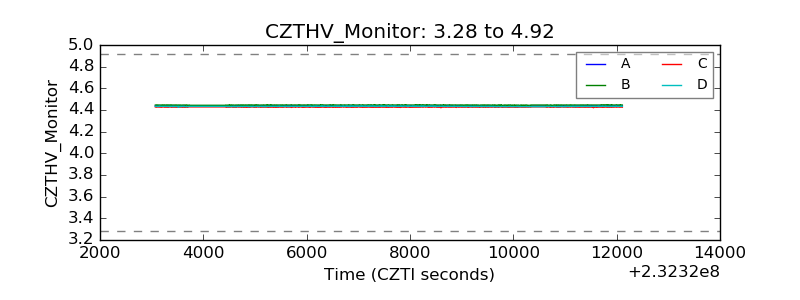 |
| D_VDD | 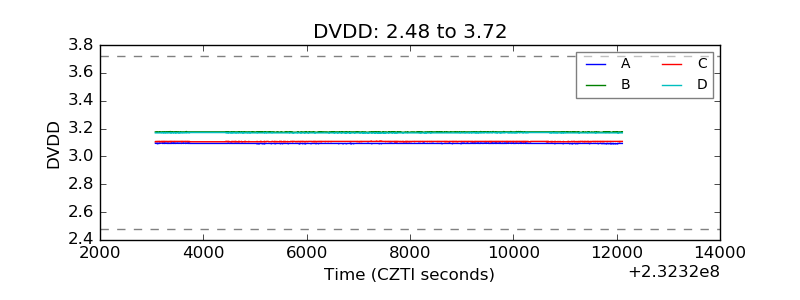 |
| Temperature 1 | 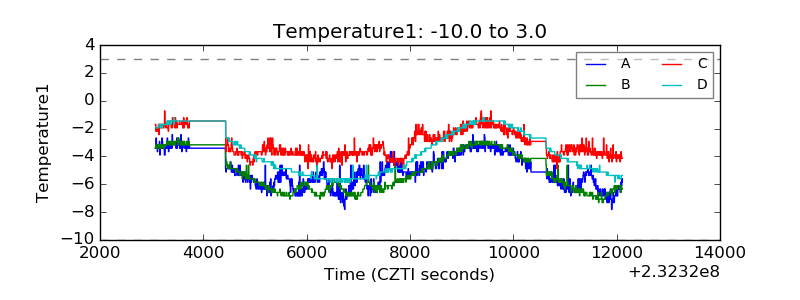 |
| Veto HV Monitor | 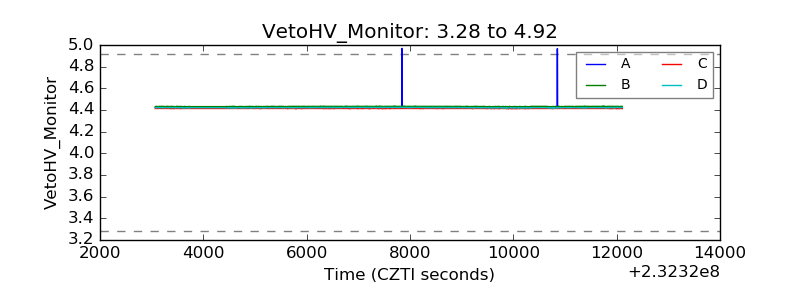 |
| Veto LLD | 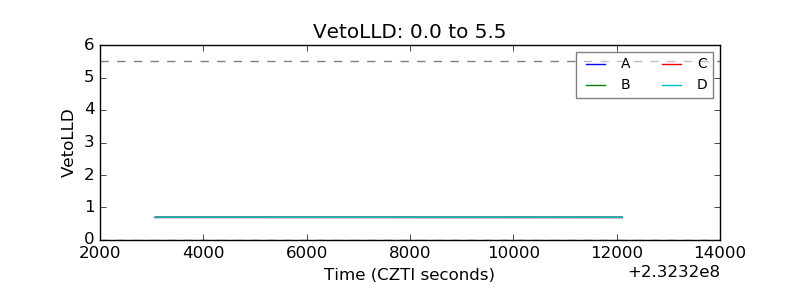 |
| Alpha Counter | 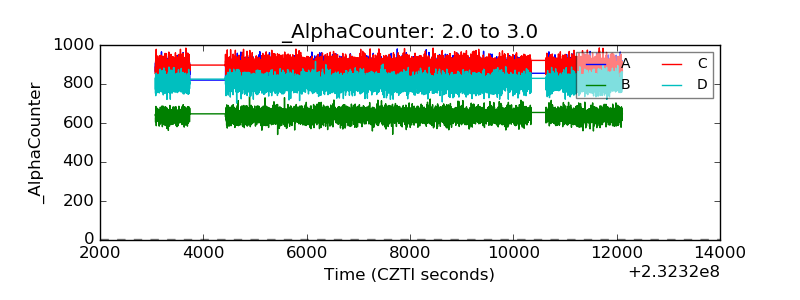 |
| _CPM_Rate | 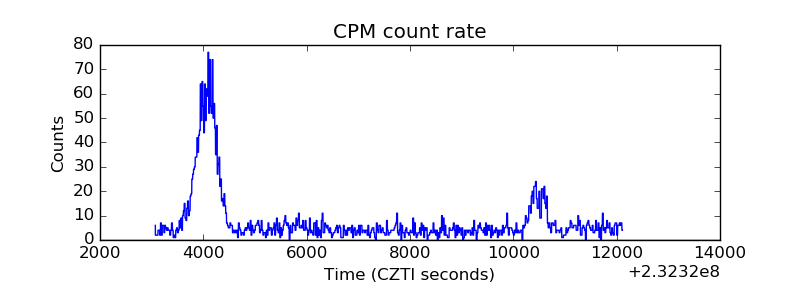 |
| CZT Counter | 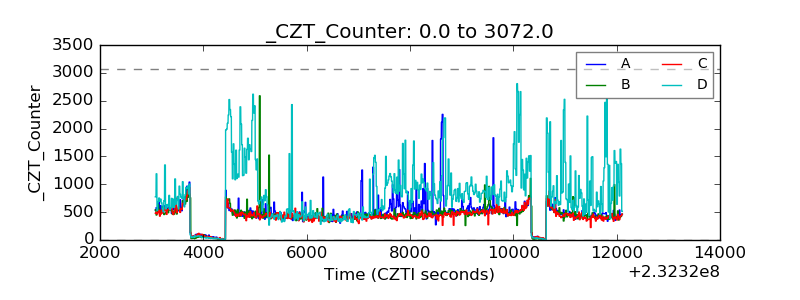 |
| +2.5 Volts monitor |  |
| +5 Volts monitor | 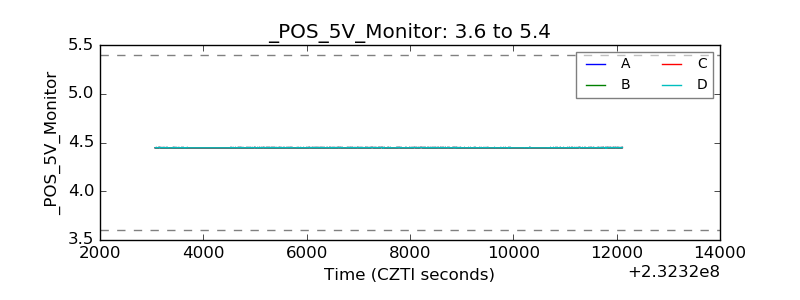 |
| _ROLL_ROT | 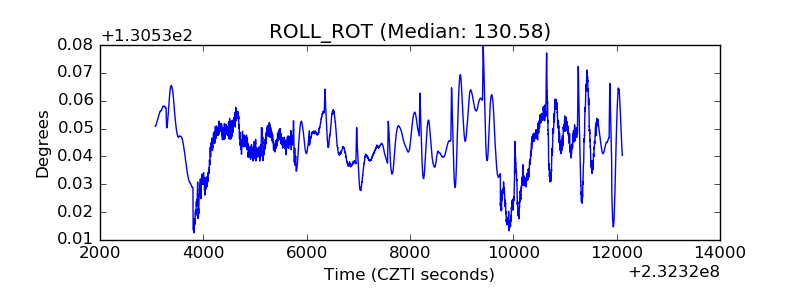 |
| _Roll_DEC | 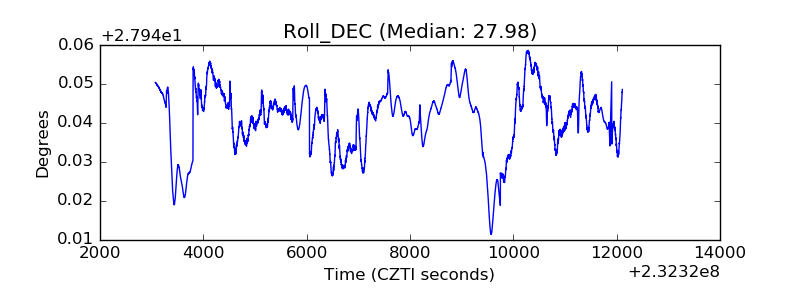 |
| _Roll_RA |  |
| Veto Counter | 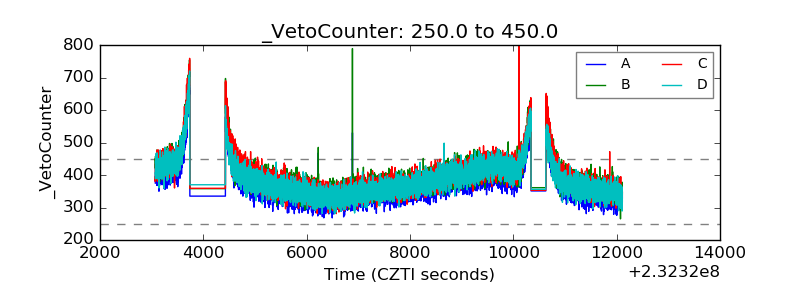 |