| Param | Original file | Final file |
|---|---|---|
| Filename | modeM0/AS1G07_010T01_9000001220_08776cztM0_level2.evt | modeM0/AS1G07_010T01_9000001220_08776cztM0_level2_quad_clean.evt |
| Size (bytes) | 676,368,000 | 114,405,120 |
| Size | 645.0 MB | 109.1 MB |
| Events in quadrant A | 4,247,374 | 732,511 |
| Events in quadrant B | 4,205,834 | 738,830 |
| Events in quadrant C | 4,345,904 | 727,211 |
| Events in quadrant D | 7,111,213 | 677,649 |
| Mode SS | |||
|---|---|---|---|
| Quadrant | BADHDUFLAG | Total packets | Discarded packets |
| A | 0 | 174 | 0 |
| B | 0 | 174 | 0 |
| C | 0 | 174 | 0 |
| D | 0 | 174 | 0 |
| Mode M0 | |||
|---|---|---|---|
| Quadrant | BADHDUFLAG | Total packets | Discarded packets |
| A | 0 | 18182 | 4 |
| B | 0 | 18294 | 3 |
| C | 0 | 18788 | 3 |
| D | 0 | 27102 | 3 |
| Mode M9 | |||
|---|---|---|---|
| Quadrant | BADHDUFLAG | Total packets | Discarded packets |
| A | 0 | 4 | 0 |
| B | 0 | 4 | 0 |
| C | 0 | 4 | 0 |
| D | 0 | 4 | 0 |
| Quadrant | Total seconds | Saturated seconds | Saturation percentage |
|---|---|---|---|
| A | 8468 | 98 | 1.157298% |
| B | 8468 | 178 | 2.102031% |
| C | 8468 | 224 | 2.645253% |
| D | 8468 | 604 | 7.132735% |
Noise dominated data is calculated using 1-second bins in cleaned event files. If a bin has >2000 counts, and if more than 50% of those come from <1% of pixels, then it is considered to be noise-dominated and hence unusable.
| Quadrant | # 1 sec bins | Bins with >0 counts | Bins with >2000 counts | High rate bins dominated by noise | Noise dominated (total time) | Noise dominated (detector-on time) | Marked lightcurve |
|---|---|---|---|---|---|---|---|
| A | 8874 | 8470 | 0 | 0 | 0.00% | 0.00% | 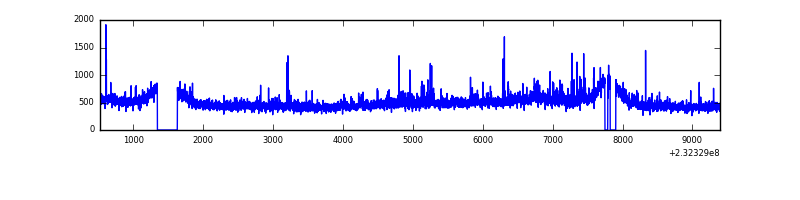 |
| B | 8874 | 8470 | 17 | 17 | 0.19% | 0.20% | 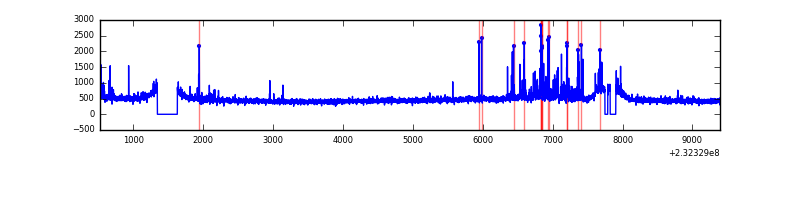 |
| C | 8874 | 8471 | 168 | 168 | 1.89% | 1.98% | 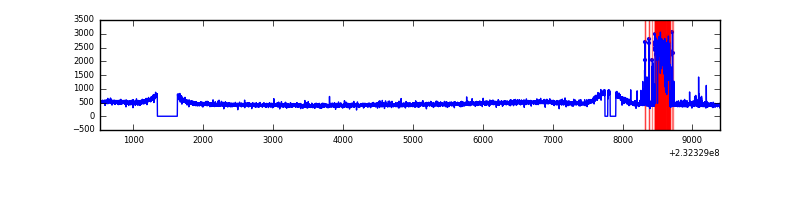 |
| D | 8874 | 8470 | 406 | 406 | 4.58% | 4.79% | 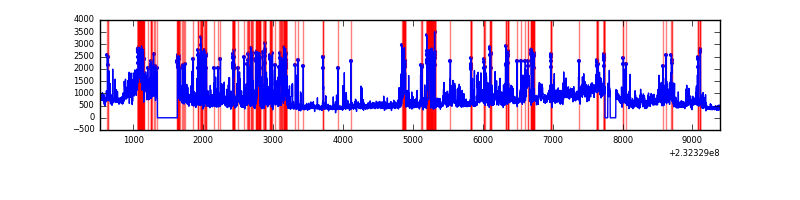 |
Top three noisy pixels from each quadrant. If the there are fewer than three noisy pixels in the level2.evt file, extra rows are filled as -1
| Pixel properties | Quadrant properties | ||||||
|---|---|---|---|---|---|---|---|
| Quadrant | DetID | PixID | Counts | Sigma | Mean | Median | Sigma |
| A | 8 | 5 | 258673 | 1240.95 | 1011 | 986 | 207.7 |
| A | 13 | 251 | 63992 | 303.42 | 1011 | 986 | 207.7 |
| A | 5 | 16 | 14214 | 63.7 | 1011 | 986 | 207.7 |
| B | 10 | 16 | 206378 | 1053.14 | 1014 | 986 | 195.0 |
| B | 12 | 111 | 22187 | 108.71 | 1014 | 986 | 195.0 |
| B | 11 | 111 | 17928 | 86.87 | 1014 | 986 | 195.0 |
| C | 9 | 68 | 494914 | 2154.96 | 987 | 991 | 229.2 |
| C | 13 | 61 | 7172 | 26.97 | 987 | 991 | 229.2 |
| C | 8 | 222 | 2686 | 7.4 | 987 | 991 | 229.2 |
| D | 2 | 16 | 1850460 | 8031.66 | 955 | 932 | 230.3 |
| D | 1 | 52 | 713843 | 3095.85 | 955 | 932 | 230.3 |
| D | 2 | 152 | 440182 | 1907.46 | 955 | 932 | 230.3 |
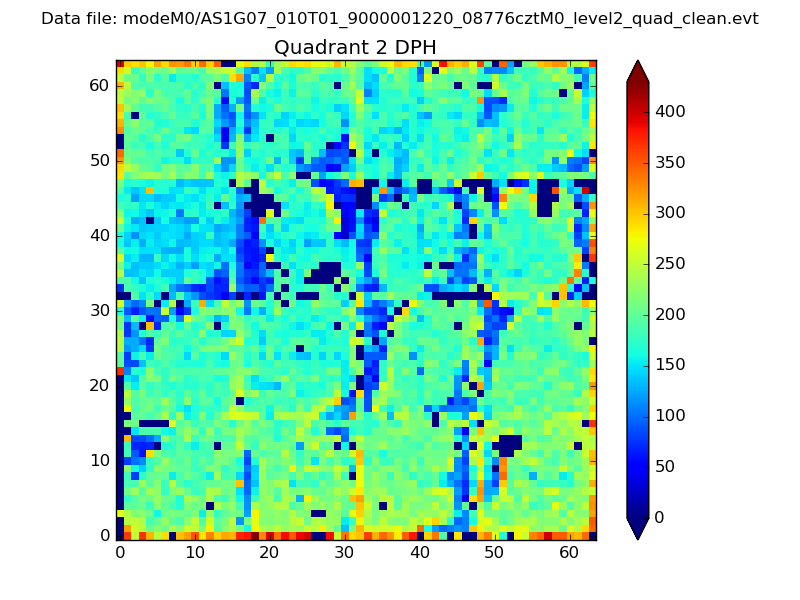
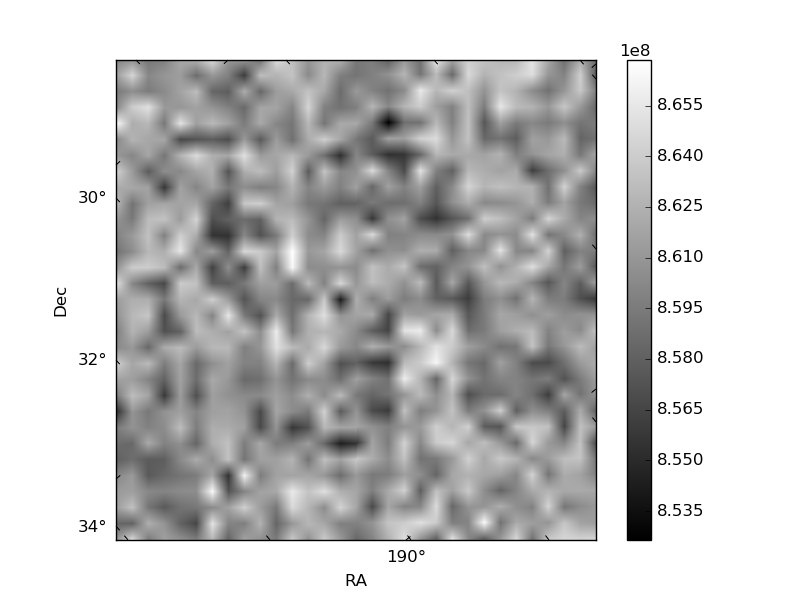
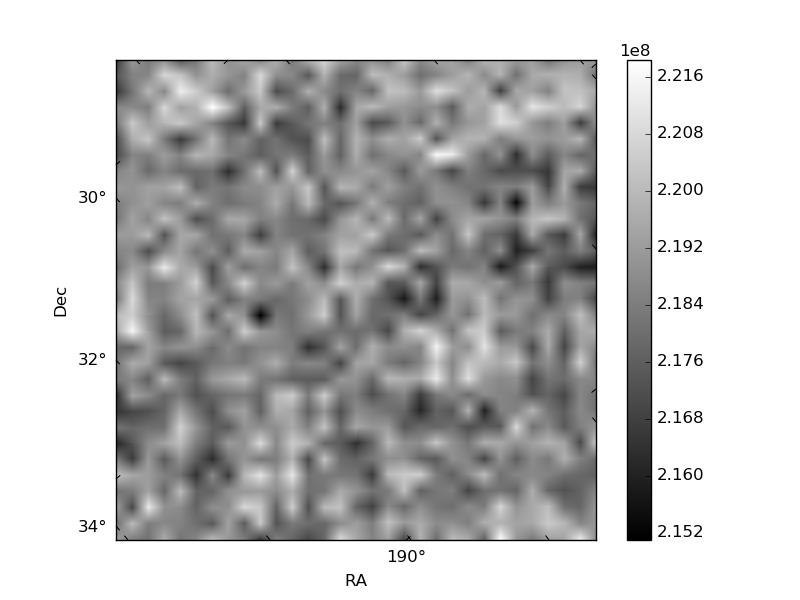
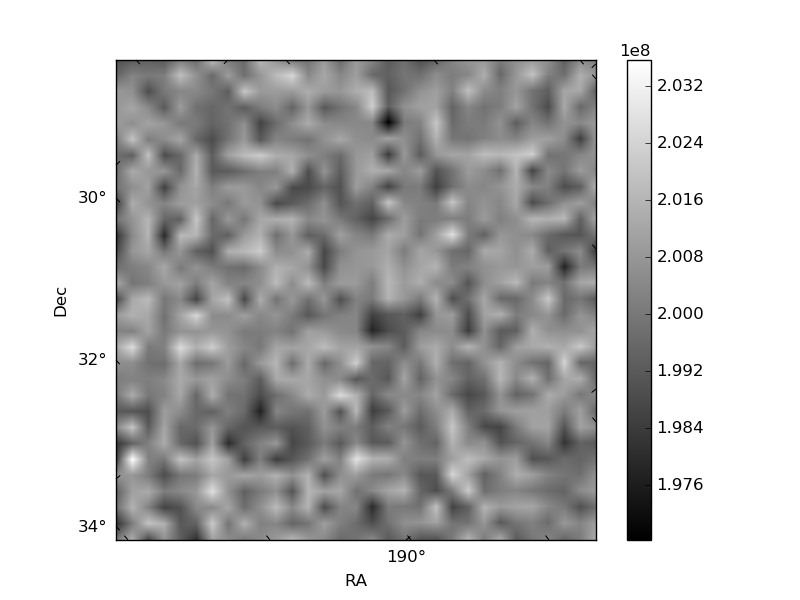
Histogram calculated using DETX and DETY for each event in the final _common_clean file
| Quadrant A | 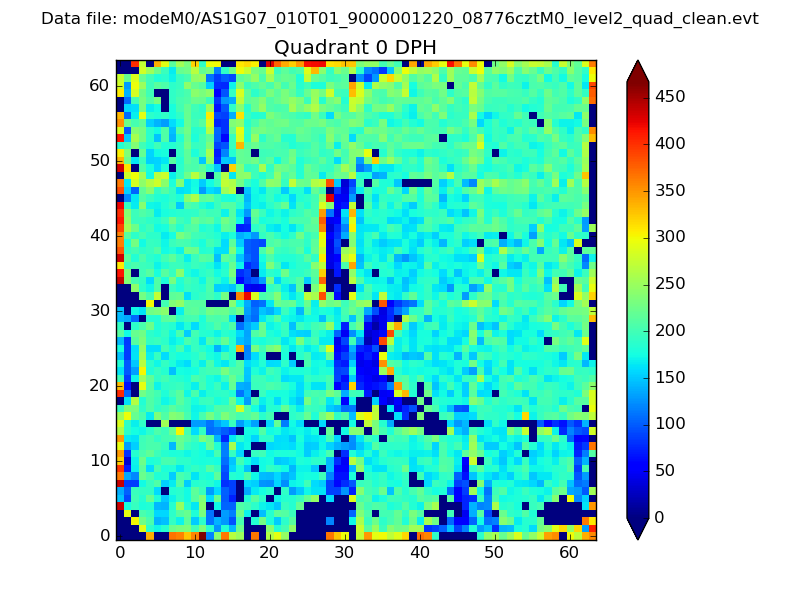 |
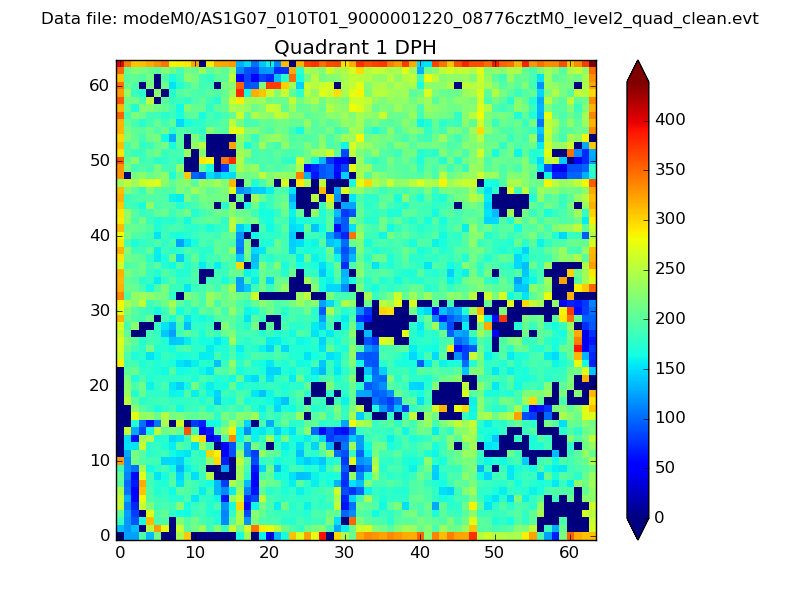 |
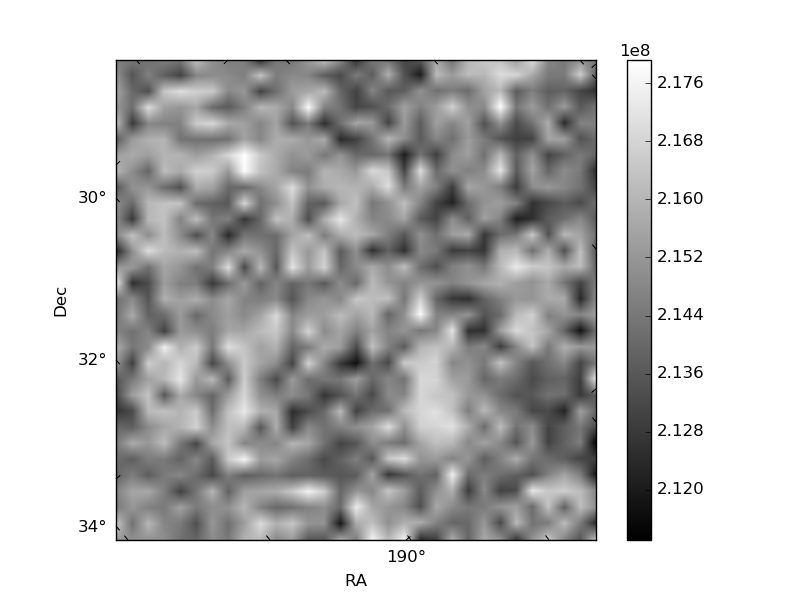
Quadrant B |
|---|---|---|---|
| Quadrant D | 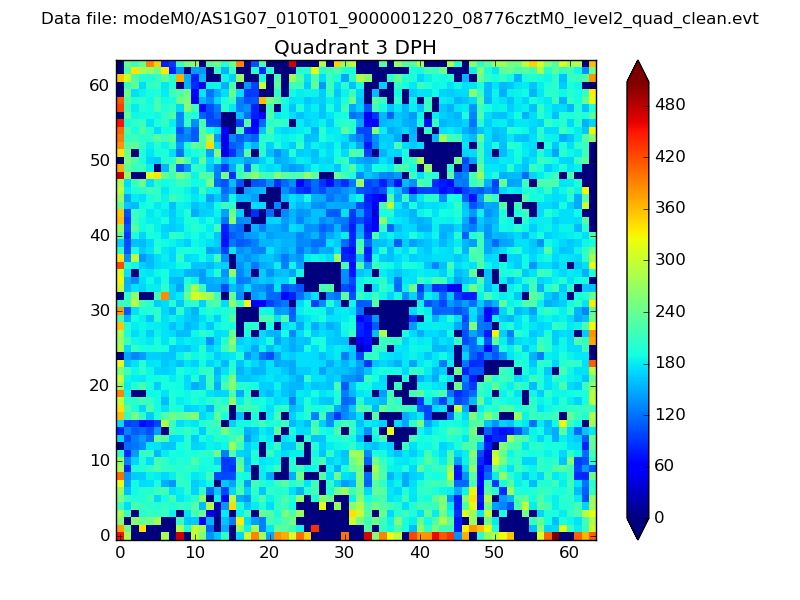 |
 |
Quadrant C |
| Plot type | Count rate plots | Images |
|---|---|---|
| Comparison with Poisson distribution Blue bars denote a histogram of data divided into 1 sec bins. Red curve is a Poisson curve with rate = median count rate of data. |
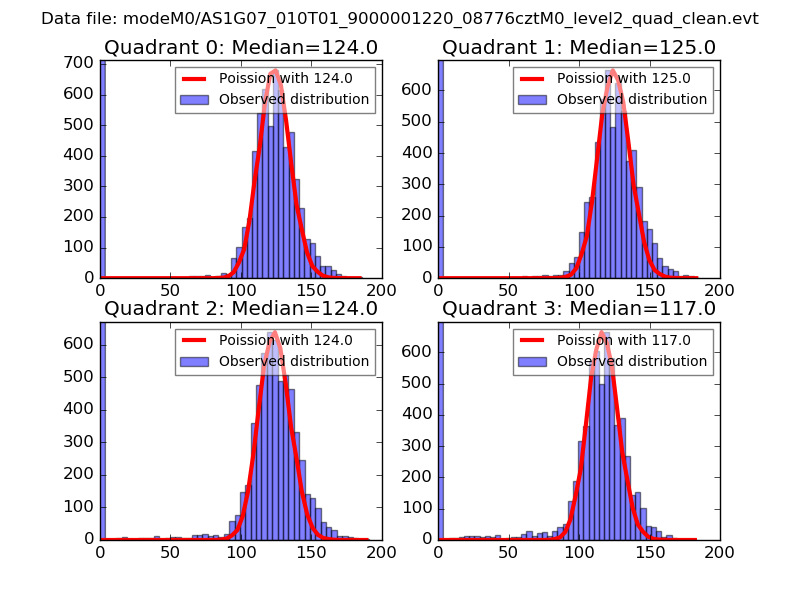 |
 |
| Quadrant-wise count rates Data is divided into 100 sec bins |
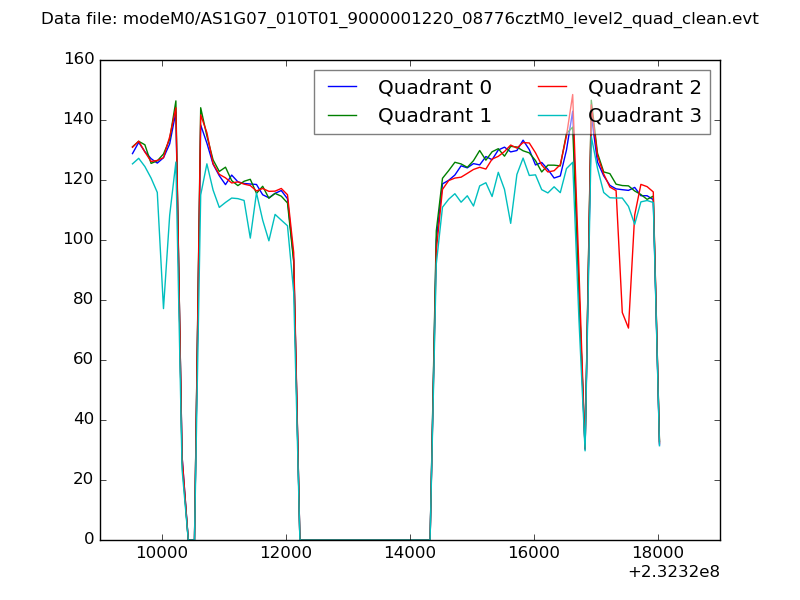 |
|
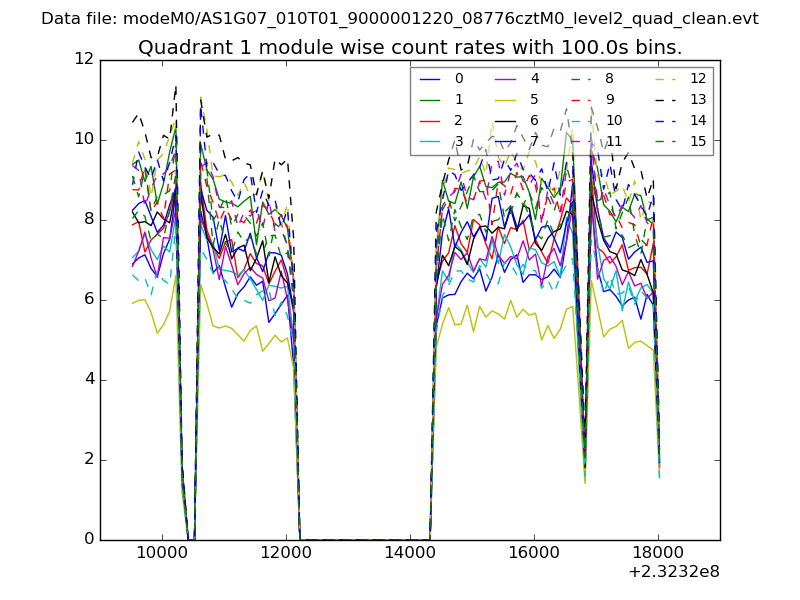
| Module-wise count rates for Quadrant A Data is divided into 100 sec bins |
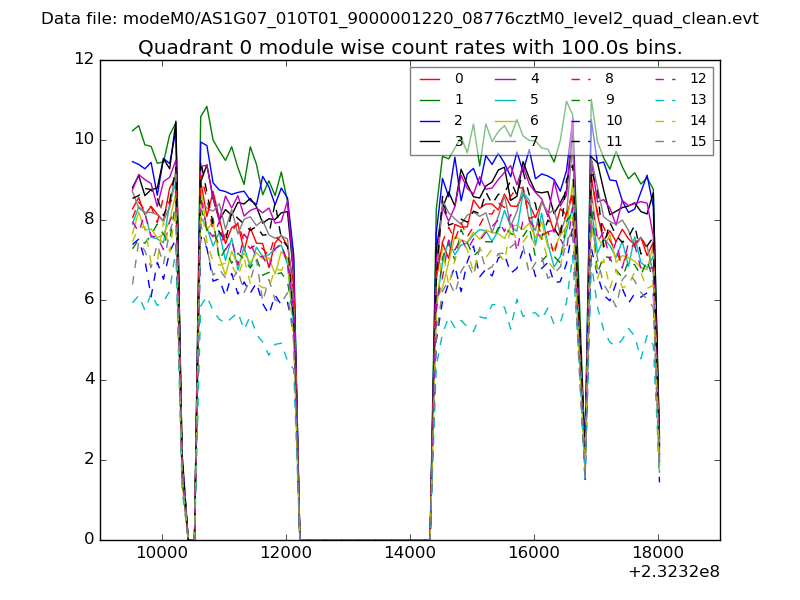 |
 |
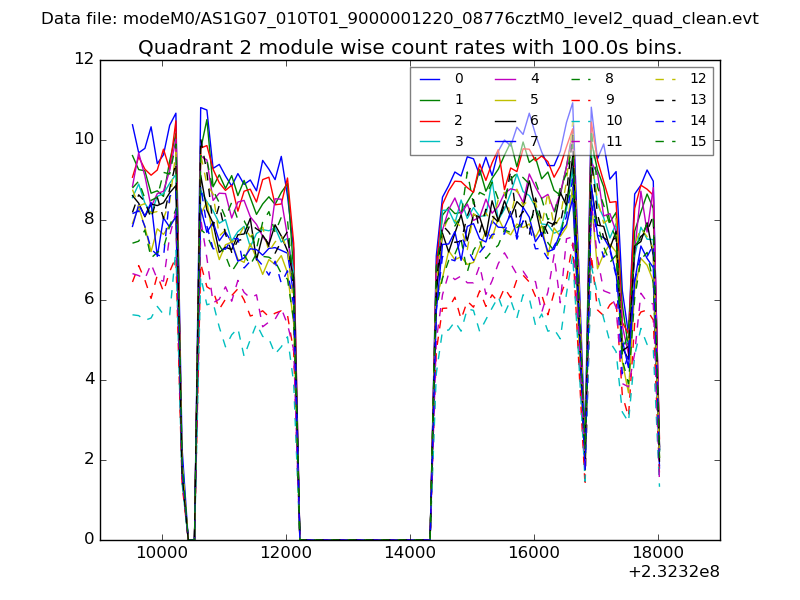
| Module-wise count rates for Quadrant B Data is divided into 100 sec bins |
 |
 |
| Module-wise count rates for Quadrant C Data is divided into 100 sec bins |
 |
 |
| Module-wise count rates for Quadrant D Data is divided into 100 sec bins |
 |
 |
| Parameter | Plot |
|---|---|
| CZT HV Monitor | 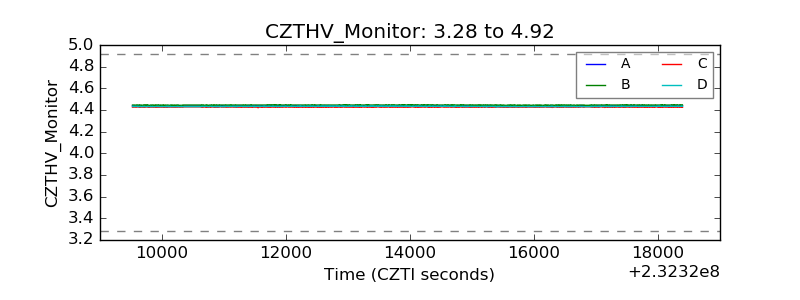 |
| D_VDD | 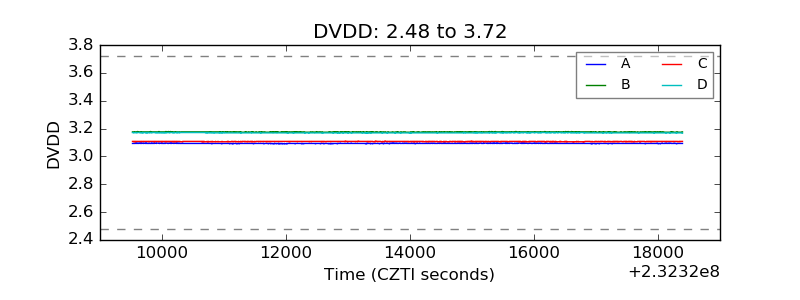 |
| Temperature 1 | 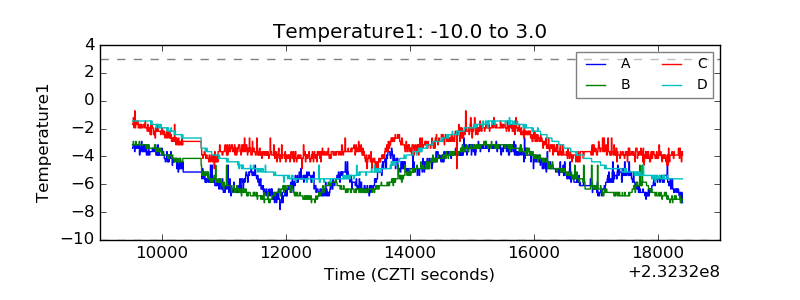 |
| Veto HV Monitor | 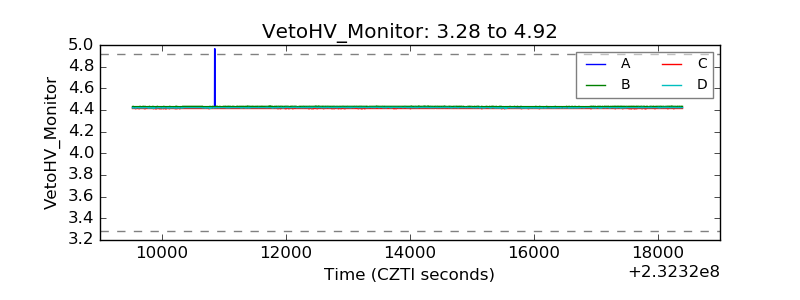 |
| Veto LLD | 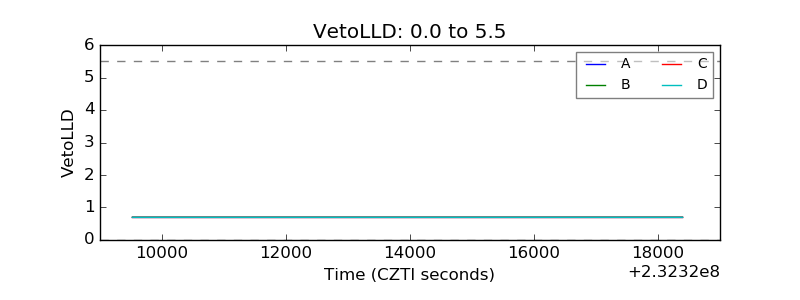 |
| Alpha Counter | 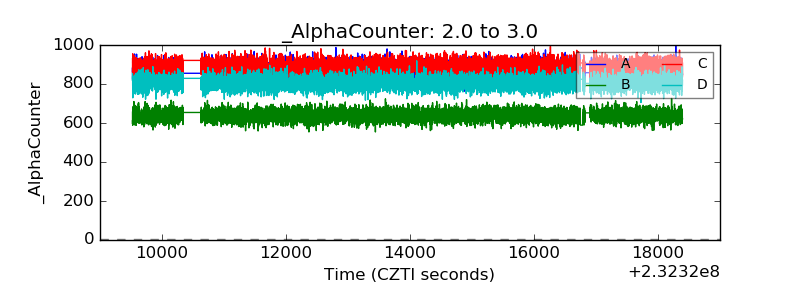 |
| _CPM_Rate | 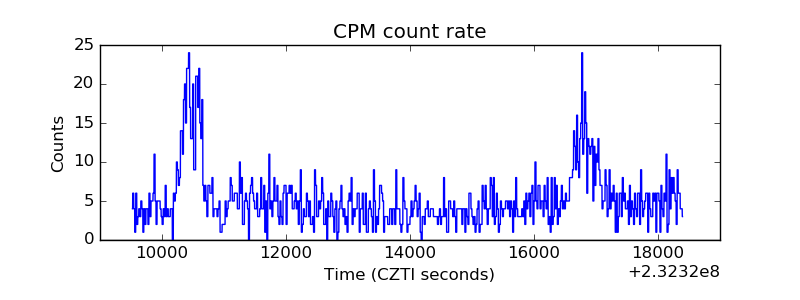 |
| CZT Counter | 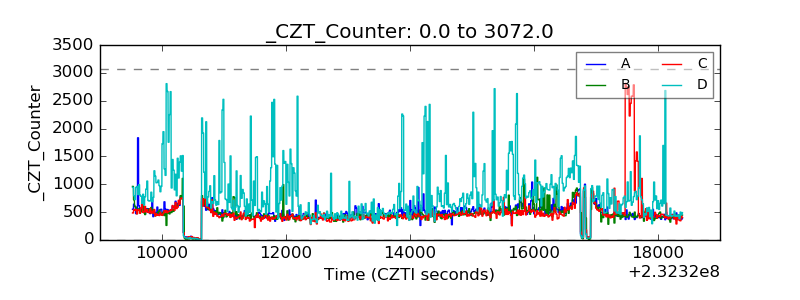 |
| +2.5 Volts monitor |  |
| +5 Volts monitor | 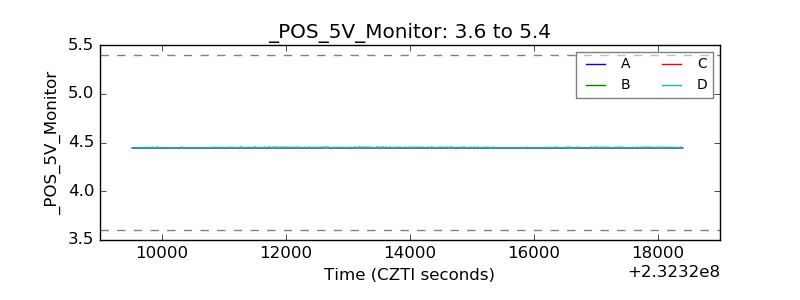 |
| _ROLL_ROT | 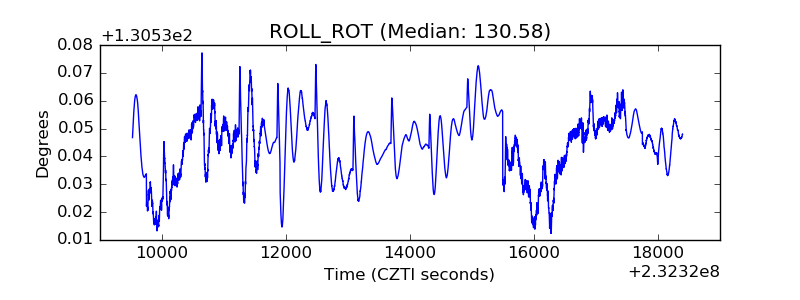 |
| _Roll_DEC | 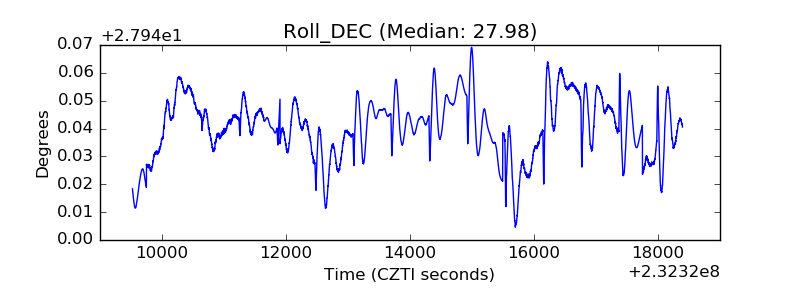 |
| _Roll_RA | 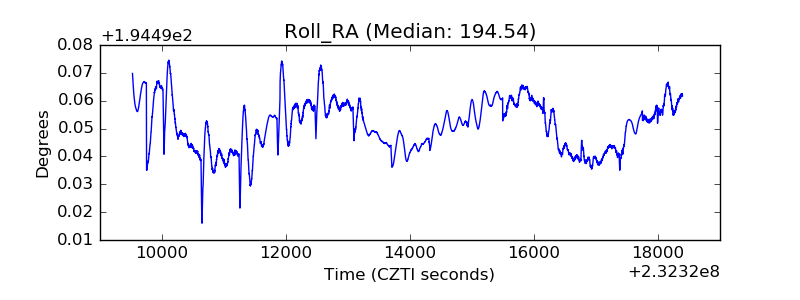 |
| Veto Counter | 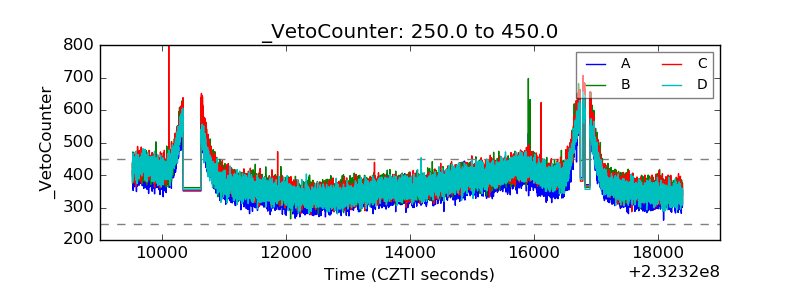 |