| Param | Original file | Final file |
|---|---|---|
| Filename | modeM0/AS1G07_010T01_9000001220_08779cztM0_level2.evt | modeM0/AS1G07_010T01_9000001220_08779cztM0_level2_quad_clean.evt |
| Size (bytes) | 748,368,000 | 104,028,480 |
| Size | 713.7 MB | 99.2 MB |
| Events in quadrant A | 5,974,968 | 614,667 |
| Events in quadrant B | 4,594,060 | 639,088 |
| Events in quadrant C | 4,360,787 | 631,516 |
| Events in quadrant D | 7,076,690 | 590,925 |
| Mode SS | |||
|---|---|---|---|
| Quadrant | BADHDUFLAG | Total packets | Discarded packets |
| A | 0 | 196 | 2 |
| B | 0 | 196 | 2 |
| C | 0 | 196 | 0 |
| D | 0 | 196 | 0 |
| Mode M0 | |||
|---|---|---|---|
| Quadrant | BADHDUFLAG | Total packets | Discarded packets |
| A | 0 | 24272 | 147 |
| B | 0 | 20275 | 77 |
| C | 0 | 19973 | 88 |
| D | 0 | 28066 | 132 |
| Mode M9 | |||
|---|---|---|---|
| Quadrant | BADHDUFLAG | Total packets | Discarded packets |
| A | 0 | 5 | 0 |
| B | 0 | 5 | 0 |
| C | 0 | 5 | 0 |
| D | 0 | 5 | 0 |
| Quadrant | Total seconds | Saturated seconds | Saturation percentage |
|---|---|---|---|
| A | 9720 | 372 | 3.827160% |
| B | 9724 | 118 | 1.213492% |
| C | 9725 | 60 | 0.616967% |
| D | 9717 | 391 | 4.023876% |
Noise dominated data is calculated using 1-second bins in cleaned event files. If a bin has >2000 counts, and if more than 50% of those come from <1% of pixels, then it is considered to be noise-dominated and hence unusable.
| Quadrant | # 1 sec bins | Bins with >0 counts | Bins with >2000 counts | High rate bins dominated by noise | Noise dominated (total time) | Noise dominated (detector-on time) | Marked lightcurve |
|---|---|---|---|---|---|---|---|
| A | 10277 | 9755 | 237 | 237 | 2.31% | 2.43% |  |
| B | 10277 | 9761 | 22 | 22 | 0.21% | 0.23% |  |
| C | 10277 | 9761 | 9 | 9 | 0.09% | 0.09% | 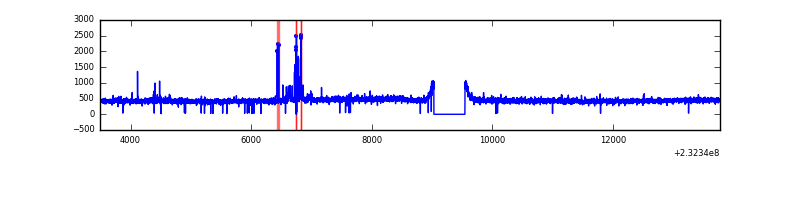 |
| D | 10277 | 9760 | 299 | 299 | 2.91% | 3.06% | 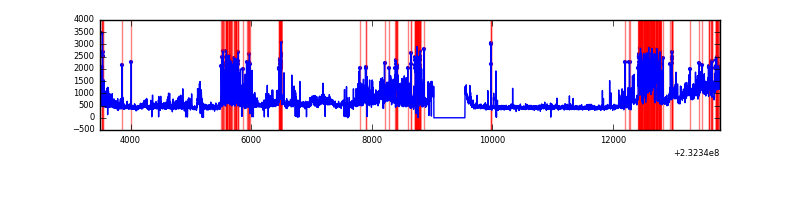 |
Top three noisy pixels from each quadrant. If the there are fewer than three noisy pixels in the level2.evt file, extra rows are filled as -1
| Pixel properties | Quadrant properties | ||||||
|---|---|---|---|---|---|---|---|
| Quadrant | DetID | PixID | Counts | Sigma | Mean | Median | Sigma |
| A | 8 | 5 | 1456570 | 6418.66 | 1111 | 1084 | 226.8 |
| A | 13 | 251 | 122609 | 535.92 | 1111 | 1084 | 226.8 |
| A | 15 | 223 | 76168 | 331.12 | 1111 | 1084 | 226.8 |
| B | 10 | 16 | 166238 | 755.07 | 1124 | 1094 | 218.7 |
| B | 4 | 173 | 47035 | 210.05 | 1124 | 1094 | 218.7 |
| B | 12 | 111 | 25065 | 109.6 | 1124 | 1094 | 218.7 |
| C | 9 | 68 | 94046 | 365.99 | 1092 | 1097 | 254.0 |
| C | 13 | 61 | 8293 | 28.33 | 1092 | 1097 | 254.0 |
| C | 8 | 222 | 4699 | 14.18 | 1092 | 1097 | 254.0 |
| D | 2 | 16 | 2455445 | 9134.5 | 1071 | 1043 | 268.7 |
| D | 2 | 152 | 325574 | 1207.8 | 1071 | 1043 | 268.7 |
| D | 7 | 71 | 87459 | 321.61 | 1071 | 1043 | 268.7 |
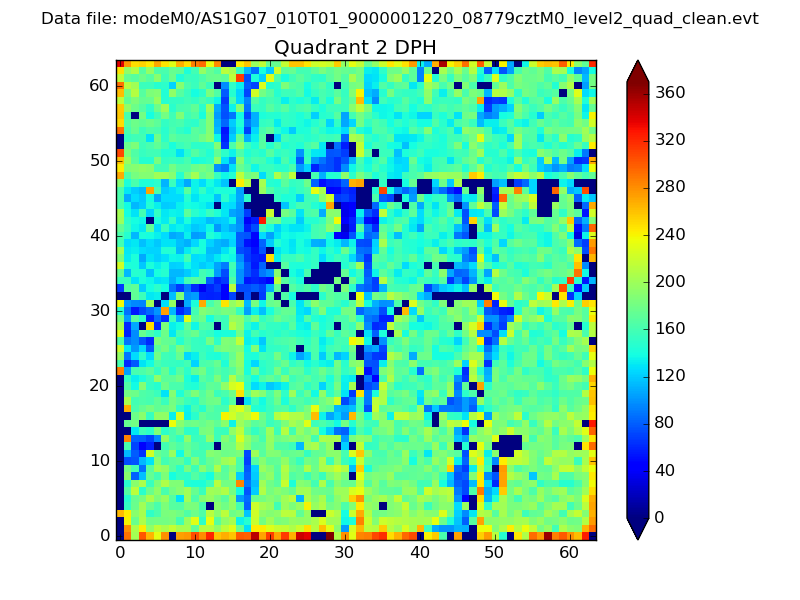
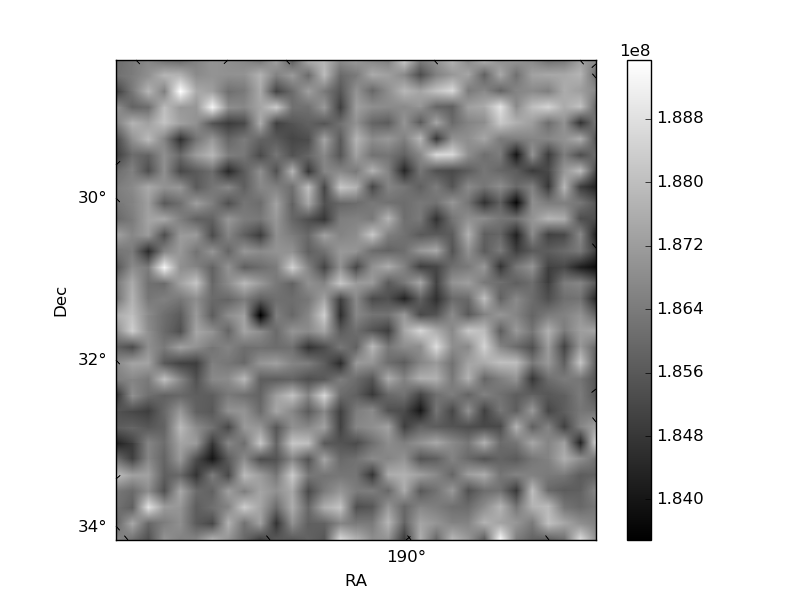
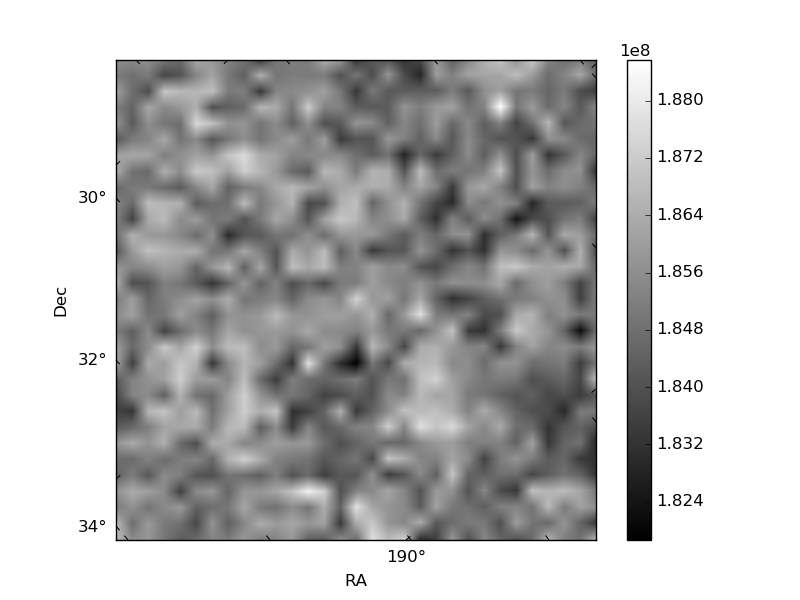
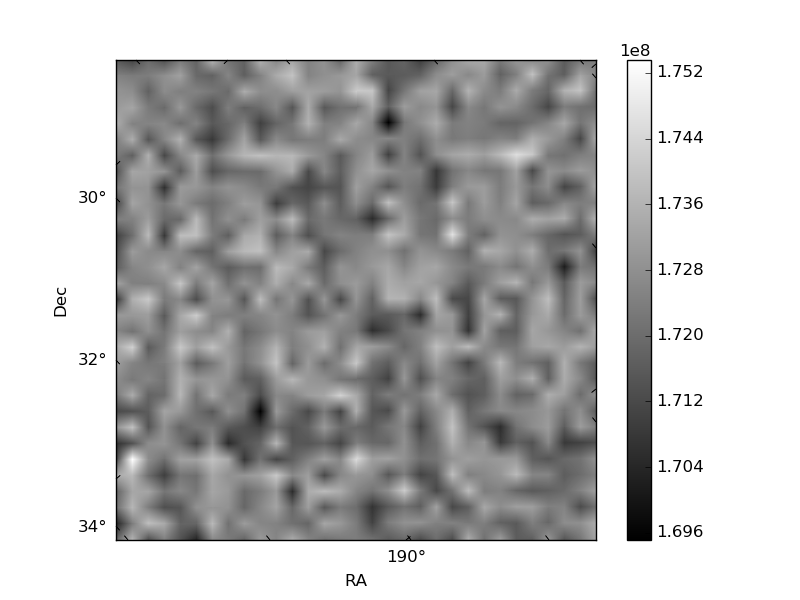
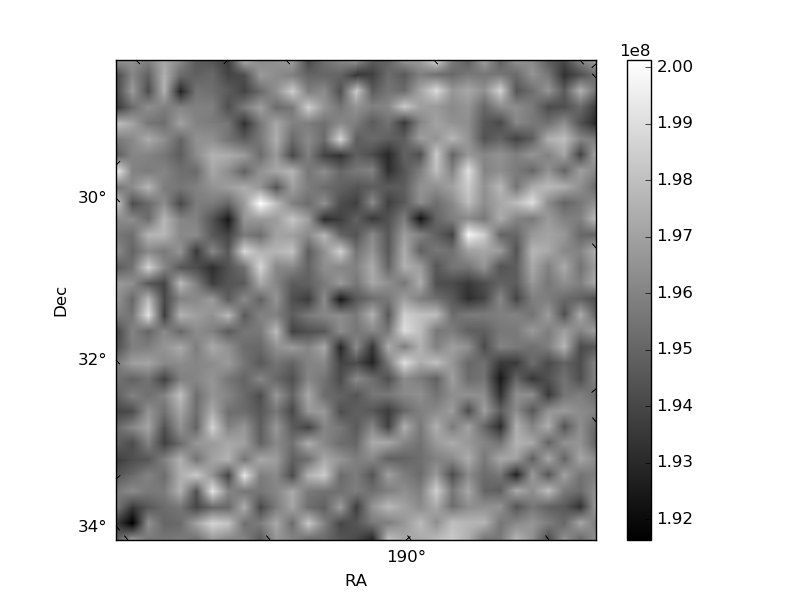
Histogram calculated using DETX and DETY for each event in the final _common_clean file
| Quadrant A | 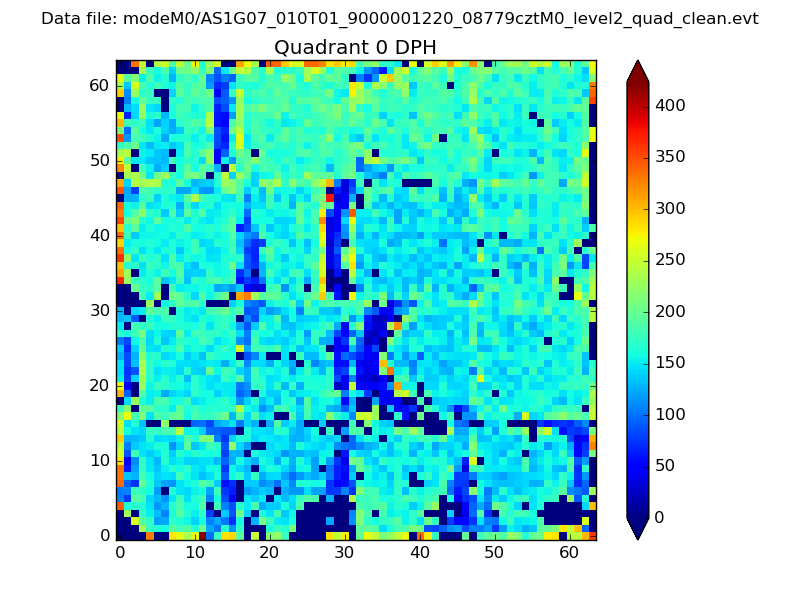 |
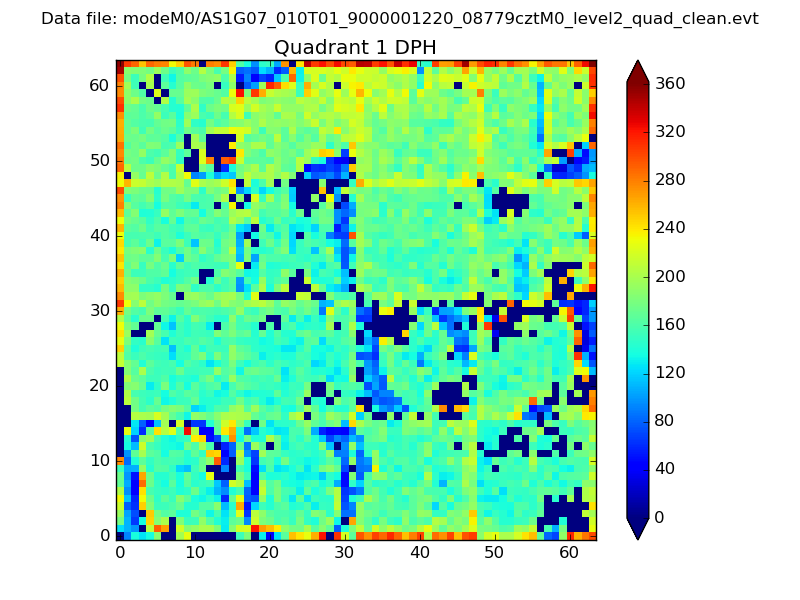 |
Quadrant B |
|---|---|---|---|
| Quadrant D | 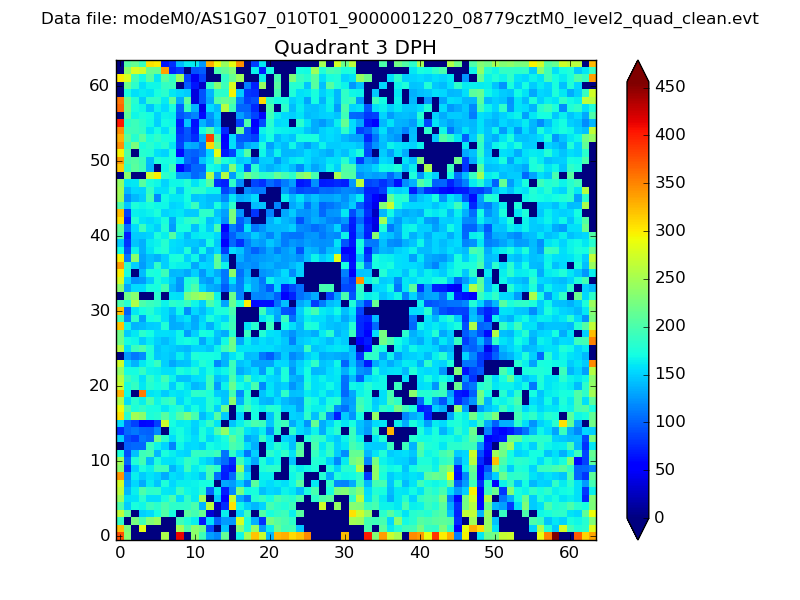 |
 |
Quadrant C |
| Plot type | Count rate plots | Images |
|---|---|---|
| Comparison with Poisson distribution Blue bars denote a histogram of data divided into 1 sec bins. Red curve is a Poisson curve with rate = median count rate of data. |
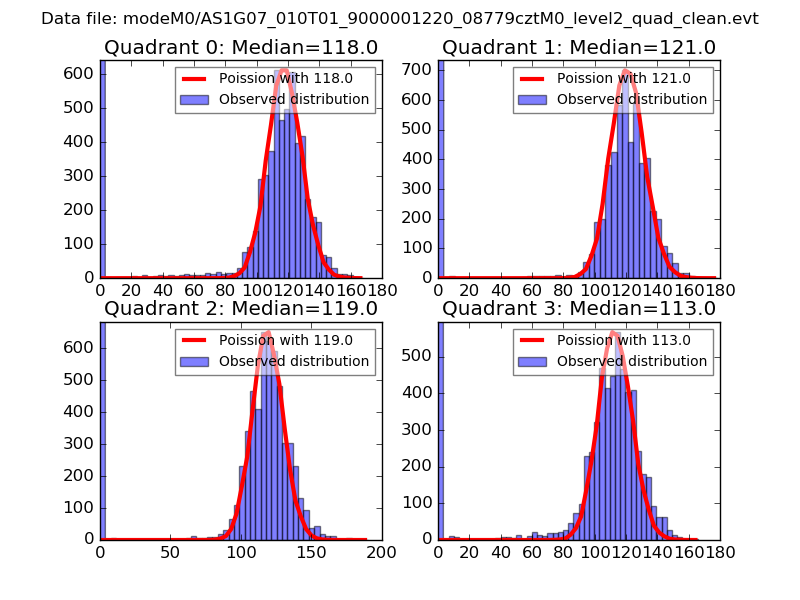 |
 |
| Quadrant-wise count rates Data is divided into 100 sec bins |
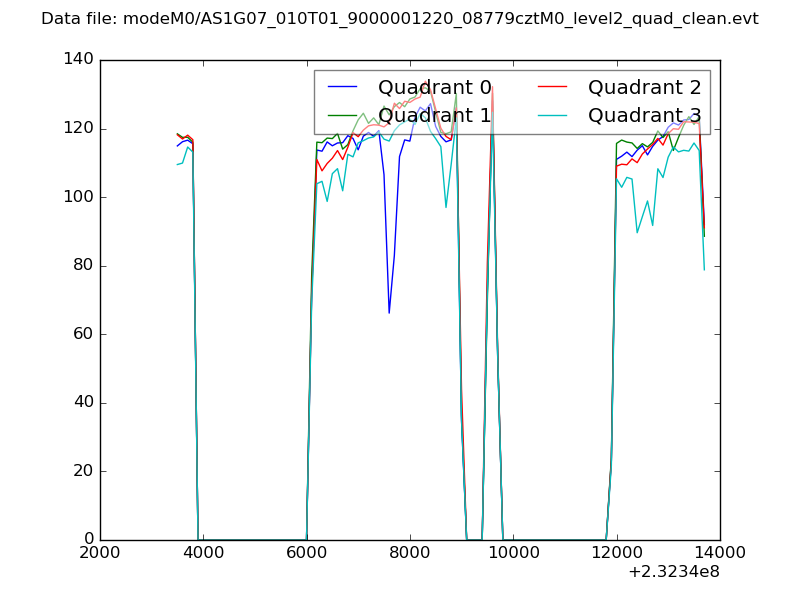 |
|
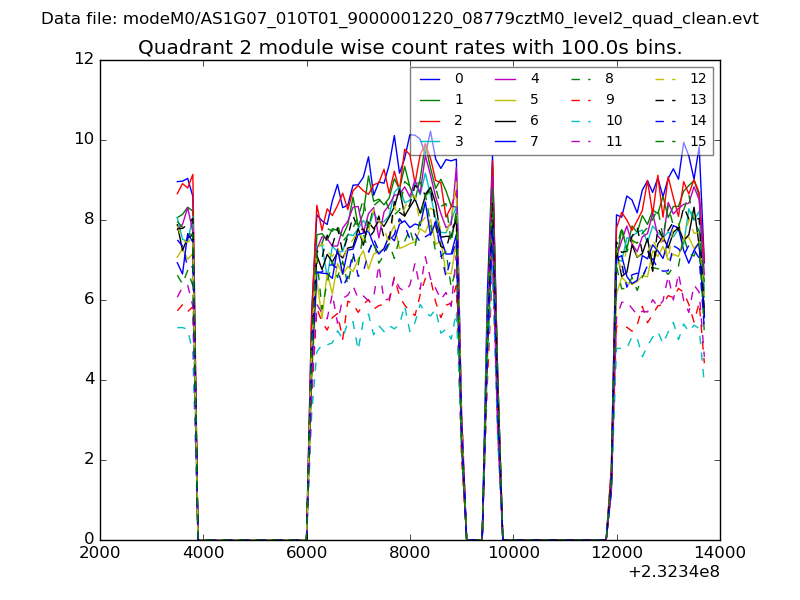
| Module-wise count rates for Quadrant A Data is divided into 100 sec bins |
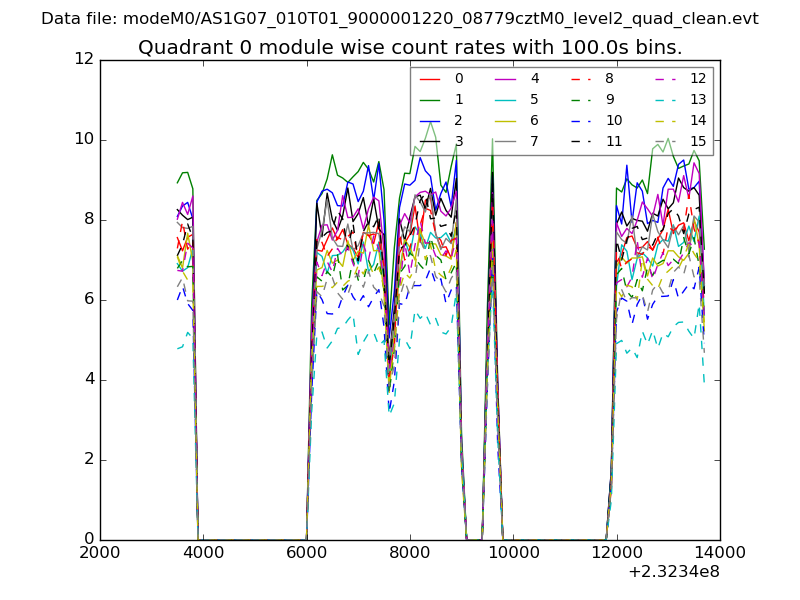 |
 |
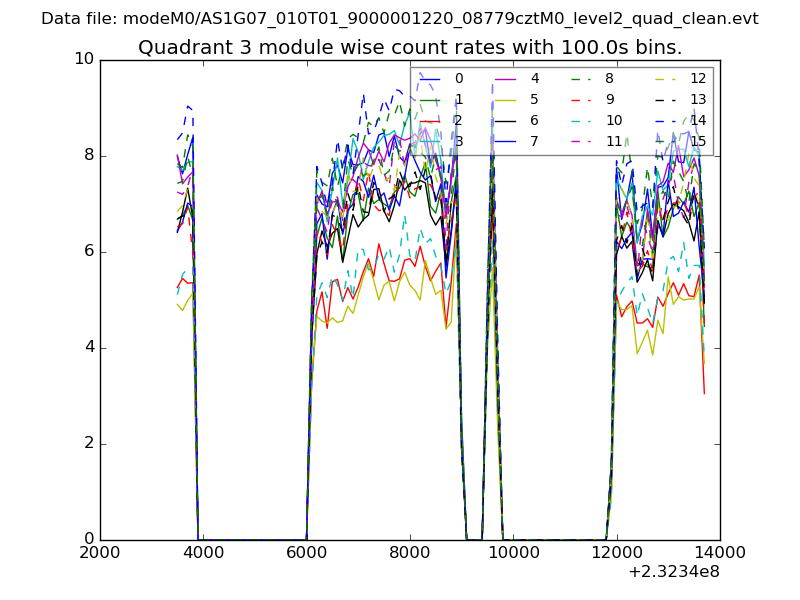
| Module-wise count rates for Quadrant B Data is divided into 100 sec bins |
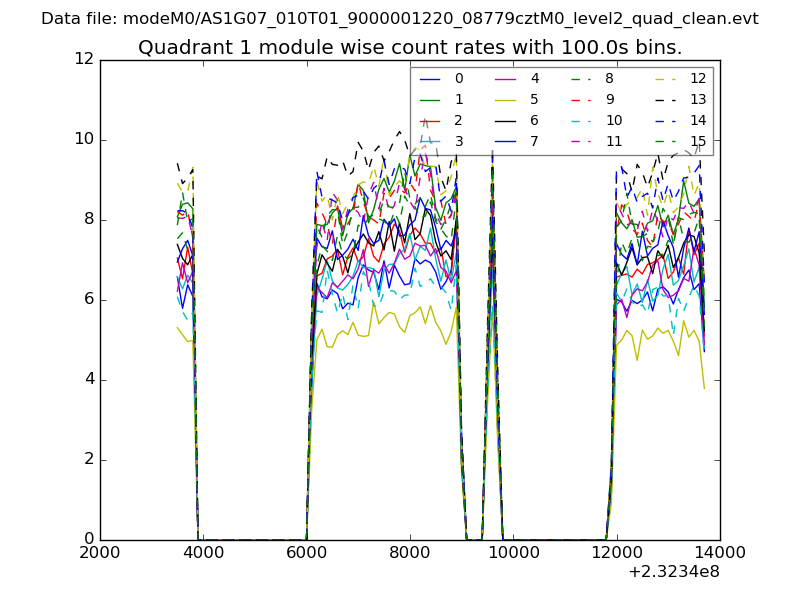 |
 |
| Module-wise count rates for Quadrant C Data is divided into 100 sec bins |
 |
 |
| Module-wise count rates for Quadrant D Data is divided into 100 sec bins |
 |
 |
| Parameter | Plot |
|---|---|
| CZT HV Monitor |  |
| D_VDD | 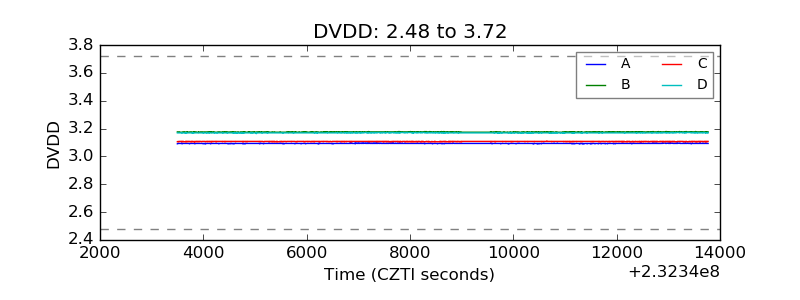 |
| Temperature 1 | 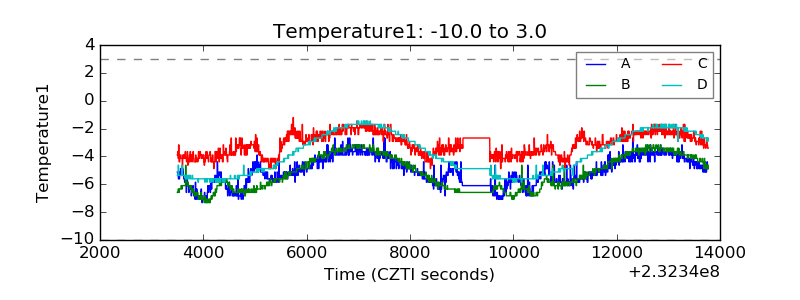 |
| Veto HV Monitor | 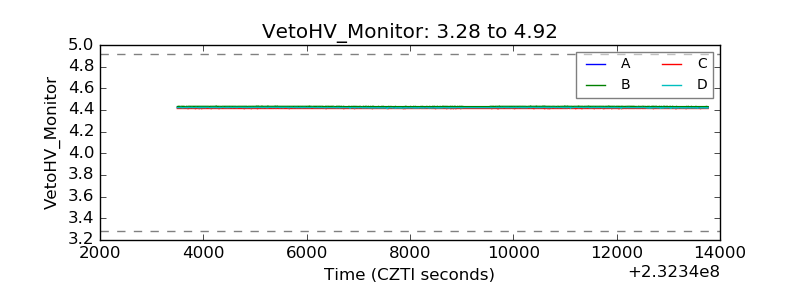 |
| Veto LLD | 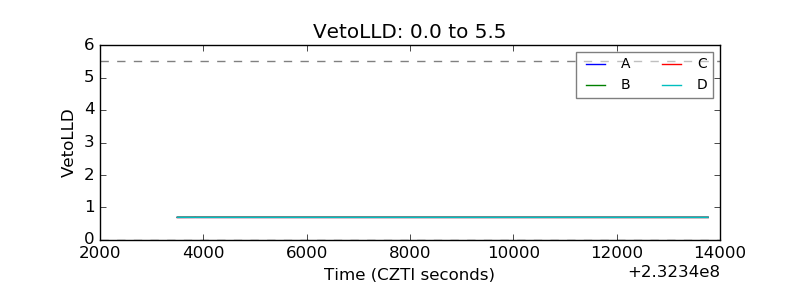 |
| Alpha Counter | 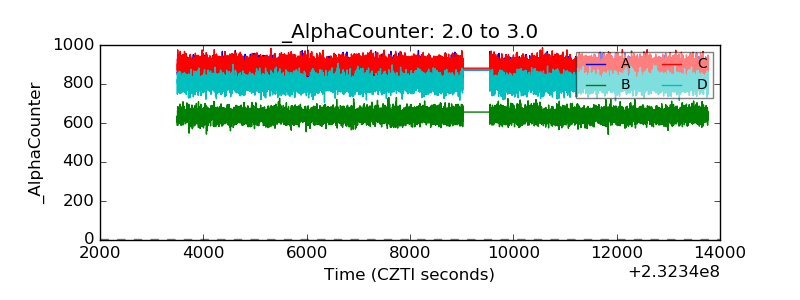 |
| _CPM_Rate | 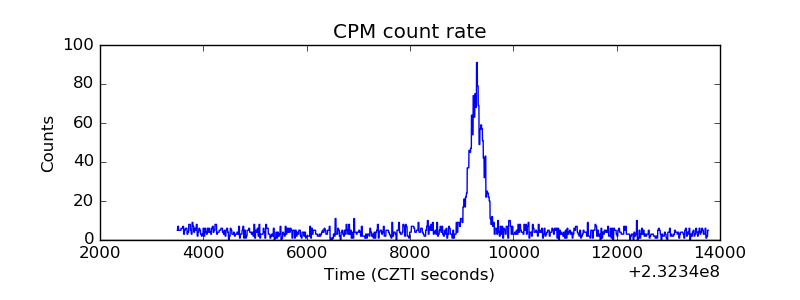 |
| CZT Counter | 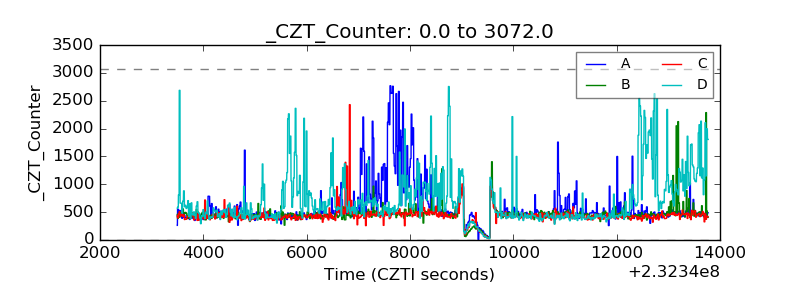 |
| +2.5 Volts monitor |  |
| +5 Volts monitor |  |
| _ROLL_ROT | 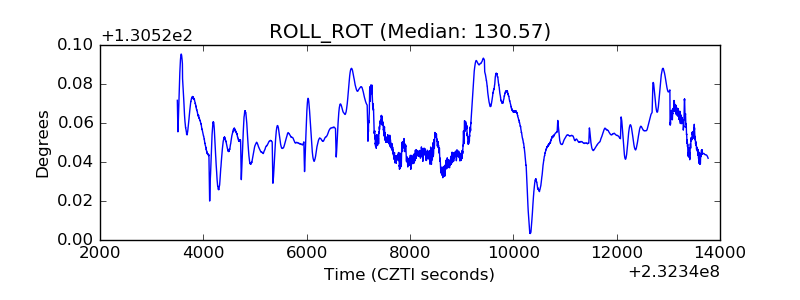 |
| _Roll_DEC | 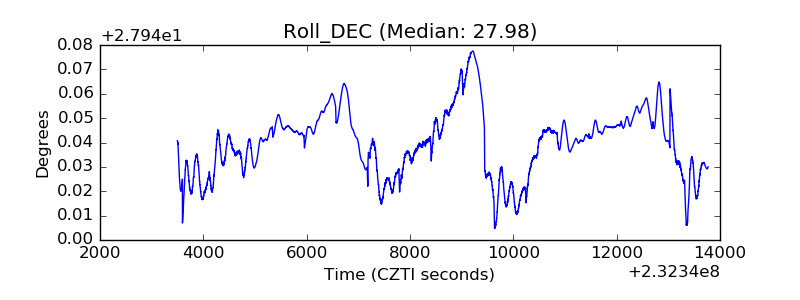 |
| _Roll_RA | 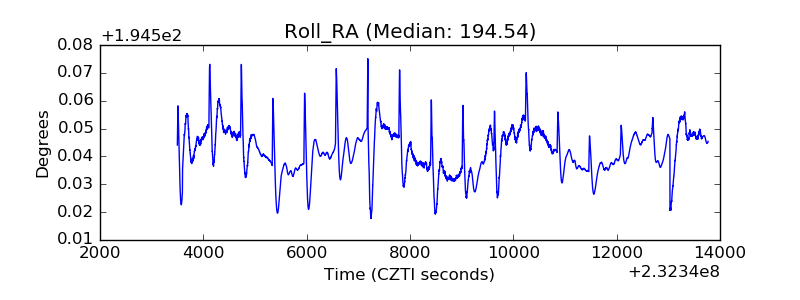 |
| Veto Counter |  |