| Param | Original file | Final file |
|---|---|---|
| Filename | modeM0/AS1G07_010T02_9000001222cztM0_level2.fits | modeM0/AS1G07_010T02_9000001222cztM0_level2_quad_clean.evt |
| Size (bytes) | 366,448,320 | 295,096,320 |
| Size | 349.5 MB | 281.4 MB |
| Events in quadrant A | 2,241,184 | 1,672,112 |
| Events in quadrant B | 2,181,662 | 1,679,961 |
| Events in quadrant C | 2,239,784 | 1,619,062 |
| Events in quadrant D | 1,864,284 | 1,395,304 |
| Mode M0 | |||
|---|---|---|---|
| Quadrant | BADHDUFLAG | Total packets | Discarded packets |
| A | 0 | 88747 | 0 |
| B | 0 | 79719 | 0 |
| C | 0 | 78217 | 0 |
| D | 0 | 111525 | 0 |
| Mode SS | |||
|---|---|---|---|
| Quadrant | BADHDUFLAG | Total packets | Discarded packets |
| A | 0 | 762 | 0 |
| B | 0 | 764 | 0 |
| C | 0 | 774 | 0 |
| D | 0 | 759 | 0 |
| Mode M9 | |||
|---|---|---|---|
| Quadrant | BADHDUFLAG | Total packets | Discarded packets |
| A | 0 | 87 | 0 |
| B | 0 | 88 | 0 |
| C | 0 | 87 | 0 |
| D | 0 | 86 | 0 |
| Quadrant | Total seconds | Saturated seconds | Saturation percentage |
|---|---|---|---|
| A | 37435 | 990 | 2.644584% |
| B | 37511 | 628 | 1.674176% |
| C | 37512 | 438 | 1.167626% |
| D | 37151 | 2522 | 6.788512% |
Noise dominated data is calculated using 1-second bins in cleaned event files. If a bin has >2000 counts, and if more than 50% of those come from <1% of pixels, then it is considered to be noise-dominated and hence unusable.
| Quadrant | # 1 sec bins | Bins with >0 counts | Bins with >2000 counts | High rate bins dominated by noise | Noise dominated (total time) | Noise dominated (detector-on time) | Marked lightcurve |
|---|---|---|---|---|---|---|---|
| A | 47134 | 37903 | 0 | 0 | 0.00% | 0.00% | 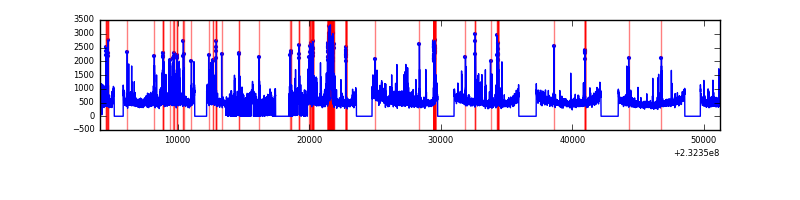 |
| B | 47134 | 37936 | 0 | 0 | 0.00% | 0.00% | 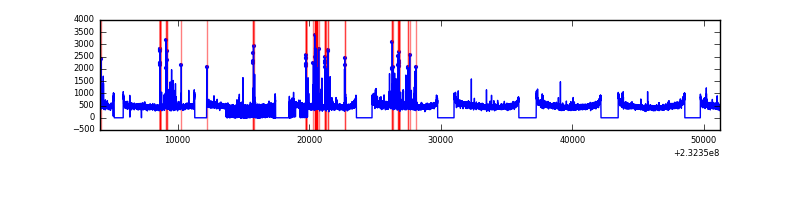 |
| C | 47134 | 37949 | 0 | 0 | 0.00% | 0.00% | 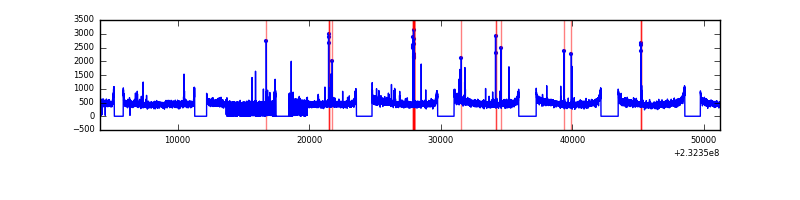 |
| D | 47133 | 37669 | 0 | 0 | 0.00% | 0.00% | 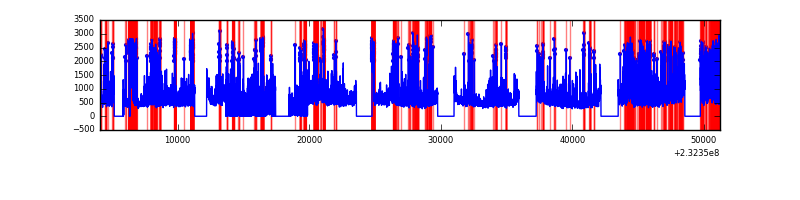 |
Top three noisy pixels from each quadrant. If the there are fewer than three noisy pixels in the level2.evt file, extra rows are filled as -1
| Pixel properties | Quadrant properties | ||||||
|---|---|---|---|---|---|---|---|
| Quadrant | DetID | PixID | Counts | Sigma | Mean | Median | Sigma |
| A | 0 | 29 | 2193 | 11.38 | 584 | 547 | 144.7 |
| A | 7 | 110 | 1789 | 8.59 | 584 | 547 | 144.7 |
| A | 0 | 30 | 1728 | 8.16 | 584 | 547 | 144.7 |
| B | 2 | 9 | 1936 | 12.2 | 574 | 546 | 114.0 |
| B | 5 | 128 | 1496 | 8.33 | 574 | 546 | 114.0 |
| B | 3 | 17 | 1480 | 8.19 | 574 | 546 | 114.0 |
| C | 1 | 80 | 1666 | 7.14 | 591 | 550 | 156.3 |
| C | 1 | 81 | 1640 | 6.98 | 591 | 550 | 156.3 |
| C | 1 | 65 | 1512 | 6.16 | 591 | 550 | 156.3 |
| D | 6 | 231 | 1407 | 6.5 | 531 | 483 | 142.1 |
| D | 1 | 19 | 1340 | 6.03 | 531 | 483 | 142.1 |
| D | 6 | 38 | 1298 | 5.74 | 531 | 483 | 142.1 |
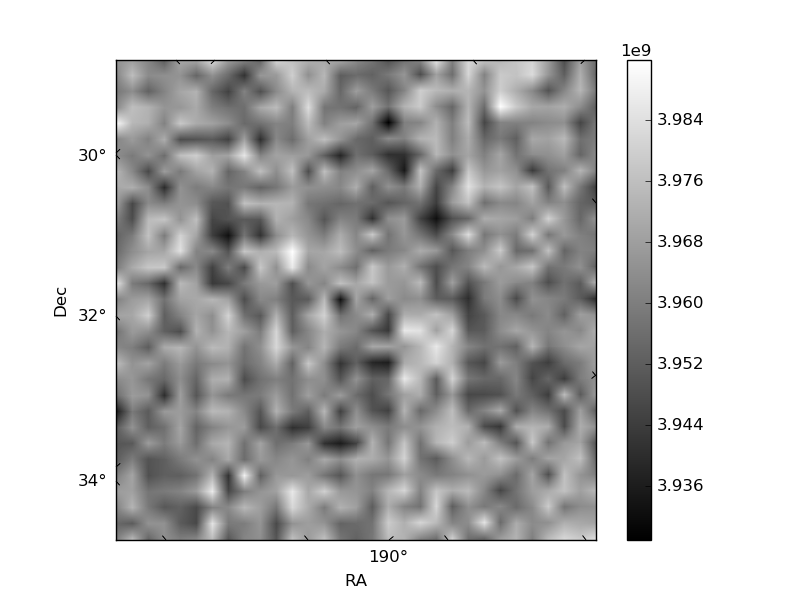
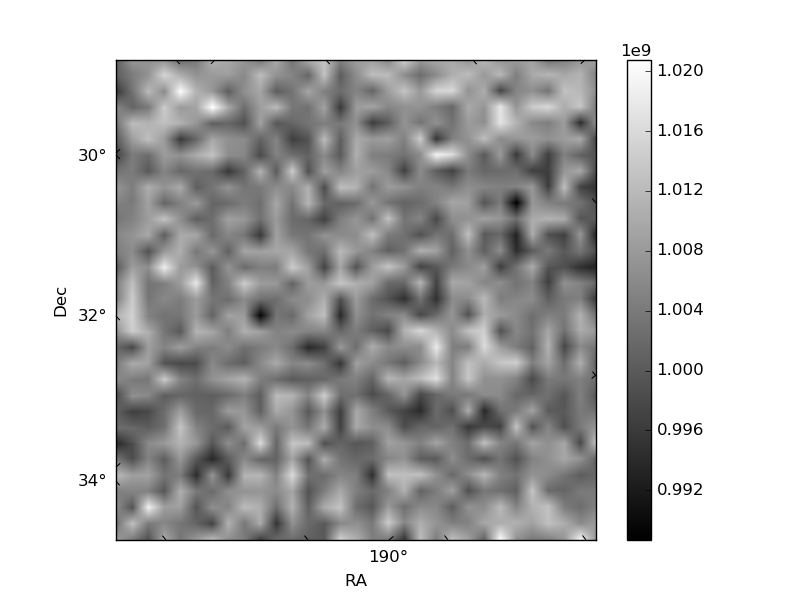
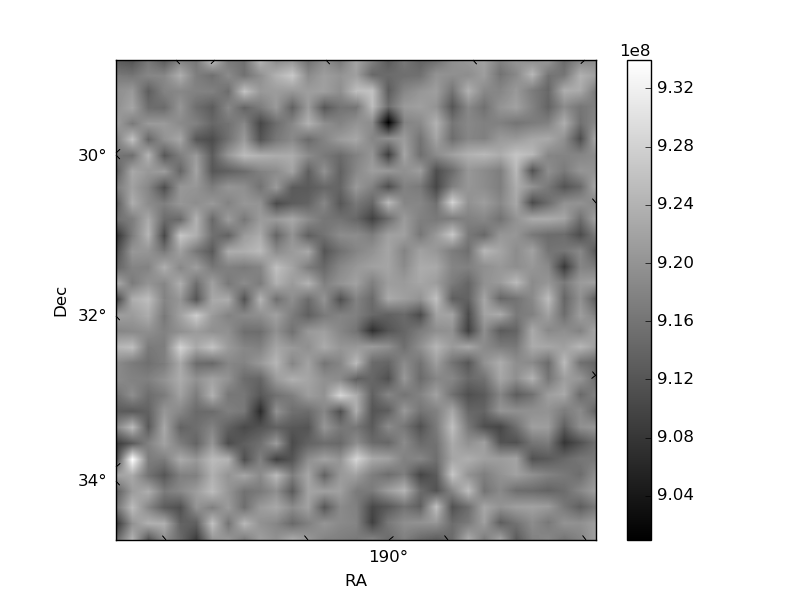
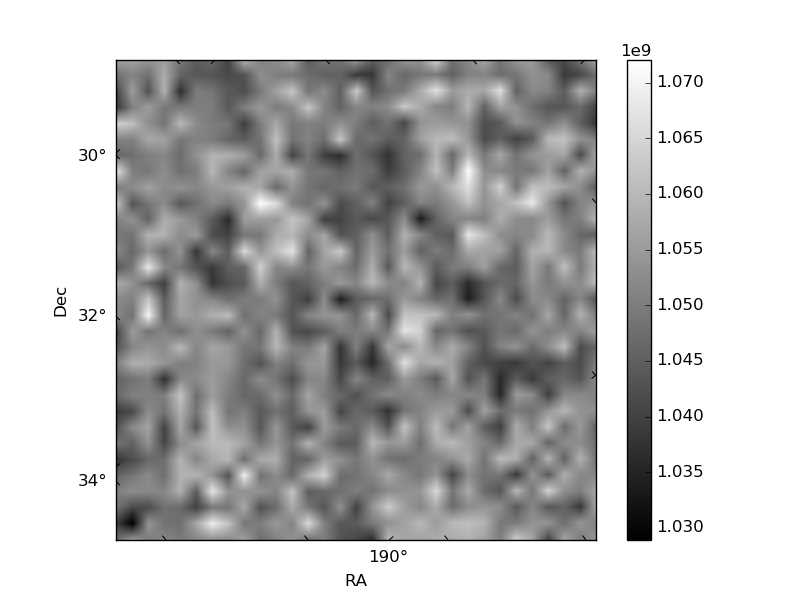
Histogram calculated using DETX and DETY for each event in the final _common_clean file
| Quadrant A | 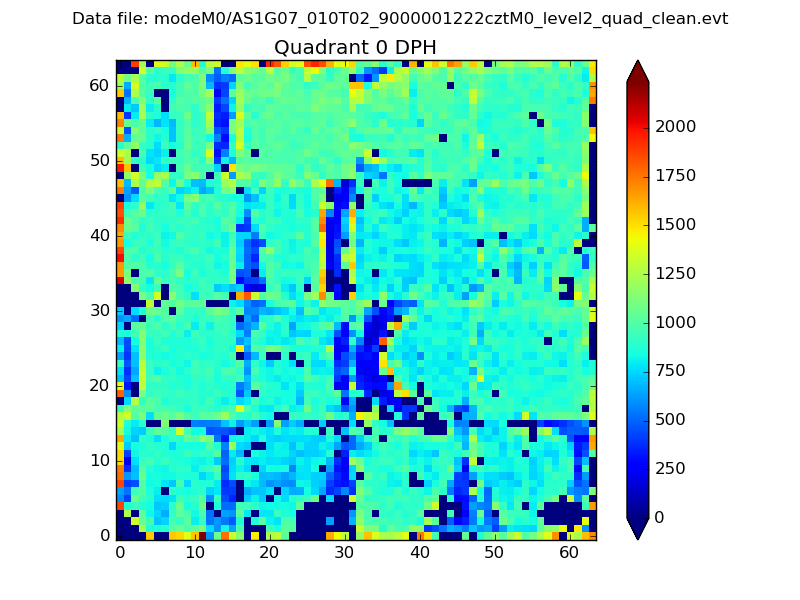 |
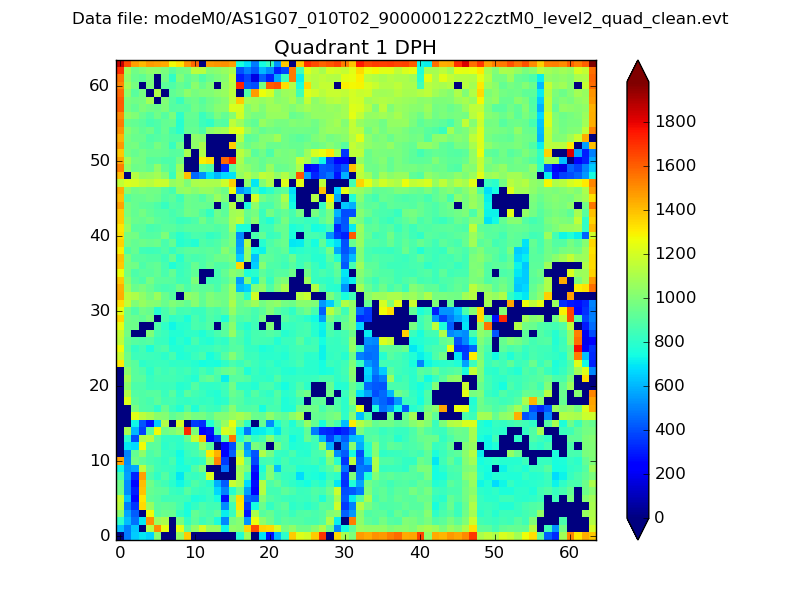 |
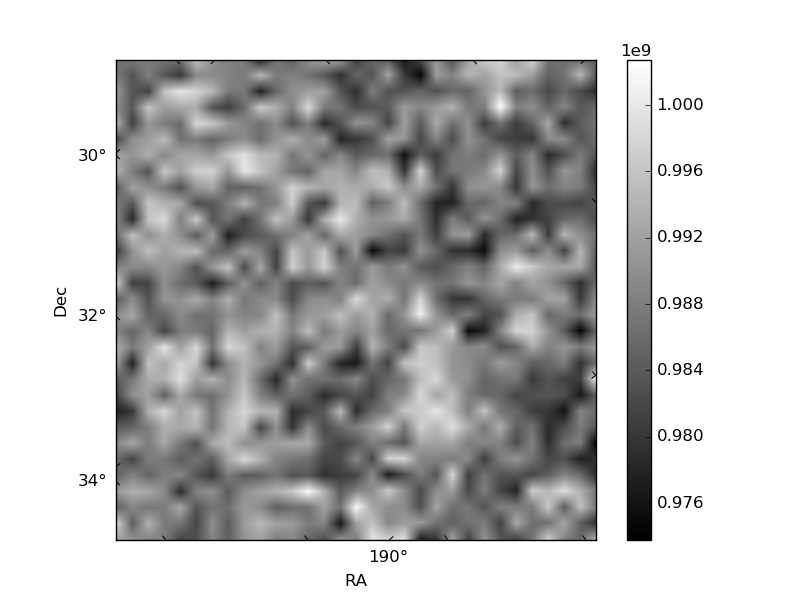
Quadrant B |
|---|---|---|---|
| Quadrant D | 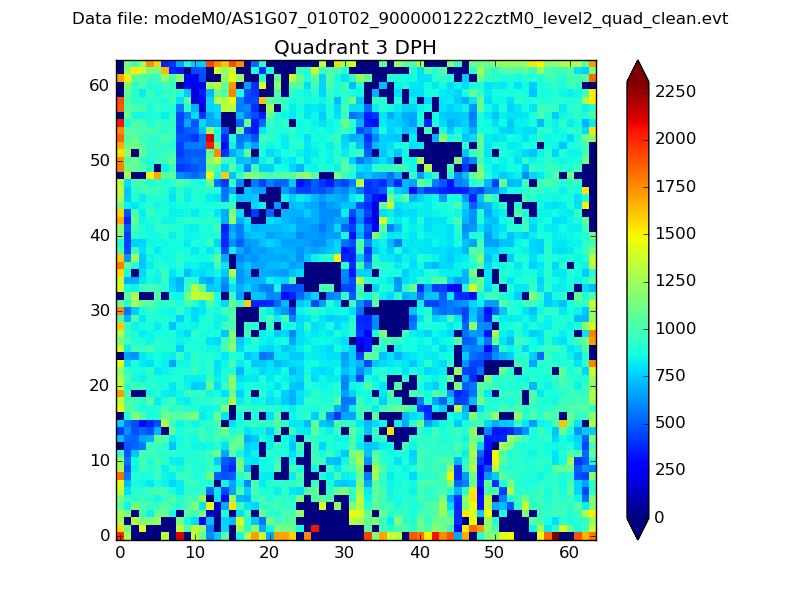 |
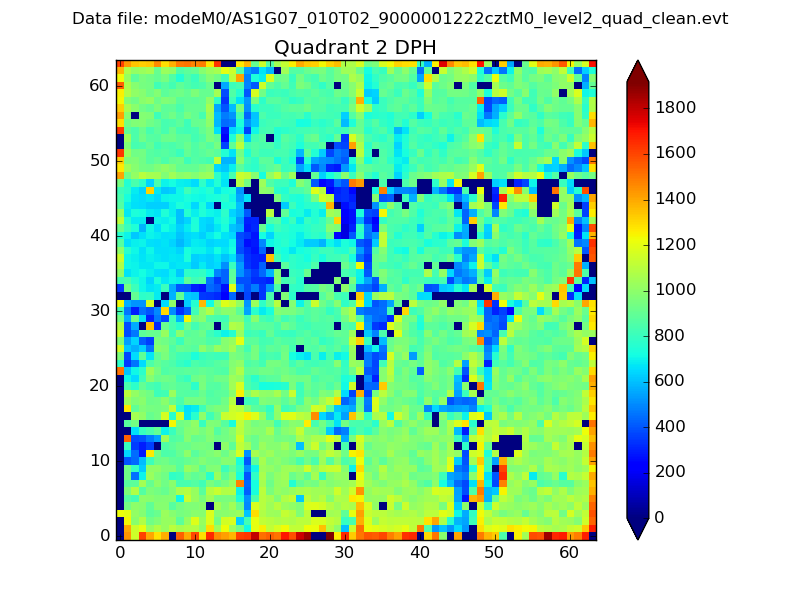 |
Quadrant C |
| Plot type | Count rate plots | Images |
|---|---|---|
| Comparison with Poisson distribution Blue bars denote a histogram of data divided into 1 sec bins. Red curve is a Poisson curve with rate = median count rate of data. |
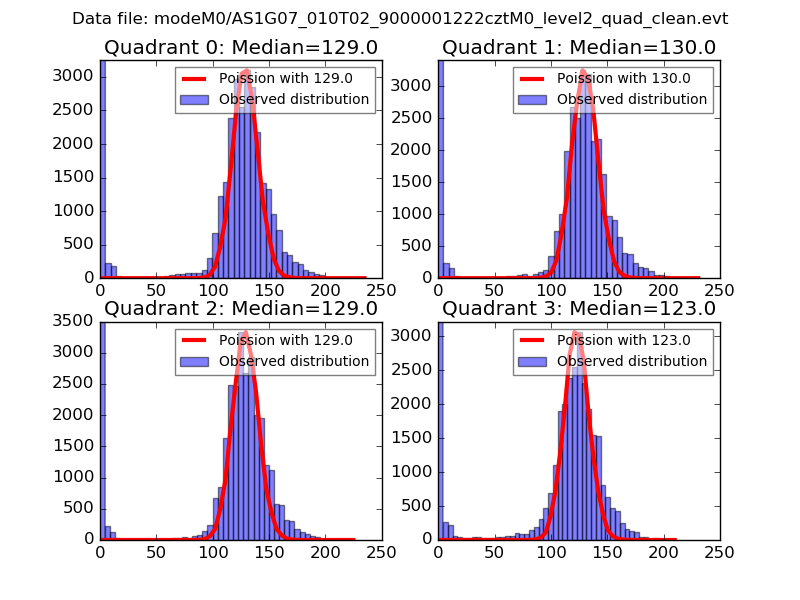 |
 |
| Quadrant-wise count rates Data is divided into 100 sec bins |
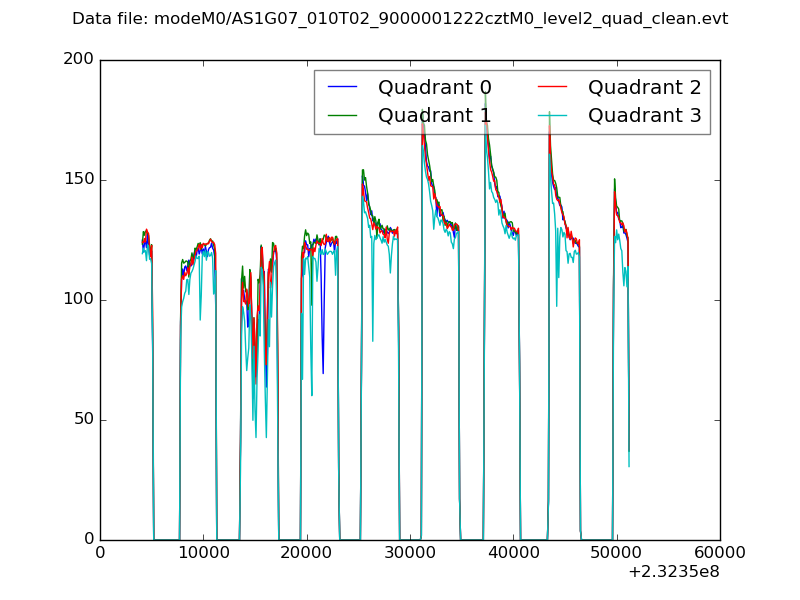 |
|
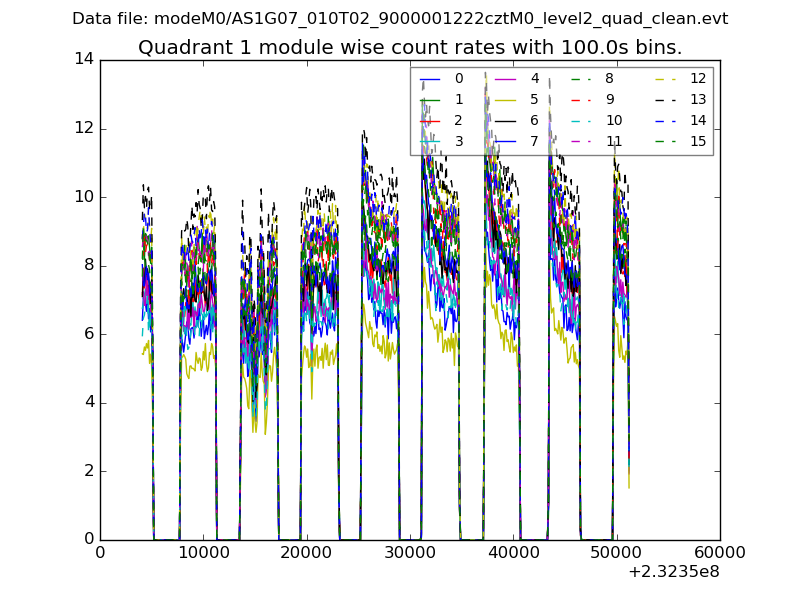
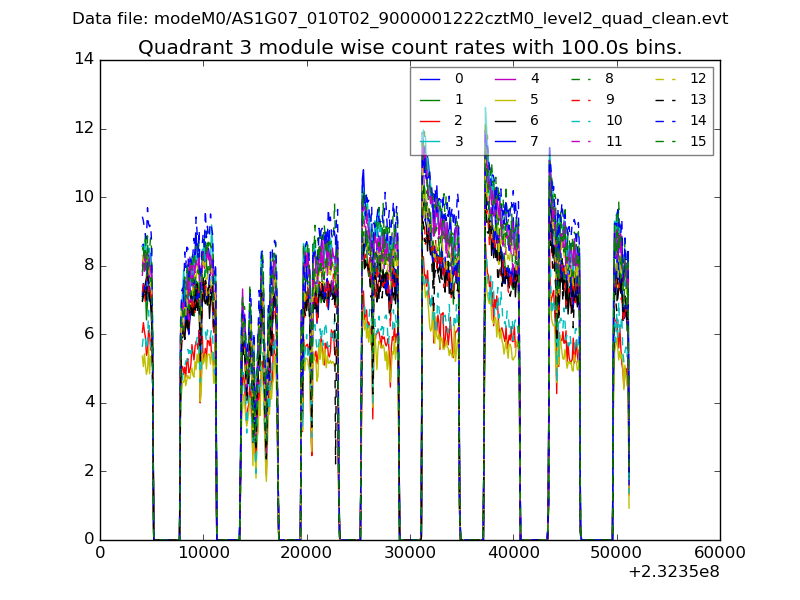
| Module-wise count rates for Quadrant A Data is divided into 100 sec bins |
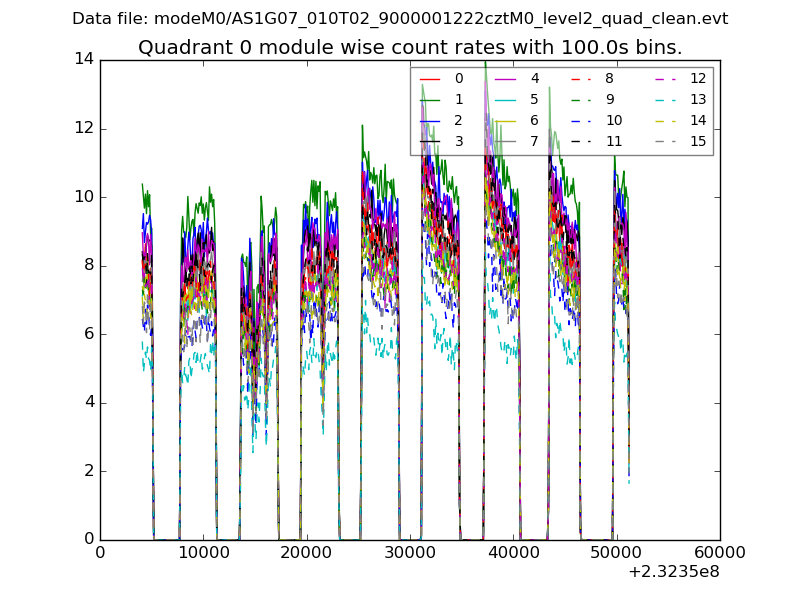 |
 |
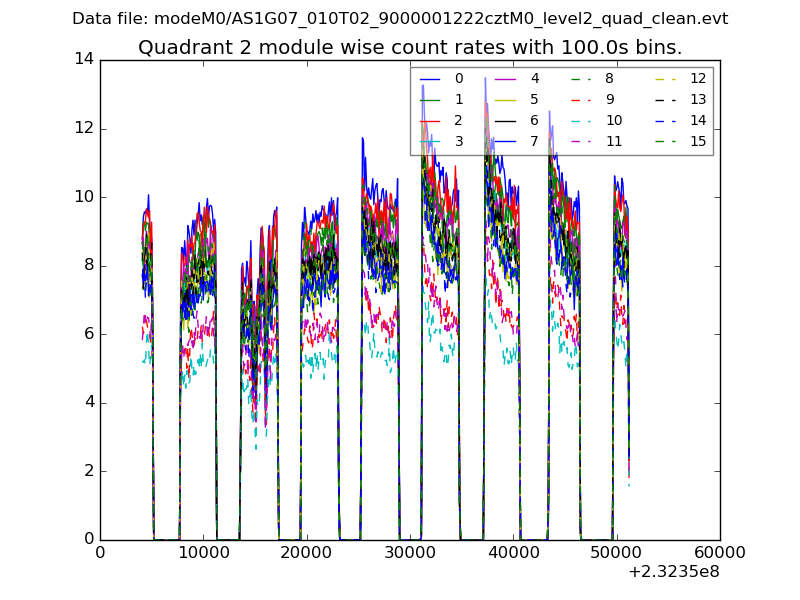
| Module-wise count rates for Quadrant B Data is divided into 100 sec bins |
 |
 |
| Module-wise count rates for Quadrant C Data is divided into 100 sec bins |
 |
 |
| Module-wise count rates for Quadrant D Data is divided into 100 sec bins |
 |
 |
| Parameter | Plot |
|---|---|
| CZT HV Monitor | 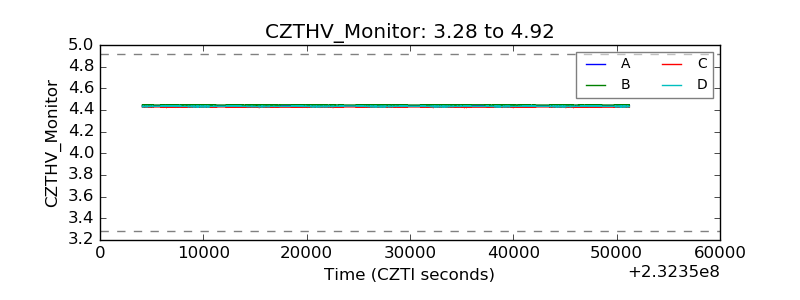 |
| D_VDD | 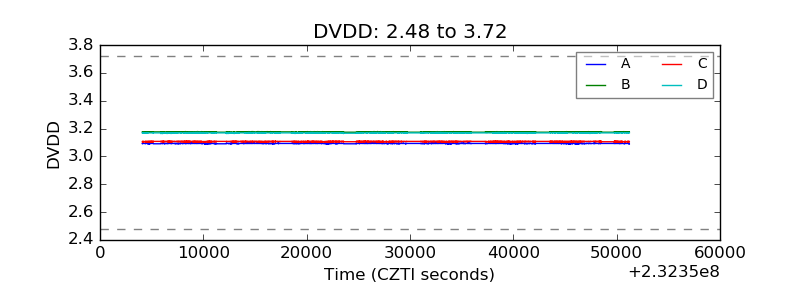 |
| Temperature 1 | 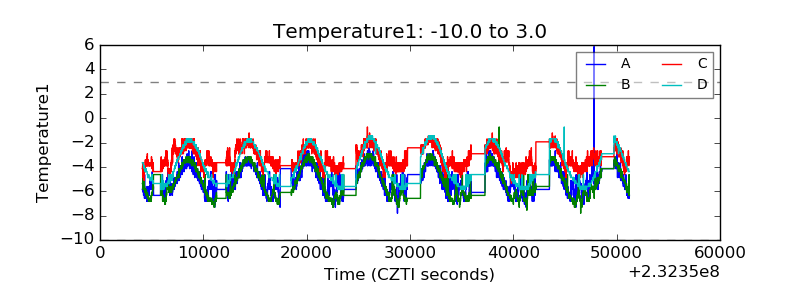 |
| Veto HV Monitor | 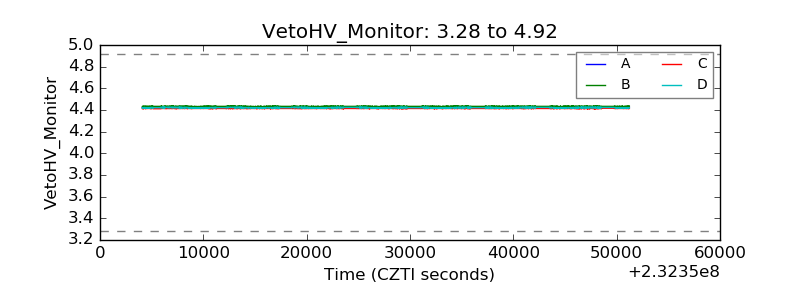 |
| Veto LLD | 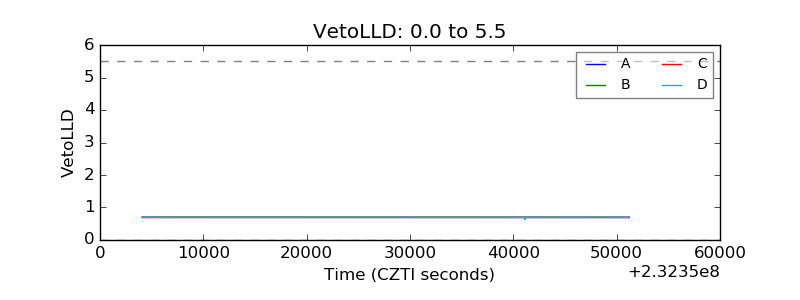 |
| Alpha Counter | 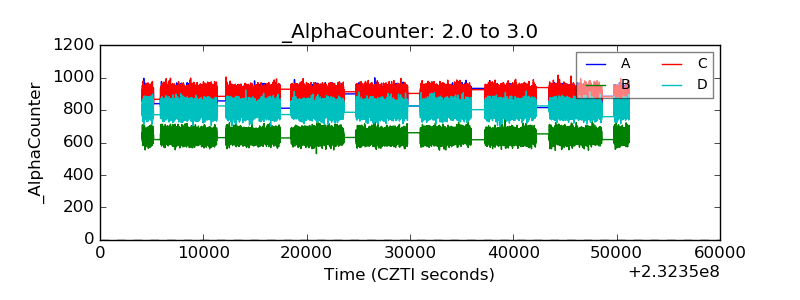 |
| _CPM_Rate | 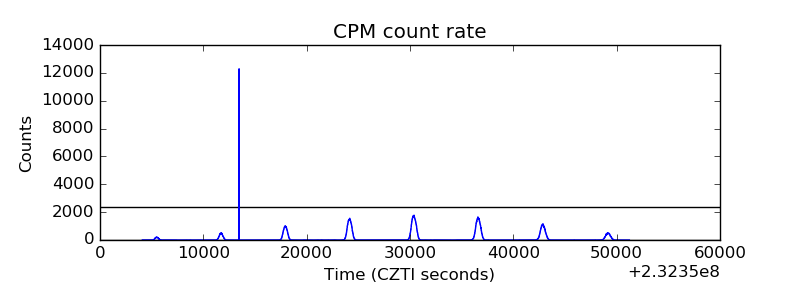 |
| CZT Counter | 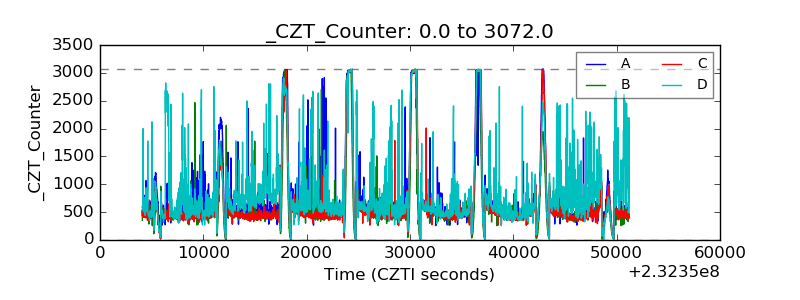 |
| +2.5 Volts monitor | 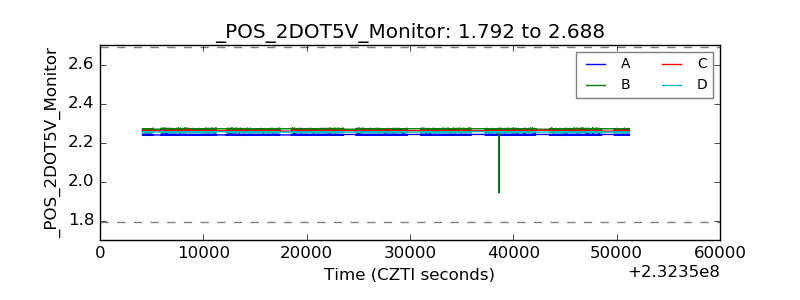 |
| +5 Volts monitor | 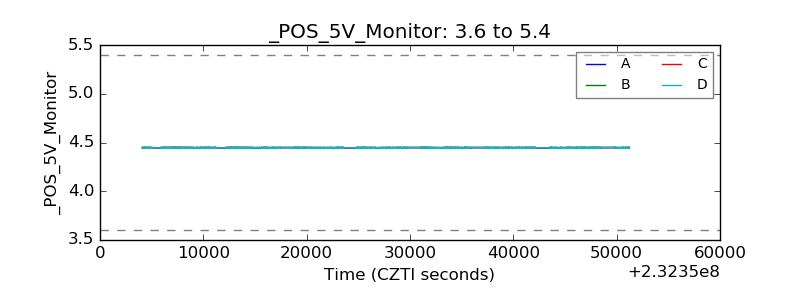 |
| _ROLL_ROT | 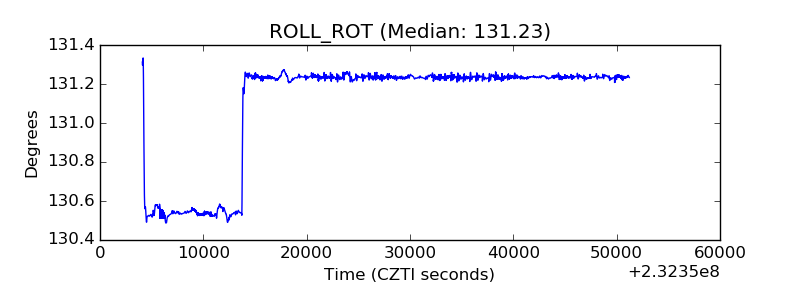 |
| _Roll_DEC | 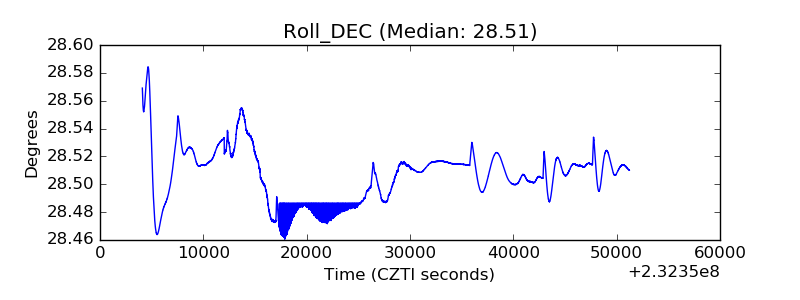 |
| _Roll_RA | 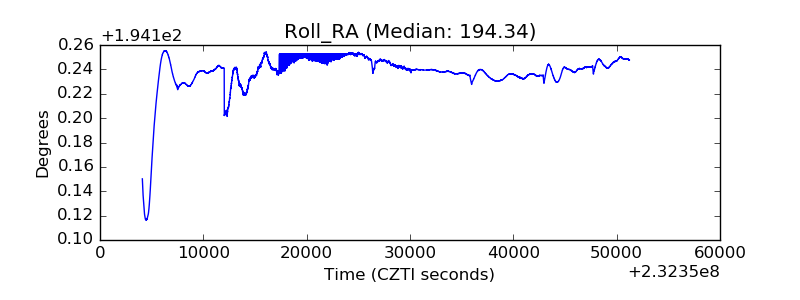 |
| Veto Counter | 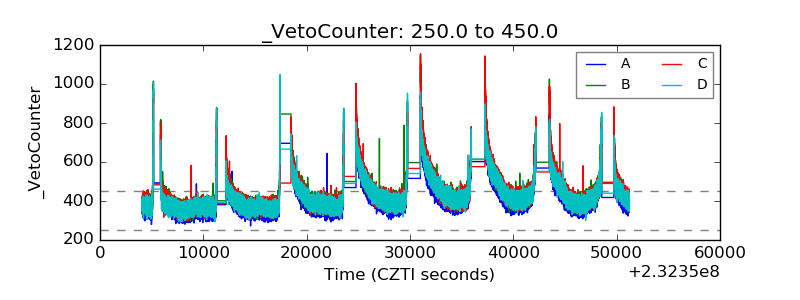 |