| Param | Original file | Final file |
|---|---|---|
| Filename | modeM0/AS1G07_010T02_9000001222_08779cztM0_level2.evt | modeM0/AS1G07_010T02_9000001222_08779cztM0_level2_quad_clean.evt |
| Size (bytes) | 204,713,280 | 23,304,960 |
| Size | 195.2 MB | 22.2 MB |
| Events in quadrant A | 1,364,119 | 130,525 |
| Events in quadrant B | 1,255,738 | 134,153 |
| Events in quadrant C | 1,191,838 | 134,449 |
| Events in quadrant D | 2,217,455 | 127,682 |
| Mode M0 | |||
|---|---|---|---|
| Quadrant | BADHDUFLAG | Total packets | Discarded packets |
| A | 0 | 5532 | 6 |
| B | 0 | 5247 | 9 |
| C | 0 | 5187 | 13 |
| D | 0 | 8237 | 24 |
| Mode SS | |||
|---|---|---|---|
| Quadrant | BADHDUFLAG | Total packets | Discarded packets |
| A | 0 | 50 | 0 |
| B | 0 | 50 | 0 |
| C | 0 | 50 | 0 |
| D | 0 | 50 | 0 |
| Mode M9 | |||
|---|---|---|---|
| Quadrant | BADHDUFLAG | Total packets | Discarded packets |
| A | 0 | 7 | 1 |
| B | 0 | 7 | 0 |
| C | 0 | 7 | 0 |
| D | 0 | 7 | 0 |
| Quadrant | Total seconds | Saturated seconds | Saturation percentage |
|---|---|---|---|
| A | 2486 | 107 | 4.304103% |
| B | 2484 | 96 | 3.864734% |
| C | 2483 | 63 | 2.537253% |
| D | 2484 | 427 | 17.190016% |
Noise dominated data is calculated using 1-second bins in cleaned event files. If a bin has >2000 counts, and if more than 50% of those come from <1% of pixels, then it is considered to be noise-dominated and hence unusable.
| Quadrant | # 1 sec bins | Bins with >0 counts | Bins with >2000 counts | High rate bins dominated by noise | Noise dominated (total time) | Noise dominated (detector-on time) | Marked lightcurve |
|---|---|---|---|---|---|---|---|
| A | 3173 | 2488 | 9 | 9 | 0.28% | 0.36% | 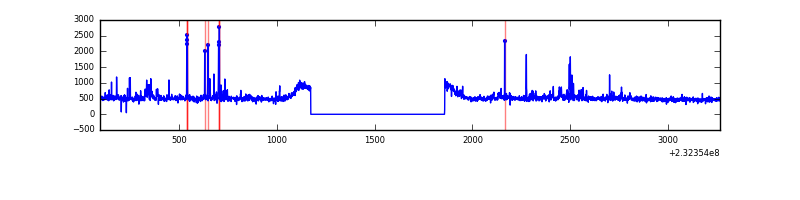 |
| B | 3173 | 2487 | 1 | 1 | 0.03% | 0.04% |  |
| C | 3173 | 2487 | 0 | 0 | 0.00% | 0.00% | 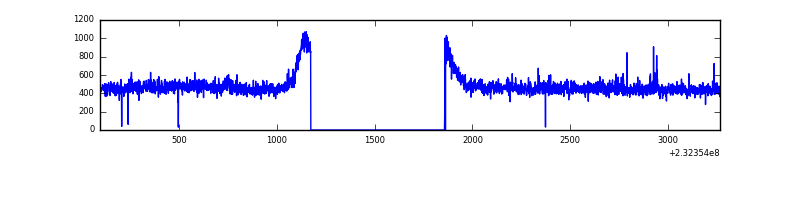 |
| D | 3173 | 2485 | 350 | 350 | 11.03% | 14.08% |  |
Top three noisy pixels from each quadrant. If the there are fewer than three noisy pixels in the level2.evt file, extra rows are filled as -1
| Pixel properties | Quadrant properties | ||||||
|---|---|---|---|---|---|---|---|
| Quadrant | DetID | PixID | Counts | Sigma | Mean | Median | Sigma |
| A | 8 | 5 | 115200 | 1731.03 | 311 | 303 | 66.4 |
| A | 15 | 223 | 22572 | 335.5 | 311 | 303 | 66.4 |
| A | 15 | 239 | 11000 | 161.16 | 311 | 303 | 66.4 |
| B | 10 | 16 | 20979 | 322.77 | 314 | 305 | 64.1 |
| B | 4 | 173 | 10461 | 158.56 | 314 | 305 | 64.1 |
| B | 12 | 111 | 7324 | 109.58 | 314 | 305 | 64.1 |
| C | 13 | 61 | 2286 | 26.85 | 304 | 305 | 73.8 |
| C | 9 | 68 | 2095 | 24.26 | 304 | 305 | 73.8 |
| C | 5 | 128 | 1178 | 11.83 | 304 | 305 | 73.8 |
| D | 2 | 16 | 1030539 | 14710.46 | 272 | 265 | 70.0 |
| D | 1 | 52 | 47048 | 667.98 | 272 | 265 | 70.0 |
| D | 2 | 14 | 45656 | 648.1 | 272 | 265 | 70.0 |
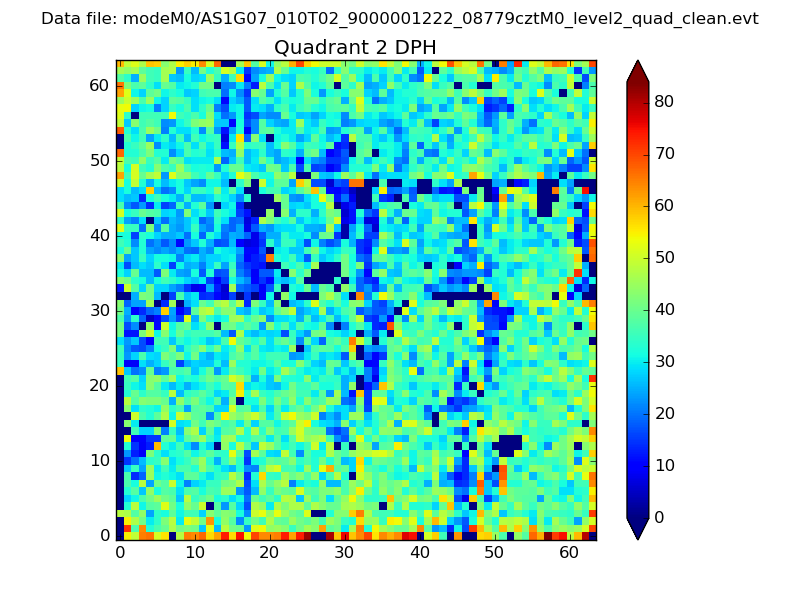
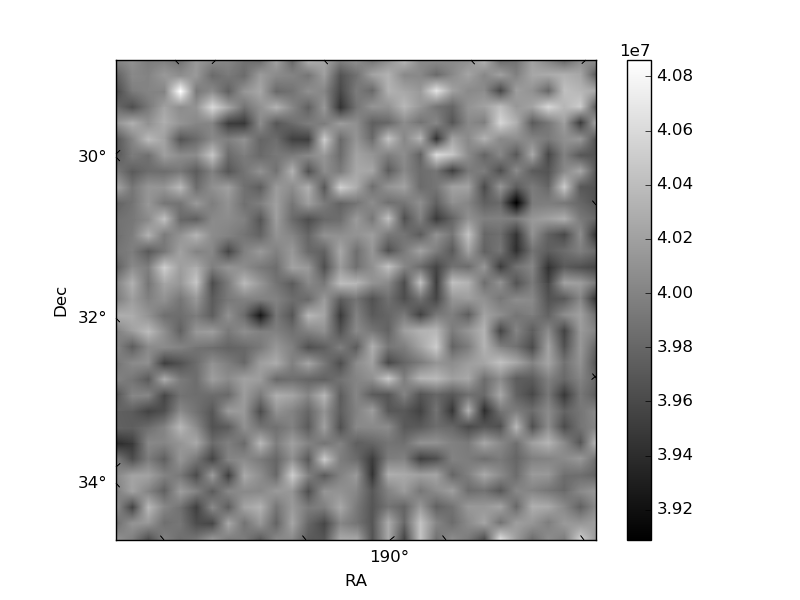
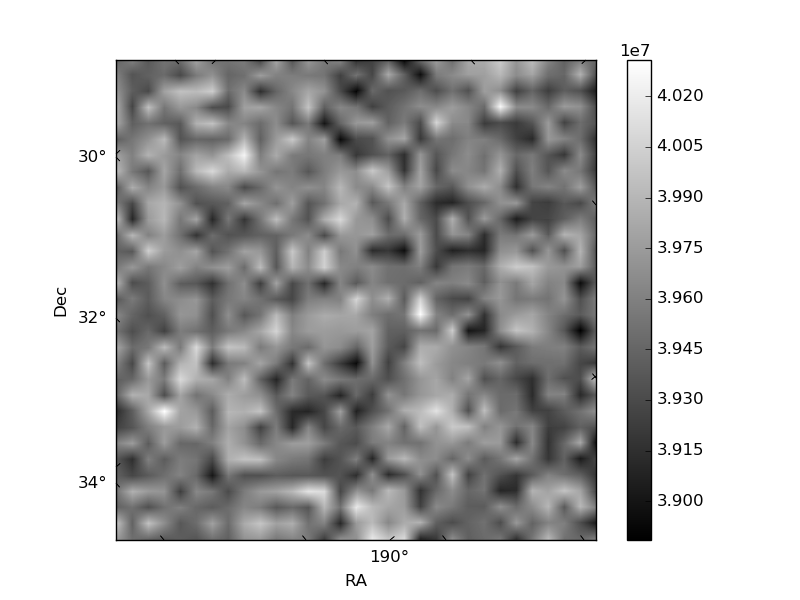
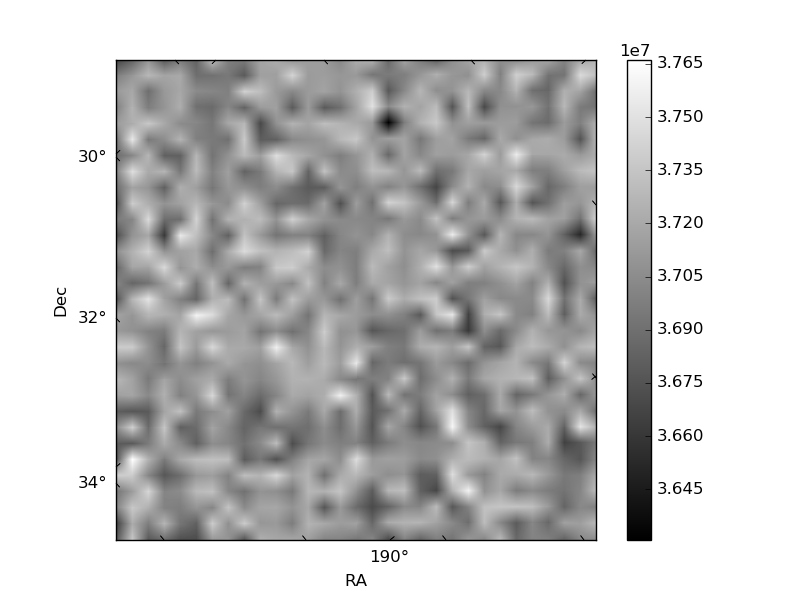
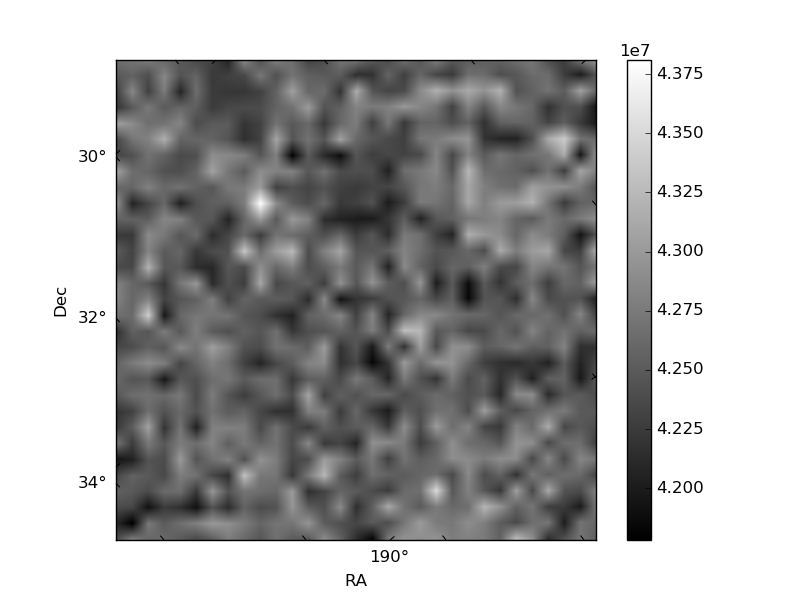
Histogram calculated using DETX and DETY for each event in the final _common_clean file
| Quadrant A | 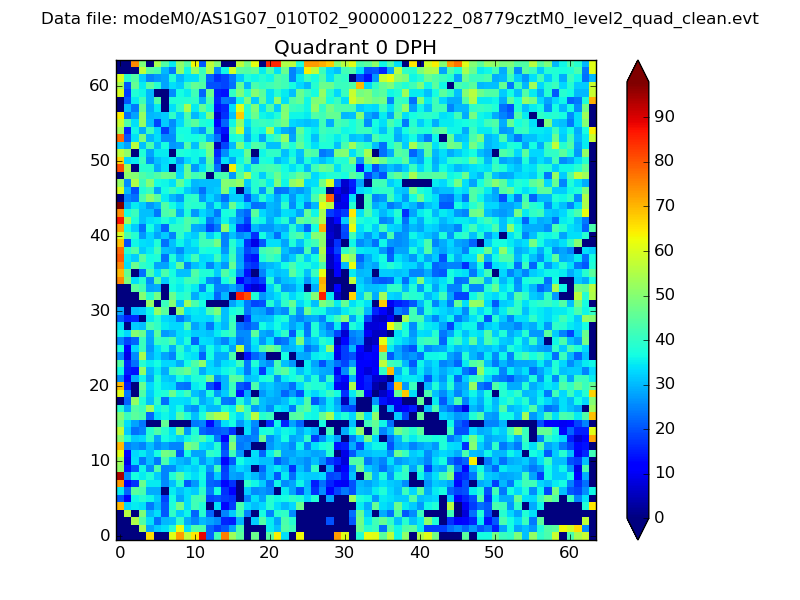 |
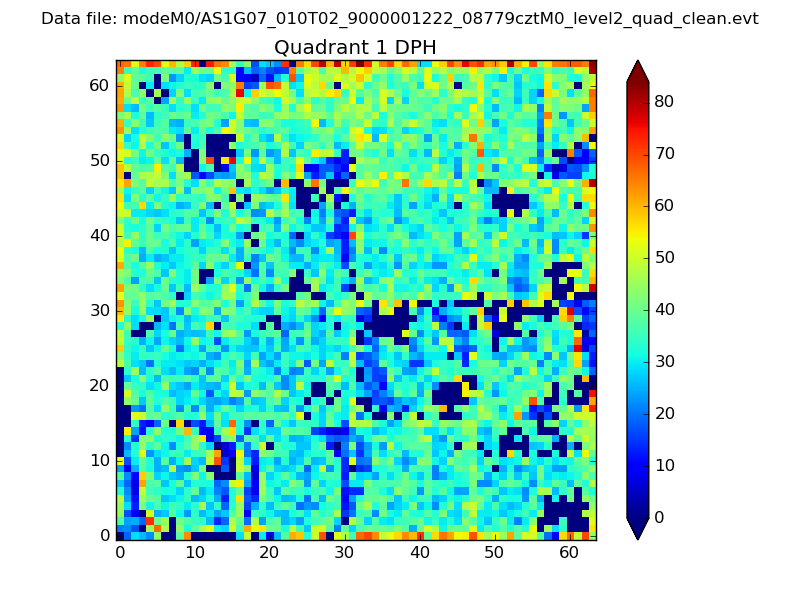 |
Quadrant B |
|---|---|---|---|
| Quadrant D | 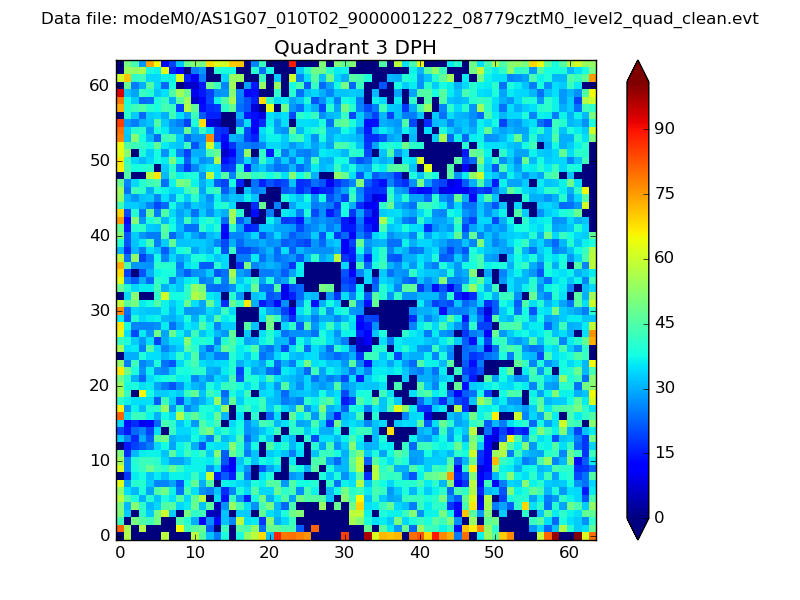 |
 |
Quadrant C |
| Plot type | Count rate plots | Images |
|---|---|---|
| Comparison with Poisson distribution Blue bars denote a histogram of data divided into 1 sec bins. Red curve is a Poisson curve with rate = median count rate of data. |
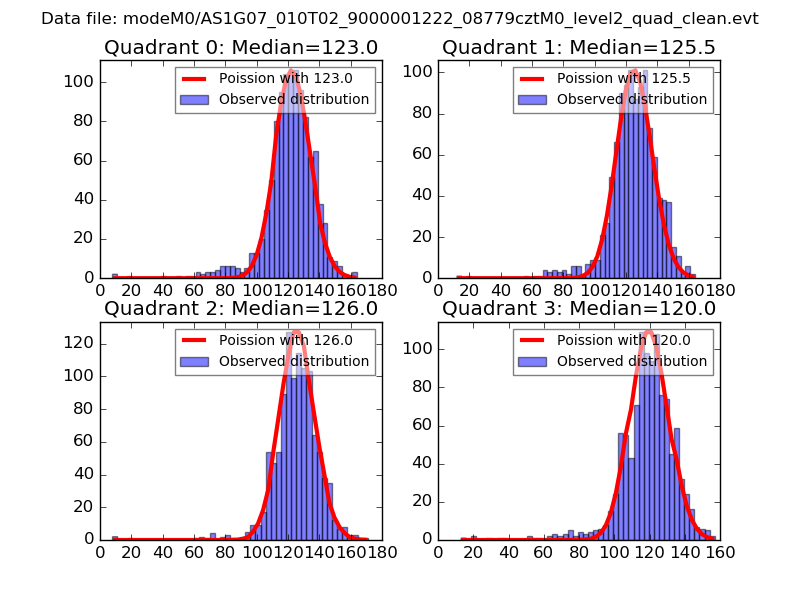 |
 |
| Quadrant-wise count rates Data is divided into 100 sec bins |
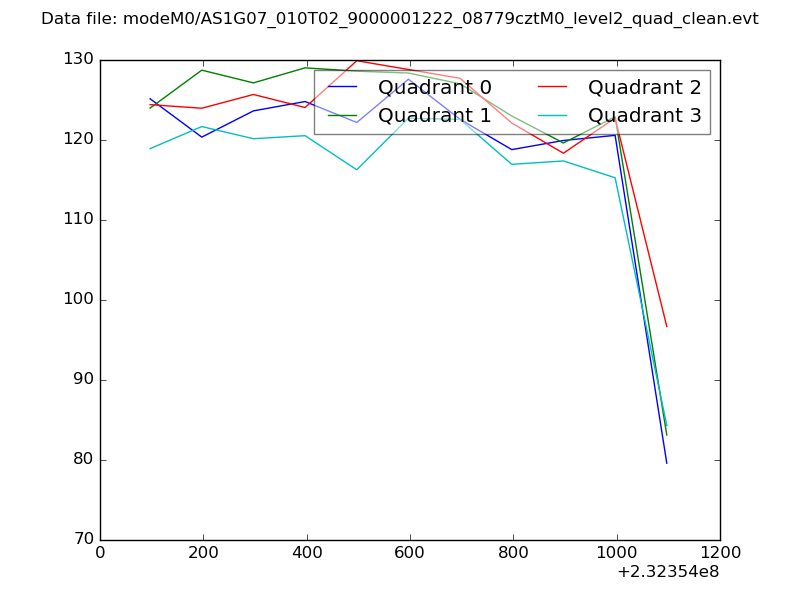 |
|
| Module-wise count rates for Quadrant A Data is divided into 100 sec bins |
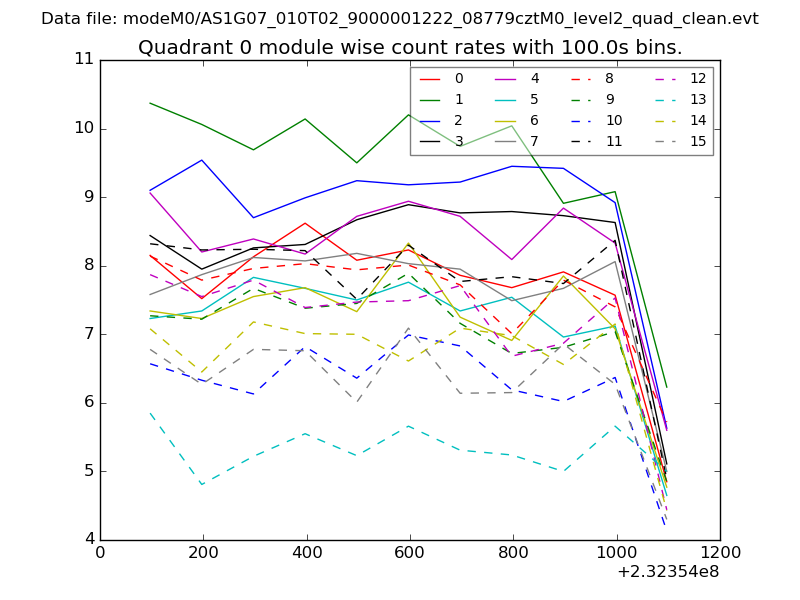 |
 |
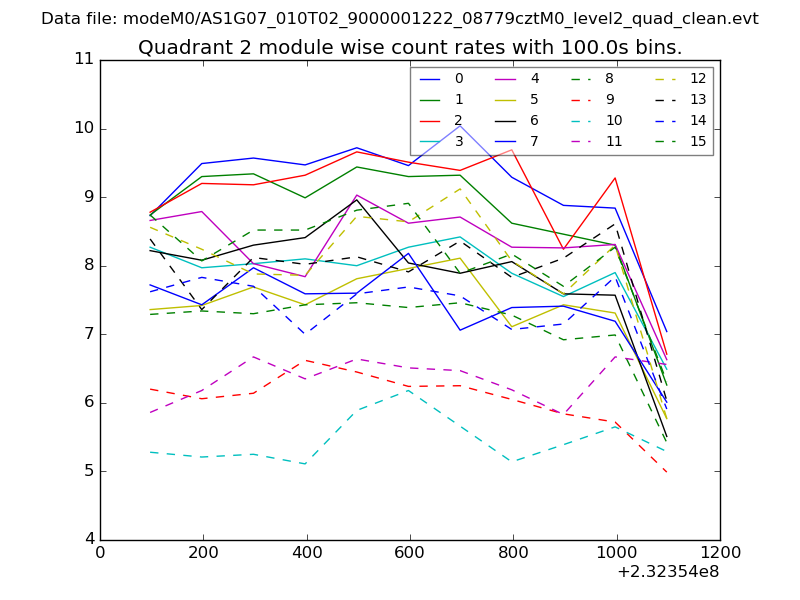
| Module-wise count rates for Quadrant B Data is divided into 100 sec bins |
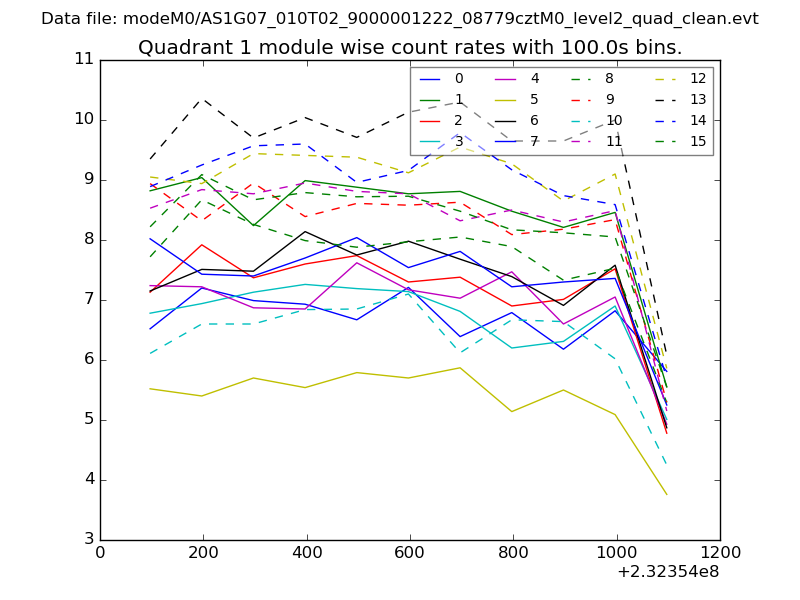 |
 |
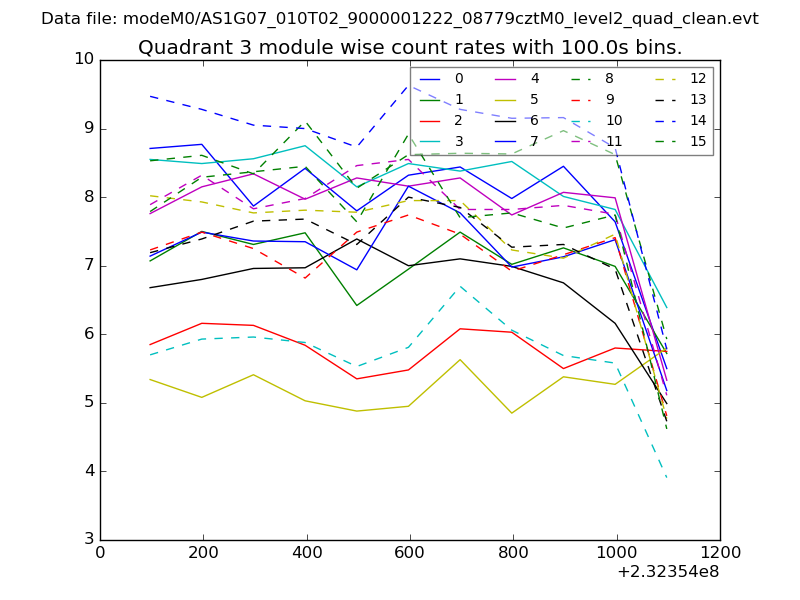
| Module-wise count rates for Quadrant C Data is divided into 100 sec bins |
 |
 |
| Module-wise count rates for Quadrant D Data is divided into 100 sec bins |
 |
 |
| Parameter | Plot |
|---|---|
| CZT HV Monitor | 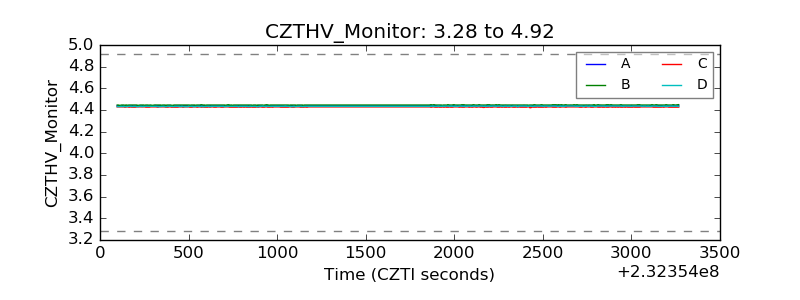 |
| D_VDD | 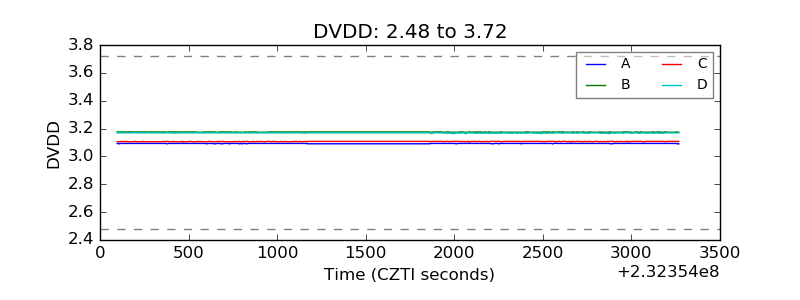 |
| Temperature 1 | 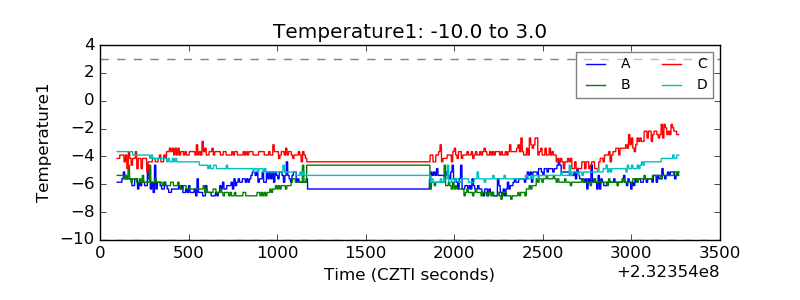 |
| Veto HV Monitor | 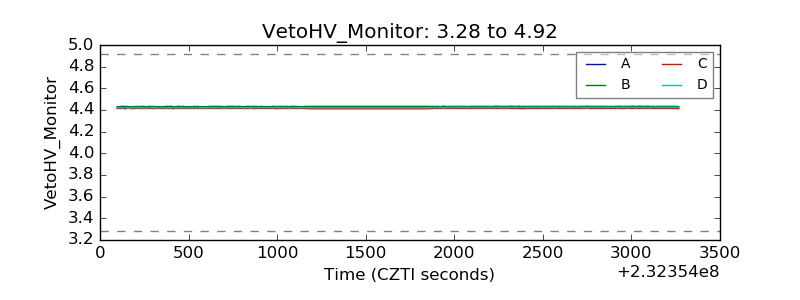 |
| Veto LLD | 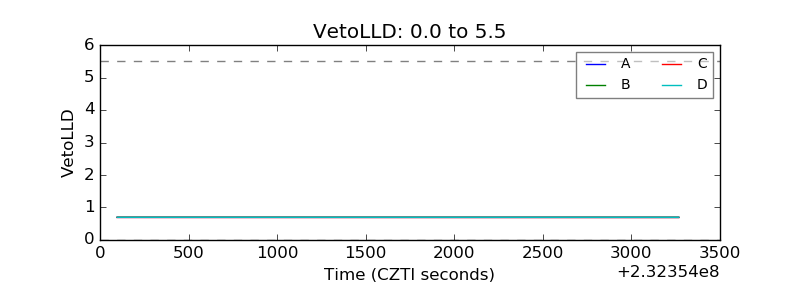 |
| Alpha Counter | 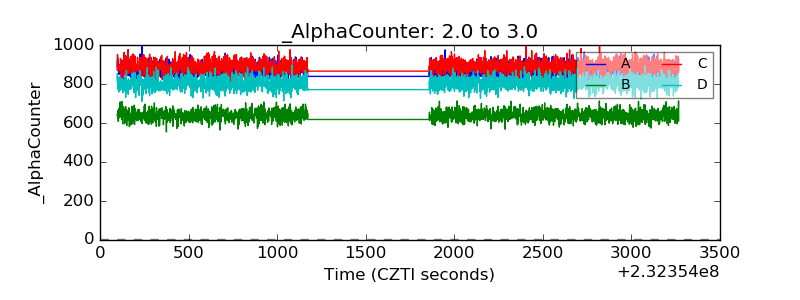 |
| _CPM_Rate | 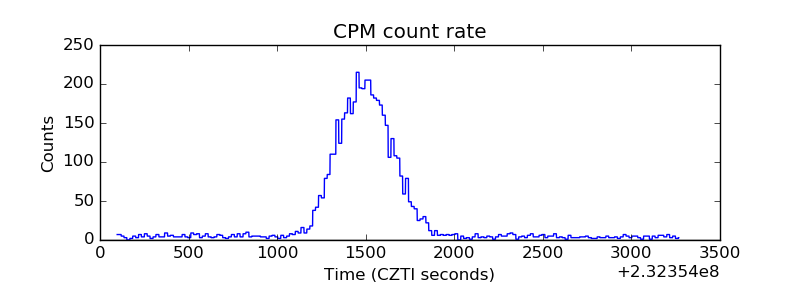 |
| CZT Counter | 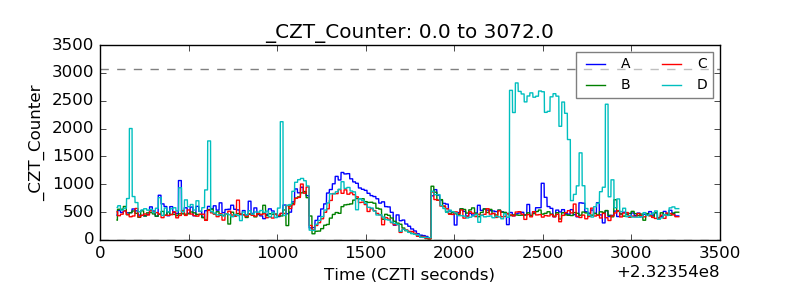 |
| +2.5 Volts monitor |  |
| +5 Volts monitor |  |
| _ROLL_ROT | 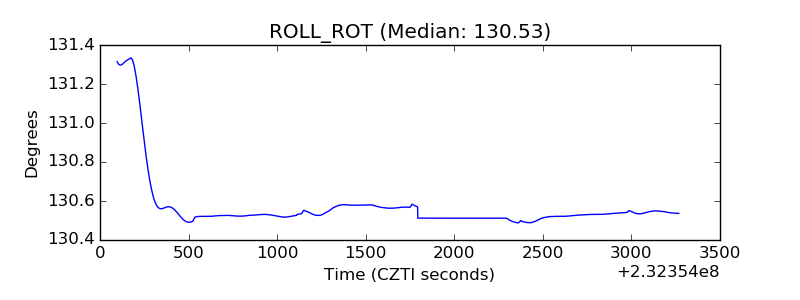 |
| _Roll_DEC | 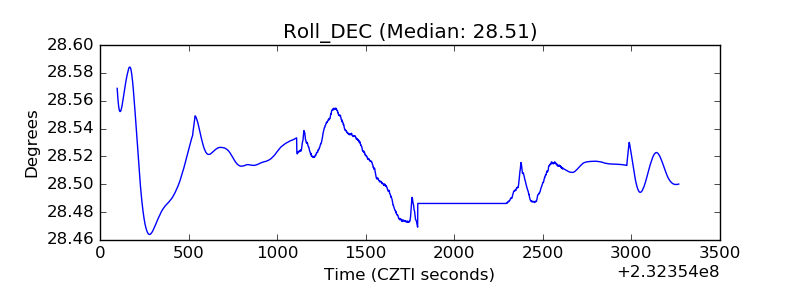 |
| _Roll_RA | 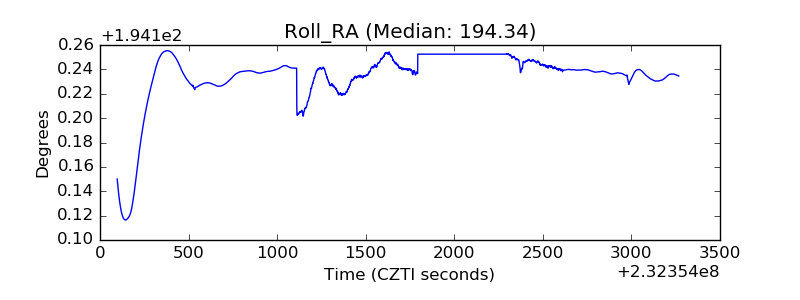 |
| Veto Counter | 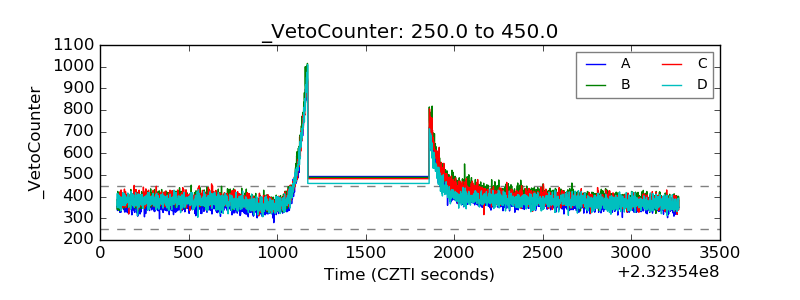 |