| Param | Original file | Final file |
|---|---|---|
| Filename | modeM0/AS1G07_010T02_9000001222_08781cztM0_level2.evt | modeM0/AS1G07_010T02_9000001222_08781cztM0_level2_quad_clean.evt |
| Size (bytes) | 480,245,760 | 69,405,120 |
| Size | 458.0 MB | 66.2 MB |
| Events in quadrant A | 3,535,379 | 429,166 |
| Events in quadrant B | 2,995,791 | 446,404 |
| Events in quadrant C | 2,857,077 | 441,186 |
| Events in quadrant D | 4,751,529 | 369,006 |
| Mode M0 | |||
|---|---|---|---|
| Quadrant | BADHDUFLAG | Total packets | Discarded packets |
| A | 0 | 16572 | 2255 |
| B | 0 | 14503 | 1749 |
| C | 0 | 14189 | 1698 |
| D | 0 | 22522 | 4320 |
| Mode SS | |||
|---|---|---|---|
| Quadrant | BADHDUFLAG | Total packets | Discarded packets |
| A | 0 | 140 | 18 |
| B | 0 | 140 | 14 |
| C | 0 | 140 | 6 |
| D | 0 | 139 | 18 |
| Mode M9 | |||
|---|---|---|---|
| Quadrant | BADHDUFLAG | Total packets | Discarded packets |
| A | 0 | 20 | 3 |
| B | 0 | 20 | 2 |
| C | 0 | 20 | 3 |
| D | 0 | 20 | 5 |
| Quadrant | Total seconds | Saturated seconds | Saturation percentage |
|---|---|---|---|
| A | 5963 | 139 | 2.331041% |
| B | 6054 | 112 | 1.850017% |
| C | 6054 | 73 | 1.205814% |
| D | 5643 | 283 | 5.015063% |
Noise dominated data is calculated using 1-second bins in cleaned event files. If a bin has >2000 counts, and if more than 50% of those come from <1% of pixels, then it is considered to be noise-dominated and hence unusable.
| Quadrant | # 1 sec bins | Bins with >0 counts | Bins with >2000 counts | High rate bins dominated by noise | Noise dominated (total time) | Noise dominated (detector-on time) | Marked lightcurve |
|---|---|---|---|---|---|---|---|
| A | 8808 | 6585 | 16 | 16 | 0.18% | 0.24% | 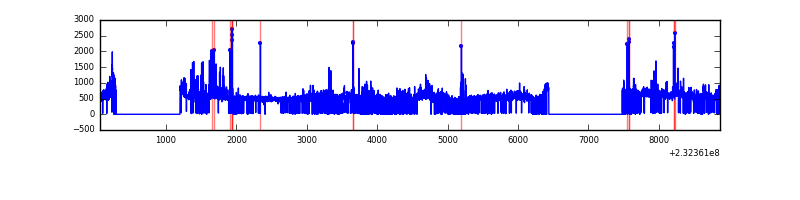 |
| B | 8808 | 6644 | 11 | 11 | 0.12% | 0.17% | 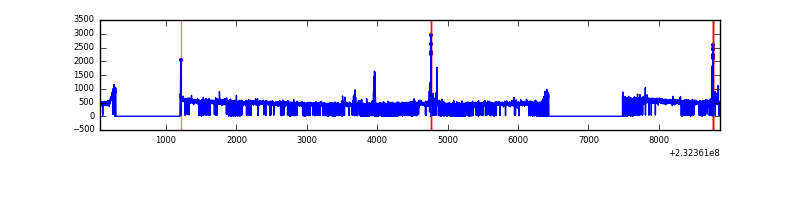 |
| C | 8808 | 6630 | 1 | 1 | 0.01% | 0.02% | 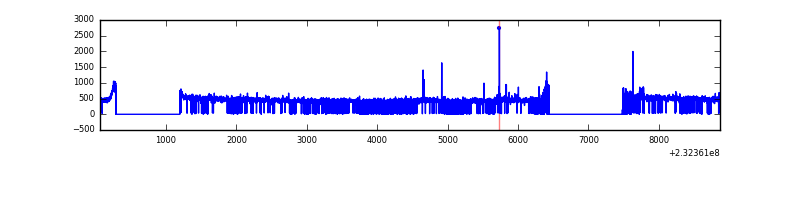 |
| D | 8808 | 6402 | 176 | 176 | 2.00% | 2.75% | 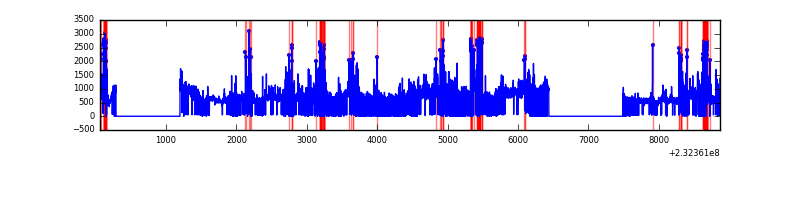 |
Top three noisy pixels from each quadrant. If the there are fewer than three noisy pixels in the level2.evt file, extra rows are filled as -1
| Pixel properties | Quadrant properties | ||||||
|---|---|---|---|---|---|---|---|
| Quadrant | DetID | PixID | Counts | Sigma | Mean | Median | Sigma |
| A | 8 | 5 | 519805 | 3434.76 | 738 | 722 | 151.1 |
| A | 13 | 251 | 85234 | 559.21 | 738 | 722 | 151.1 |
| A | 15 | 223 | 63115 | 412.85 | 738 | 722 | 151.1 |
| B | 10 | 16 | 43949 | 297.05 | 749 | 731 | 145.5 |
| B | 5 | 255 | 33336 | 224.1 | 749 | 731 | 145.5 |
| B | 12 | 111 | 16159 | 106.04 | 749 | 731 | 145.5 |
| C | 1 | 16 | 23468 | 135.36 | 723 | 726 | 168.0 |
| C | 13 | 61 | 5544 | 28.67 | 723 | 726 | 168.0 |
| C | 12 | 4 | 3987 | 19.41 | 723 | 726 | 168.0 |
| D | 2 | 16 | 1354594 | 7954.89 | 663 | 646 | 170.2 |
| D | 1 | 52 | 460923 | 2704.28 | 663 | 646 | 170.2 |
| D | 2 | 152 | 218989 | 1282.83 | 663 | 646 | 170.2 |
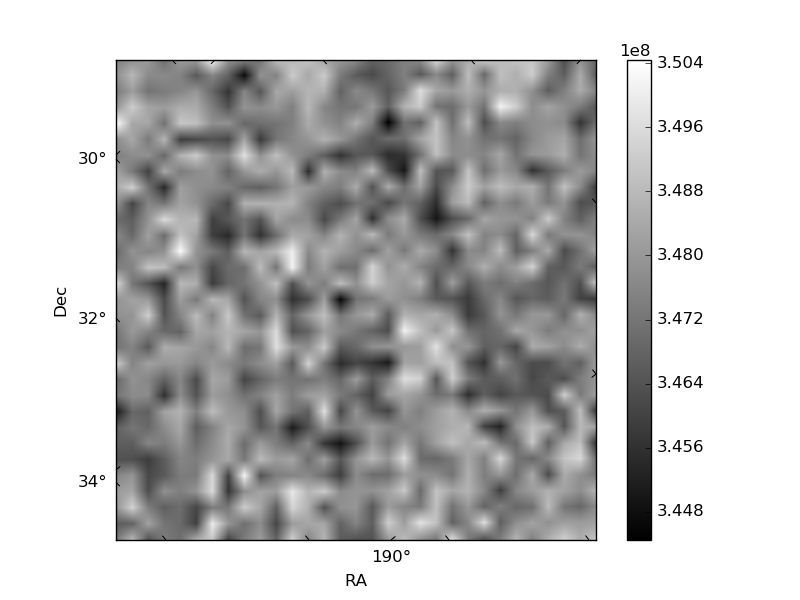
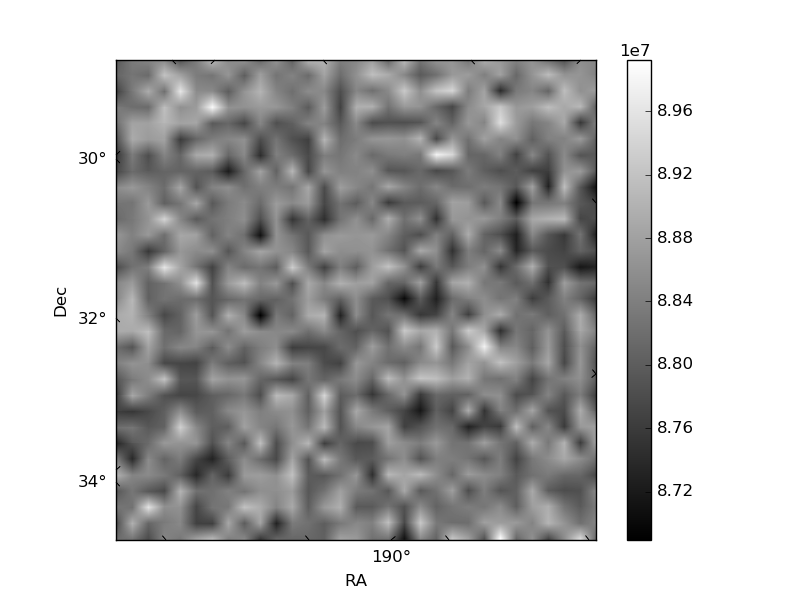
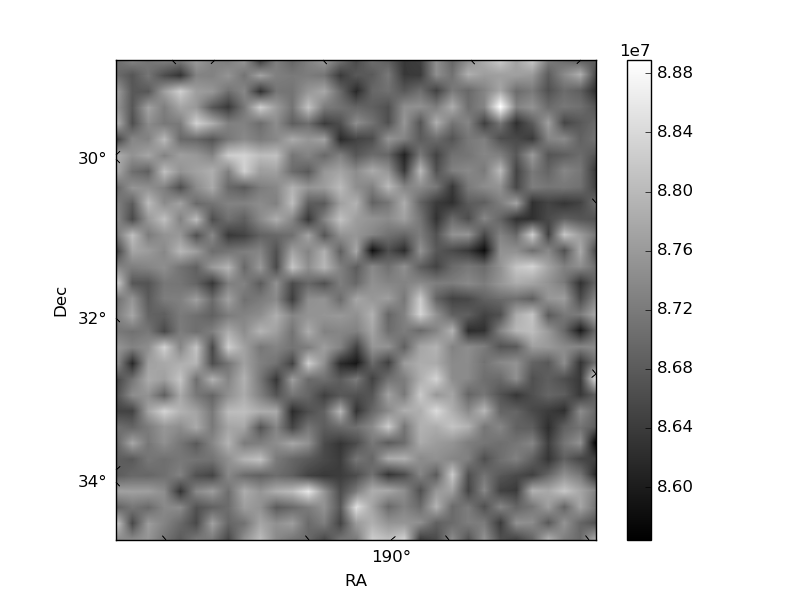
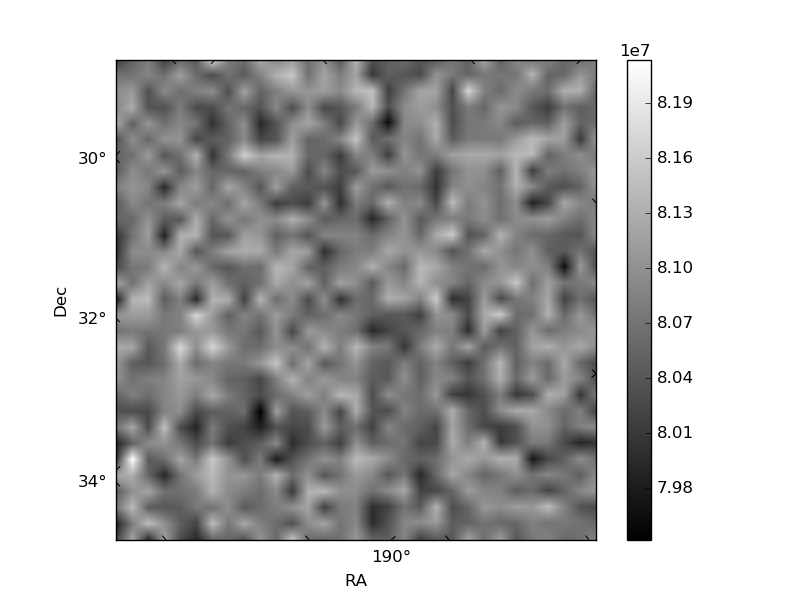
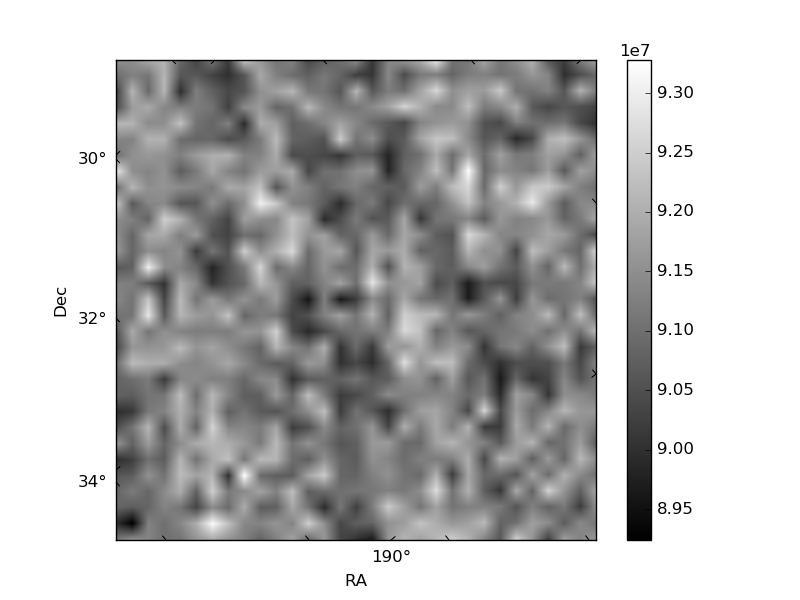
Histogram calculated using DETX and DETY for each event in the final _common_clean file
| Quadrant A | 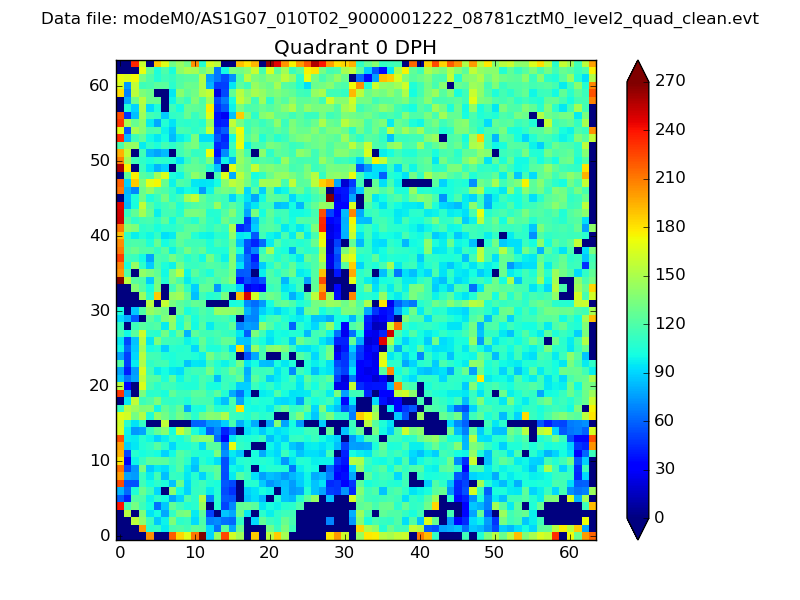 |
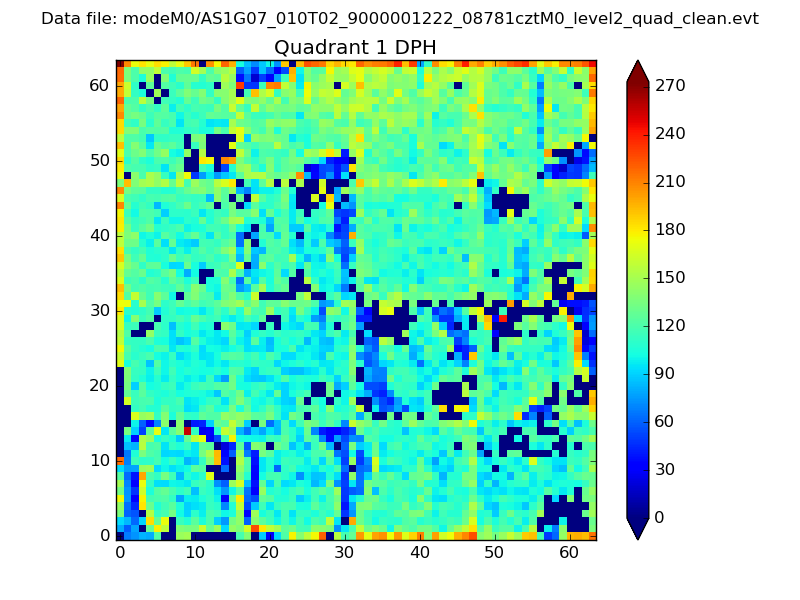 |
Quadrant B |
|---|---|---|---|
| Quadrant D | 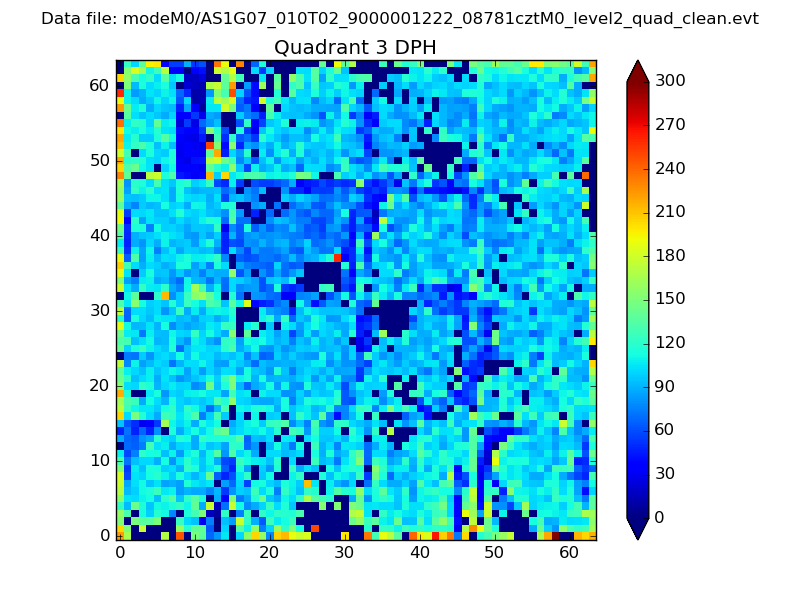 |
 |
Quadrant C |
| Plot type | Count rate plots | Images |
|---|---|---|
| Comparison with Poisson distribution Blue bars denote a histogram of data divided into 1 sec bins. Red curve is a Poisson curve with rate = median count rate of data. |
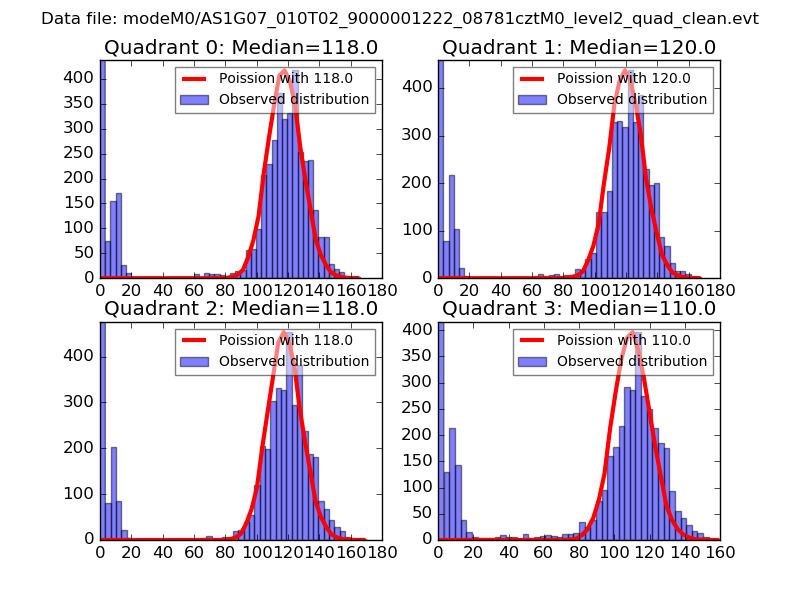 |
 |
| Quadrant-wise count rates Data is divided into 100 sec bins |
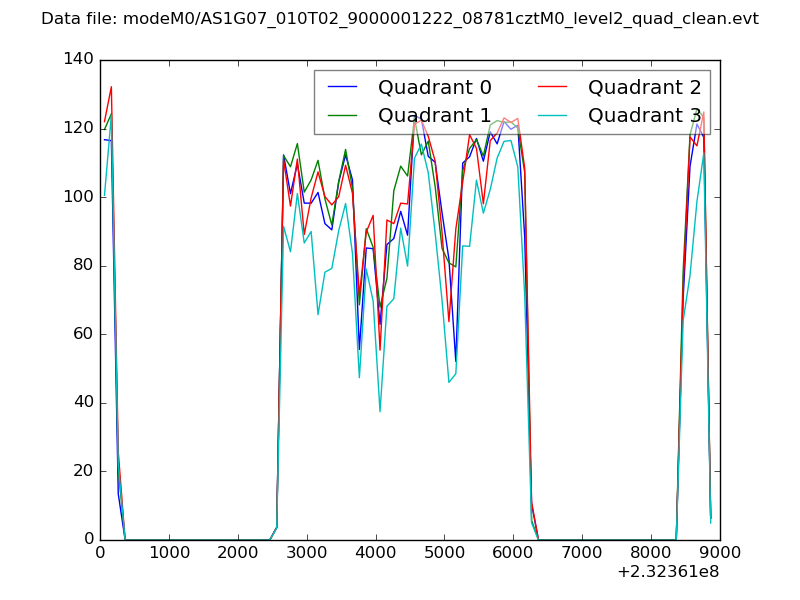 |
|
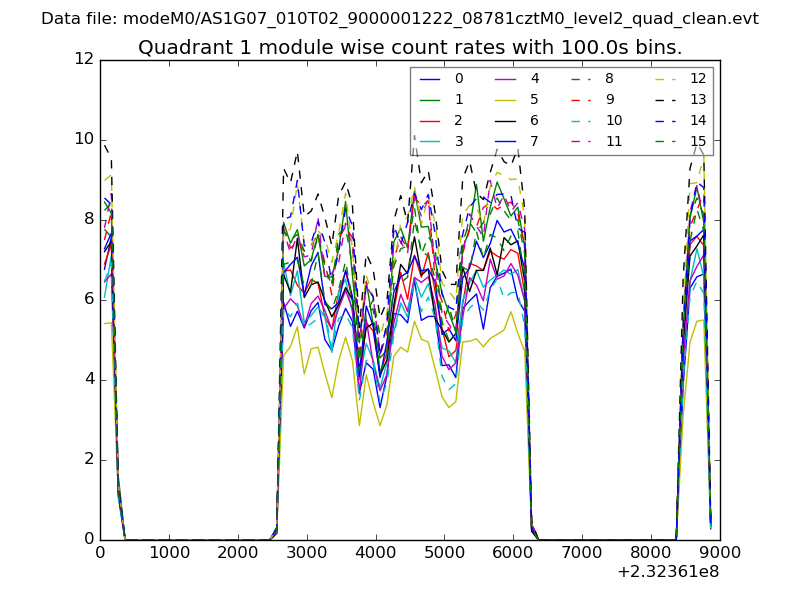
| Module-wise count rates for Quadrant A Data is divided into 100 sec bins |
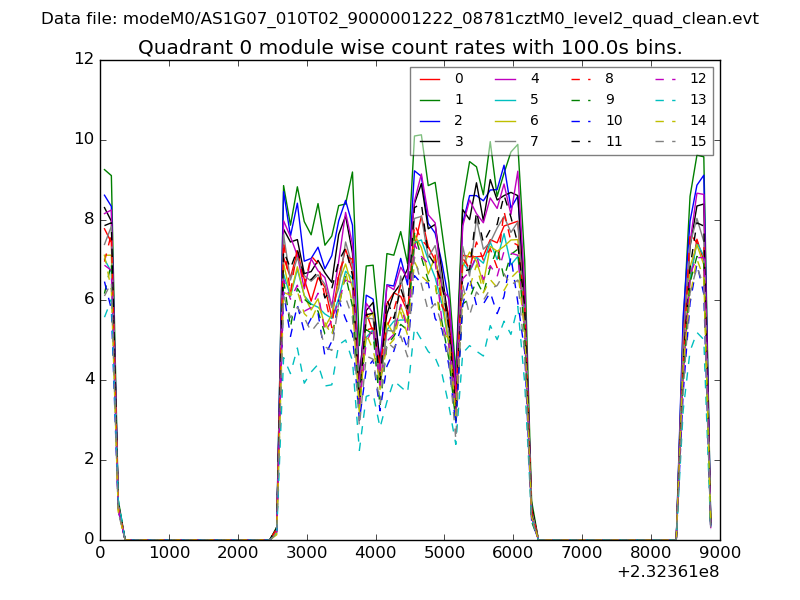 |
 |
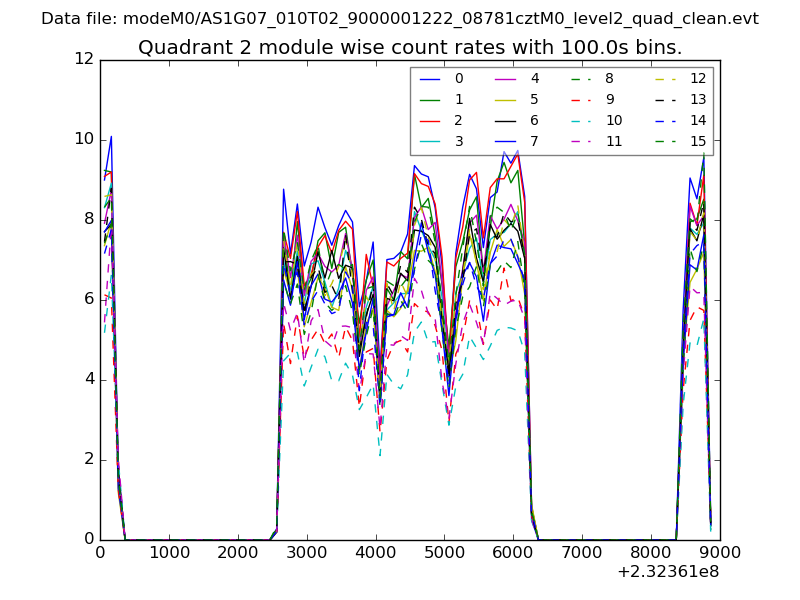
| Module-wise count rates for Quadrant B Data is divided into 100 sec bins |
 |
 |
| Module-wise count rates for Quadrant C Data is divided into 100 sec bins |
 |
 |
| Module-wise count rates for Quadrant D Data is divided into 100 sec bins |
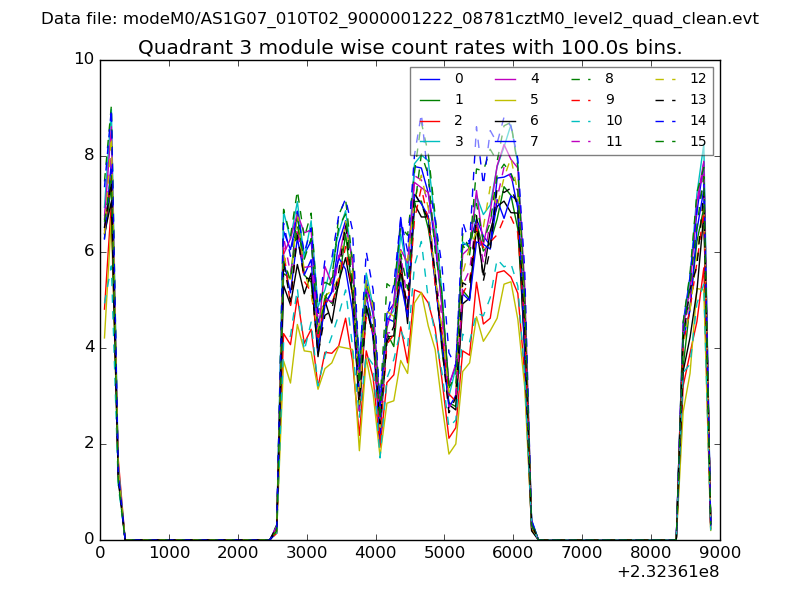 |
 |
| Parameter | Plot |
|---|---|
| CZT HV Monitor | 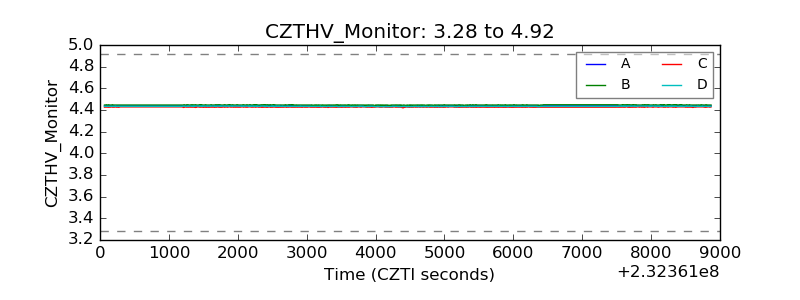 |
| D_VDD | 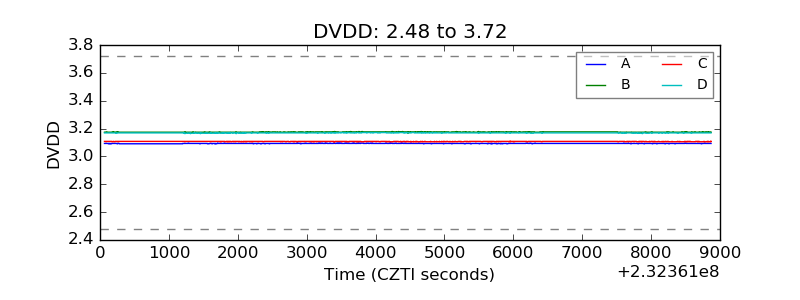 |
| Temperature 1 | 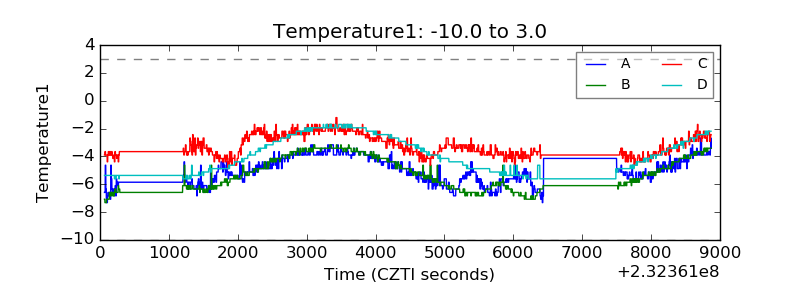 |
| Veto HV Monitor | 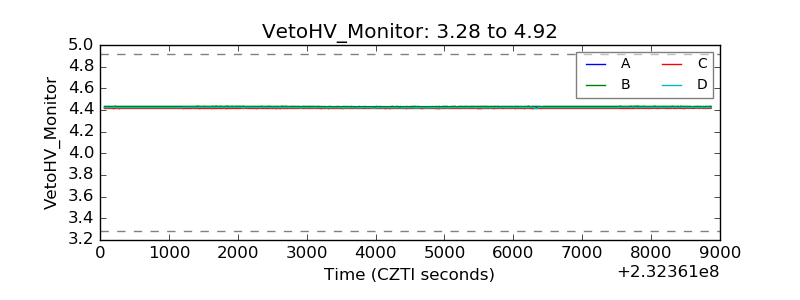 |
| Veto LLD | 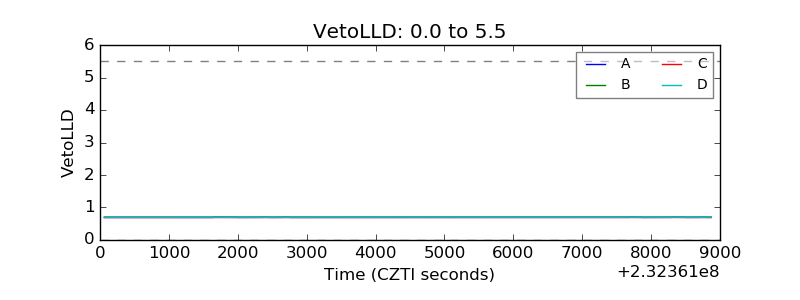 |
| Alpha Counter | 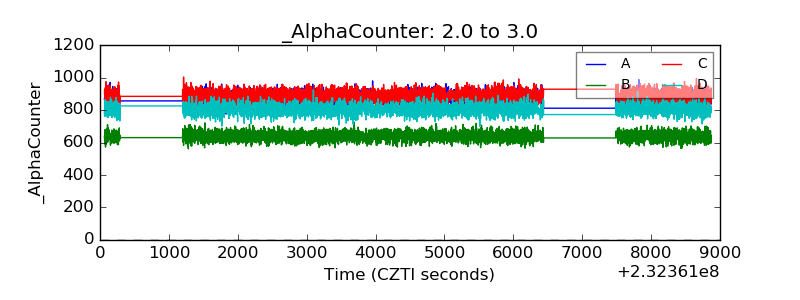 |
| _CPM_Rate | 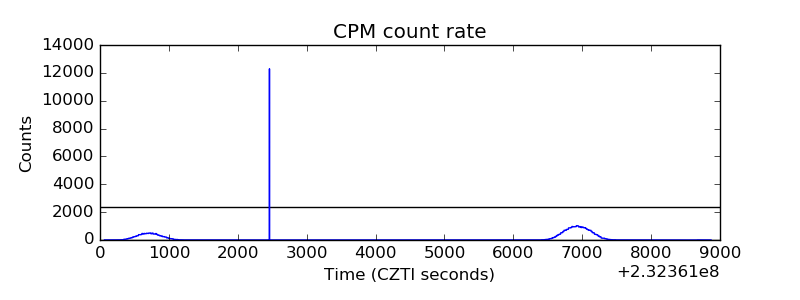 |
| CZT Counter |  |
| +2.5 Volts monitor |  |
| +5 Volts monitor |  |
| _ROLL_ROT | 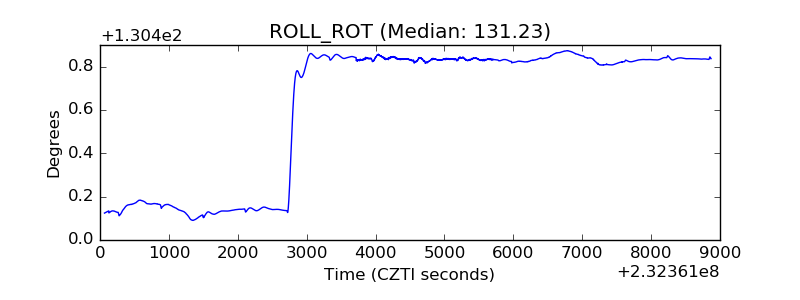 |
| _Roll_DEC | 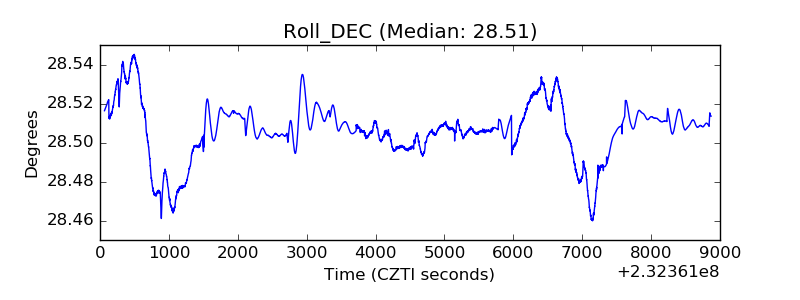 |
| _Roll_RA | 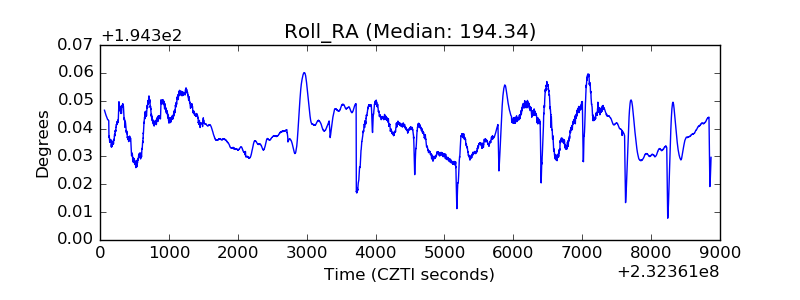 |
| Veto Counter | 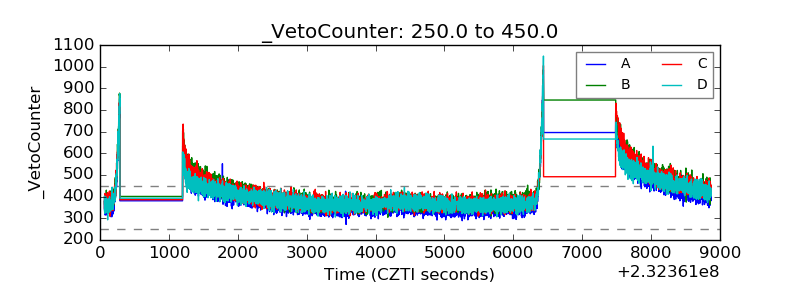 |