| Param | Original file | Final file |
|---|---|---|
| Filename | modeM0/AS1G07_010T02_9000001222_08783cztM0_level2.evt | modeM0/AS1G07_010T02_9000001222_08783cztM0_level2_quad_clean.evt |
| Size (bytes) | 549,377,280 | 88,323,840 |
| Size | 523.9 MB | 84.2 MB |
| Events in quadrant A | 4,601,312 | 556,898 |
| Events in quadrant B | 3,440,247 | 574,341 |
| Events in quadrant C | 3,170,266 | 565,598 |
| Events in quadrant D | 4,987,122 | 526,097 |
| Mode M0 | |||
|---|---|---|---|
| Quadrant | BADHDUFLAG | Total packets | Discarded packets |
| A | 0 | 18048 | 2 |
| B | 0 | 14374 | 1 |
| C | 0 | 13600 | 1 |
| D | 0 | 19161 | 1 |
| Mode SS | |||
|---|---|---|---|
| Quadrant | BADHDUFLAG | Total packets | Discarded packets |
| A | 0 | 130 | 0 |
| B | 0 | 130 | 0 |
| C | 0 | 130 | 0 |
| D | 0 | 130 | 0 |
| Mode M9 | |||
|---|---|---|---|
| Quadrant | BADHDUFLAG | Total packets | Discarded packets |
| A | 0 | 12 | 0 |
| B | 0 | 12 | 0 |
| C | 0 | 12 | 0 |
| D | 0 | 12 | 0 |
| Quadrant | Total seconds | Saturated seconds | Saturation percentage |
|---|---|---|---|
| A | 6479 | 343 | 5.294027% |
| B | 6479 | 126 | 1.944745% |
| C | 6479 | 53 | 0.818027% |
| D | 6479 | 484 | 7.470289% |
Noise dominated data is calculated using 1-second bins in cleaned event files. If a bin has >2000 counts, and if more than 50% of those come from <1% of pixels, then it is considered to be noise-dominated and hence unusable.
| Quadrant | # 1 sec bins | Bins with >0 counts | Bins with >2000 counts | High rate bins dominated by noise | Noise dominated (total time) | Noise dominated (detector-on time) | Marked lightcurve |
|---|---|---|---|---|---|---|---|
| A | 7669 | 6479 | 267 | 267 | 3.48% | 4.12% | 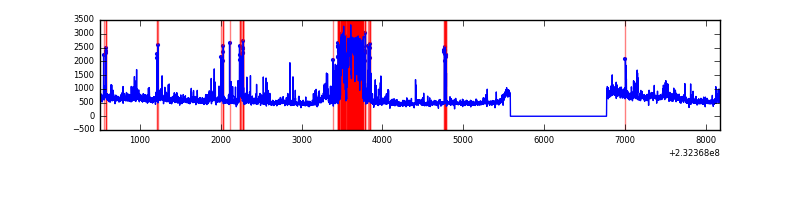 |
| B | 7669 | 6479 | 58 | 58 | 0.76% | 0.90% | 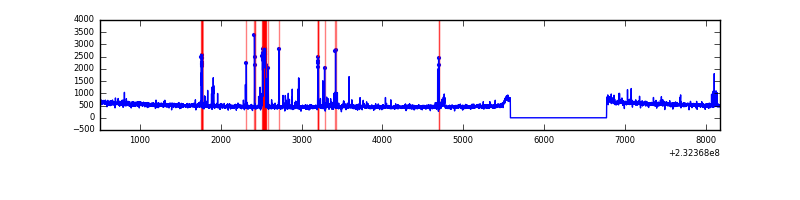 |
| C | 7669 | 6479 | 4 | 4 | 0.05% | 0.06% |  |
| D | 7669 | 6479 | 340 | 340 | 4.43% | 5.25% | 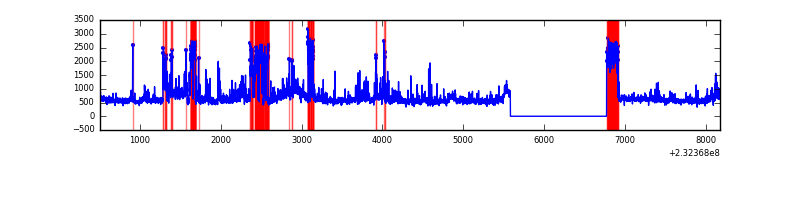 |
Top three noisy pixels from each quadrant. If the there are fewer than three noisy pixels in the level2.evt file, extra rows are filled as -1
| Pixel properties | Quadrant properties | ||||||
|---|---|---|---|---|---|---|---|
| Quadrant | DetID | PixID | Counts | Sigma | Mean | Median | Sigma |
| A | 15 | 223 | 700610 | 4270.15 | 812 | 794 | 163.9 |
| A | 8 | 5 | 448410 | 2731.27 | 812 | 794 | 163.9 |
| A | 15 | 239 | 258392 | 1571.82 | 812 | 794 | 163.9 |
| B | 10 | 16 | 165956 | 1065.61 | 815 | 795 | 155.0 |
| B | 5 | 255 | 62779 | 399.92 | 815 | 795 | 155.0 |
| B | 4 | 173 | 24572 | 153.41 | 815 | 795 | 155.0 |
| C | 9 | 68 | 46276 | 247.61 | 794 | 800 | 183.7 |
| C | 1 | 16 | 20681 | 108.25 | 794 | 800 | 183.7 |
| C | 14 | 234 | 5864 | 27.57 | 794 | 800 | 183.7 |
| D | 2 | 16 | 1268611 | 6463.61 | 772 | 754 | 196.2 |
| D | 1 | 52 | 355195 | 1806.96 | 772 | 754 | 196.2 |
| D | 2 | 152 | 222113 | 1128.5 | 772 | 754 | 196.2 |
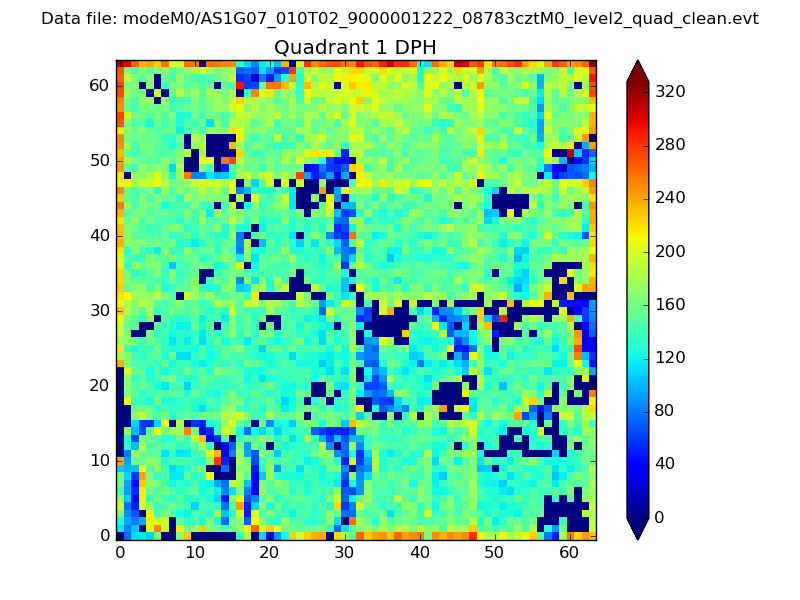
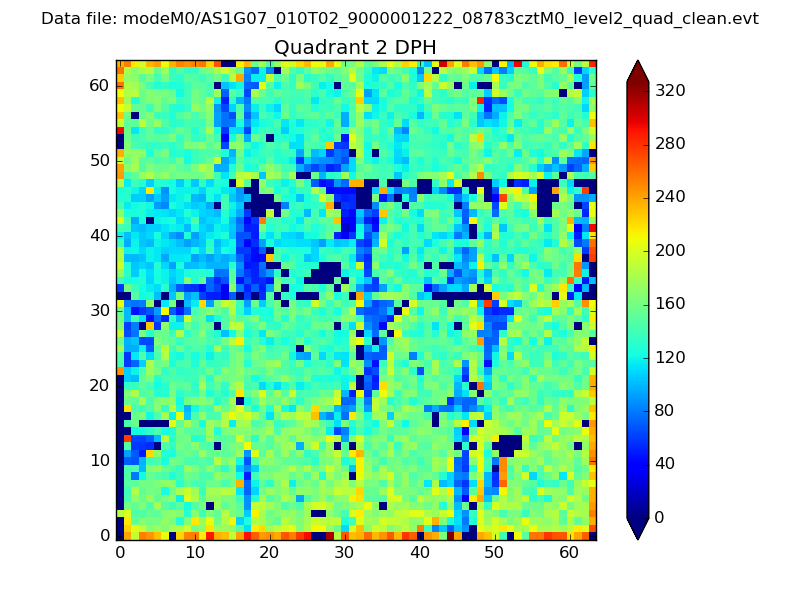
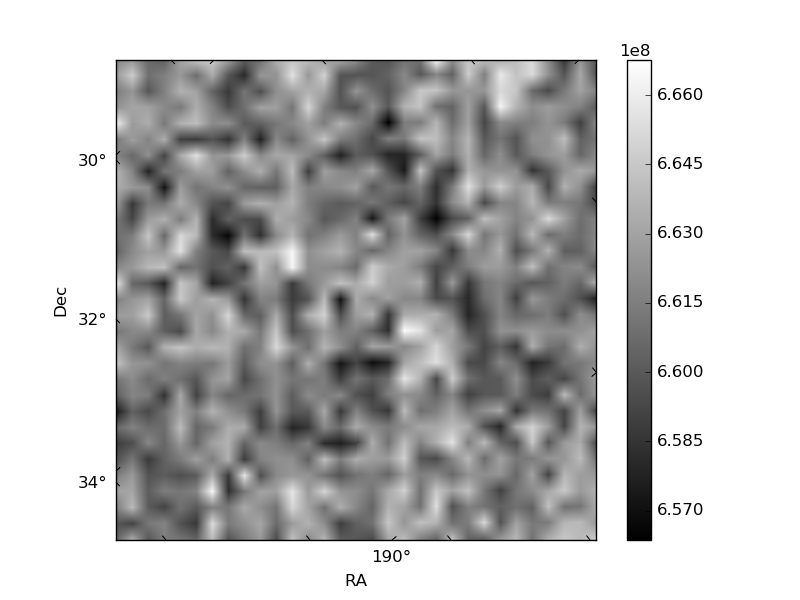
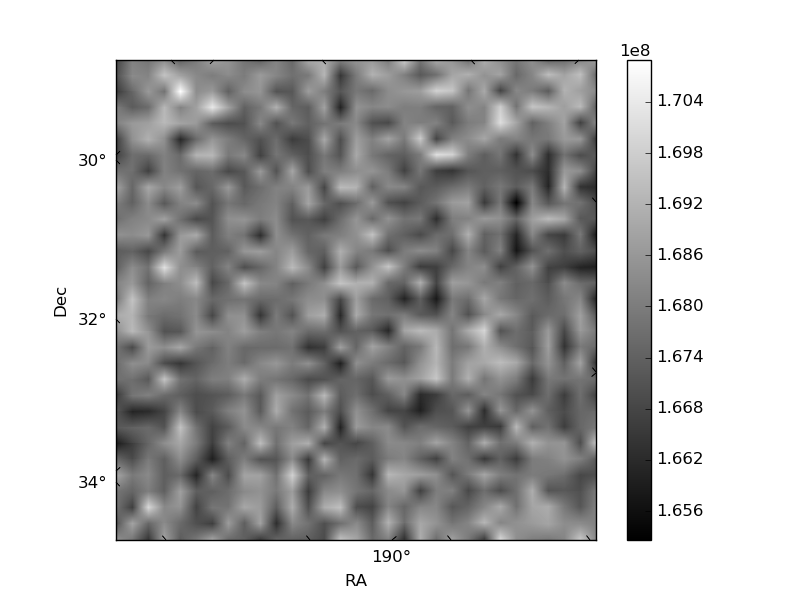
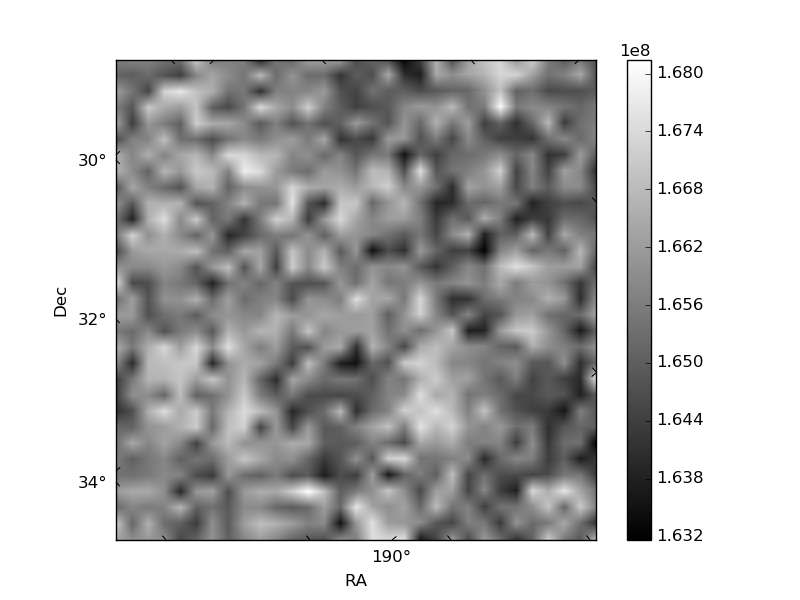
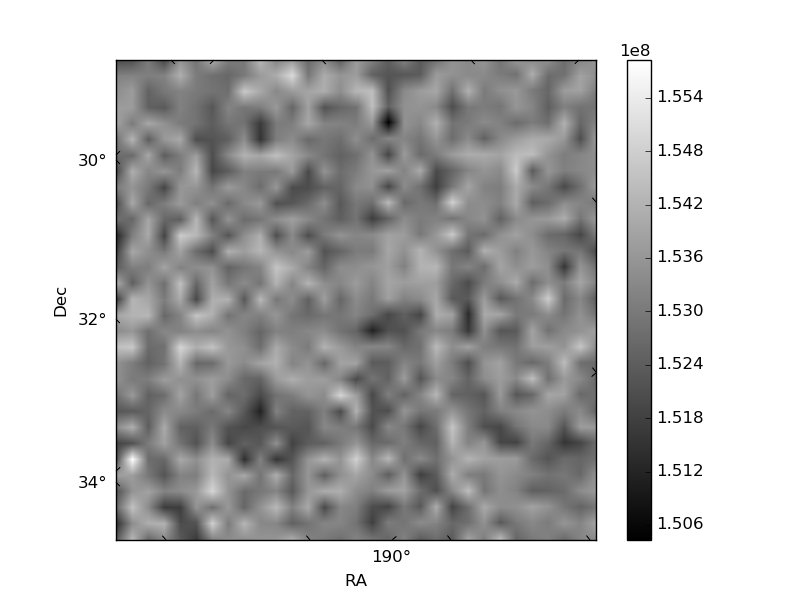
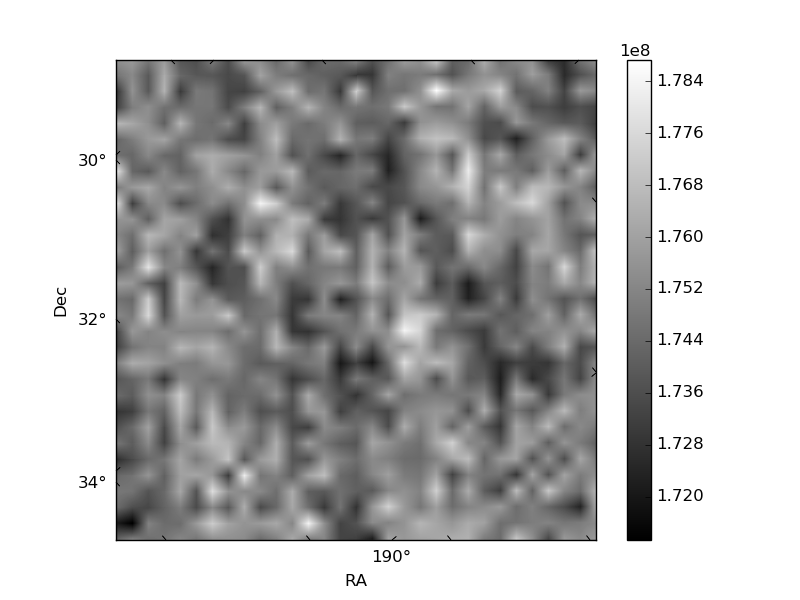
Histogram calculated using DETX and DETY for each event in the final _common_clean file
| Quadrant A | 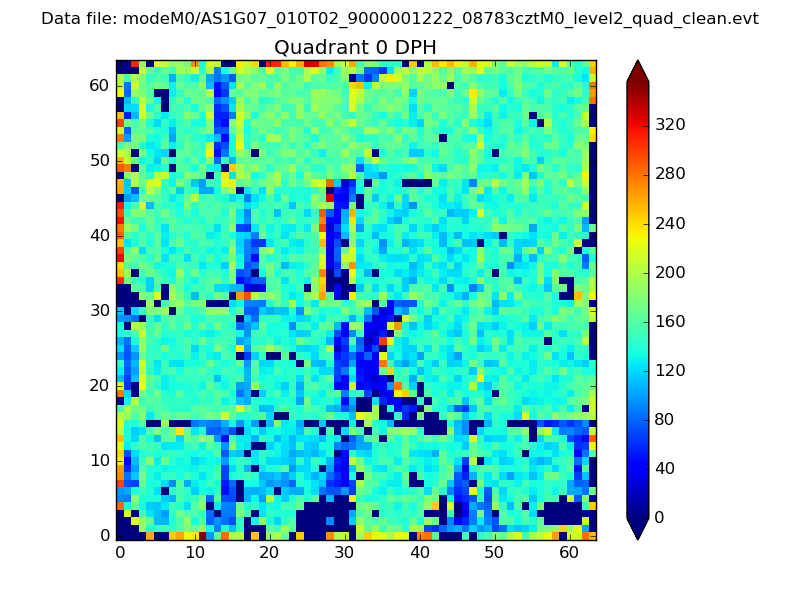 |
 |
Quadrant B |
|---|---|---|---|
| Quadrant D | 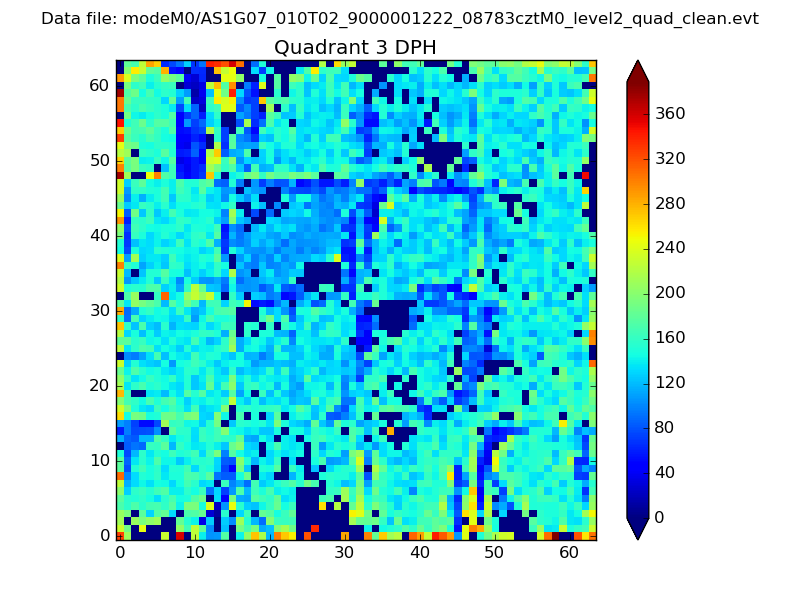 |
 |
Quadrant C |
| Plot type | Count rate plots | Images |
|---|---|---|
| Comparison with Poisson distribution Blue bars denote a histogram of data divided into 1 sec bins. Red curve is a Poisson curve with rate = median count rate of data. |
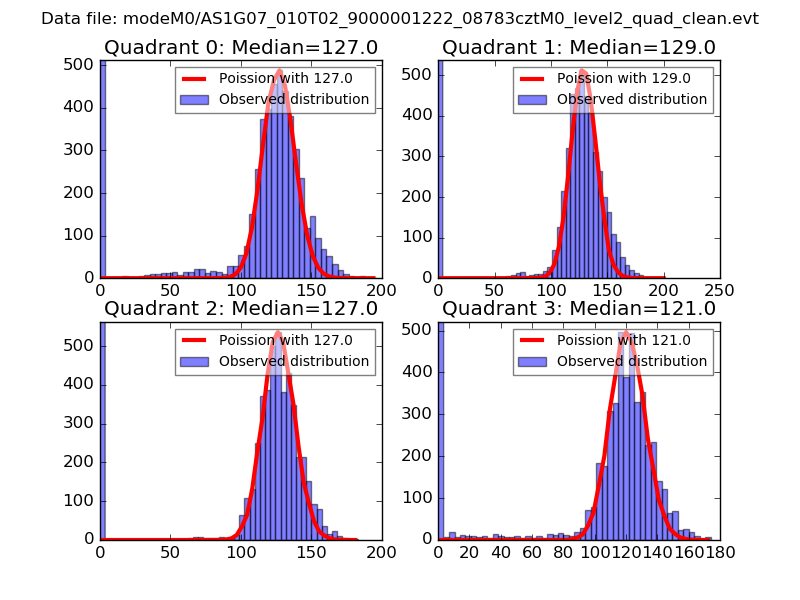 |
 |
| Quadrant-wise count rates Data is divided into 100 sec bins |
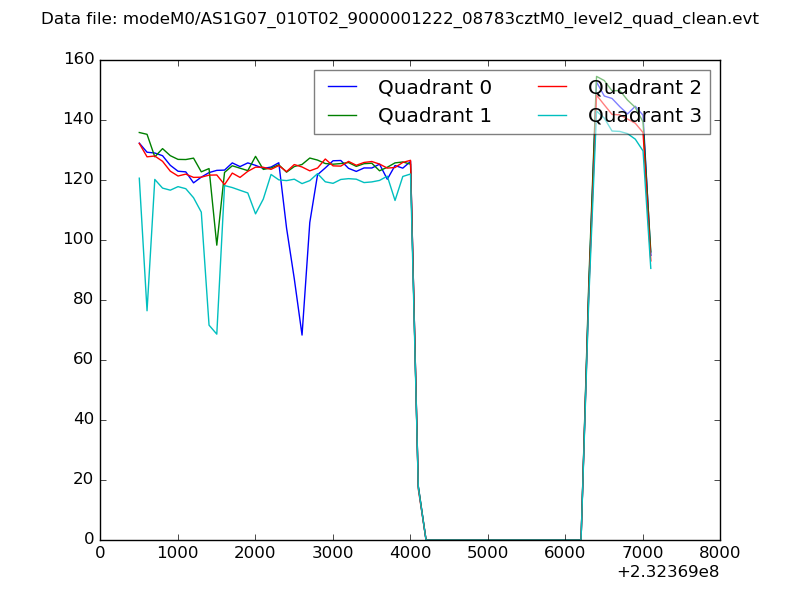 |
|
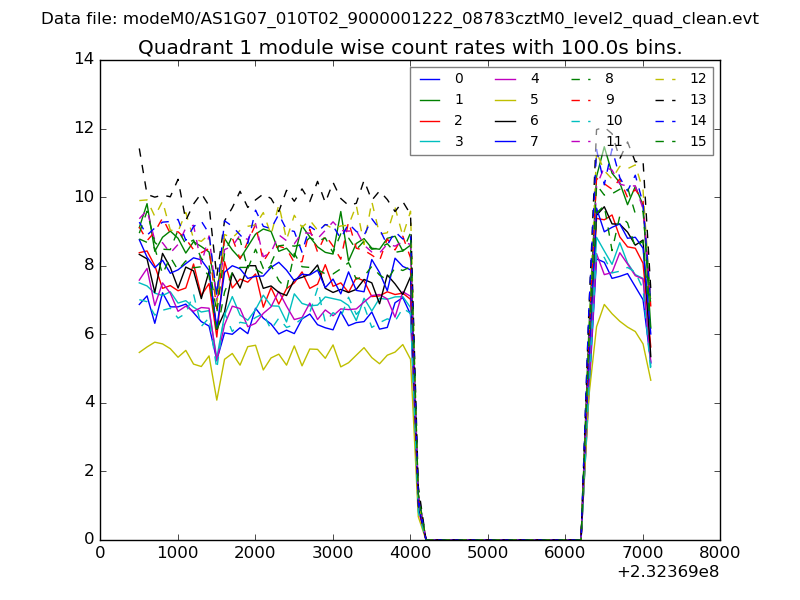
| Module-wise count rates for Quadrant A Data is divided into 100 sec bins |
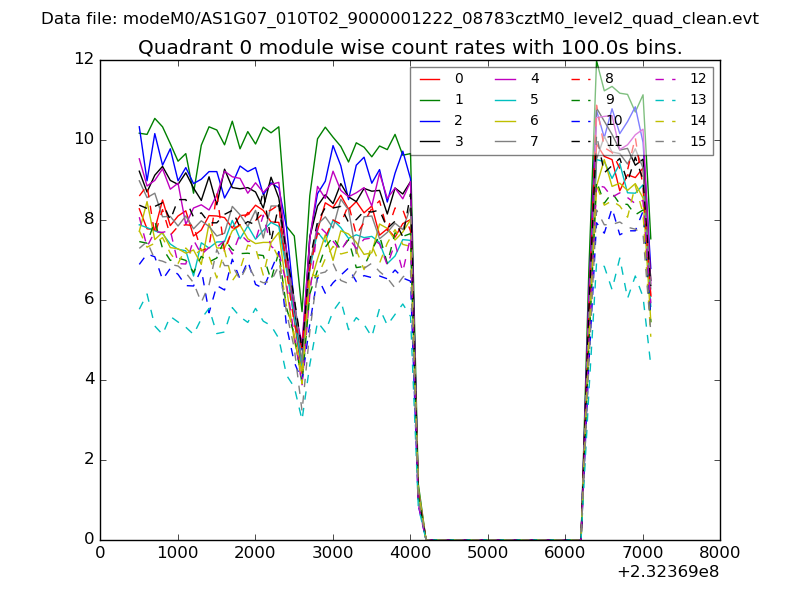 |
 |
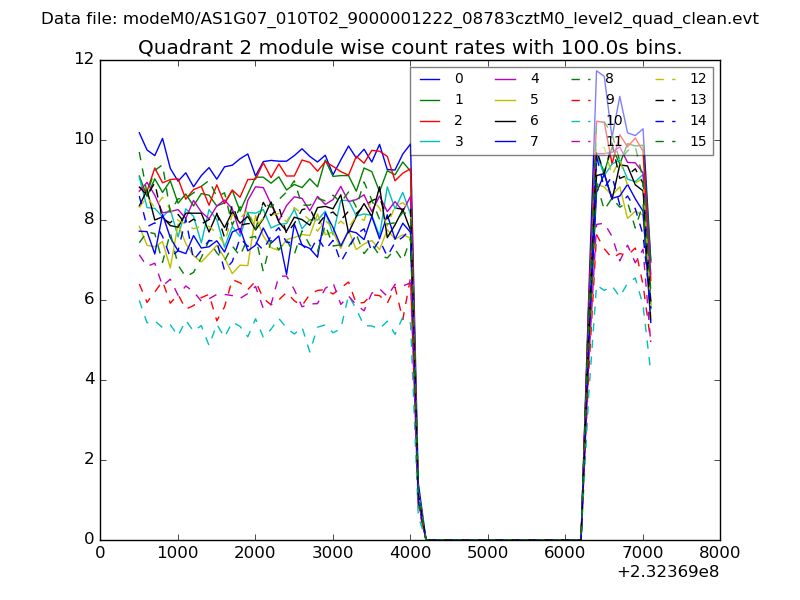
| Module-wise count rates for Quadrant B Data is divided into 100 sec bins |
 |
 |
| Module-wise count rates for Quadrant C Data is divided into 100 sec bins |
 |
 |
| Module-wise count rates for Quadrant D Data is divided into 100 sec bins |
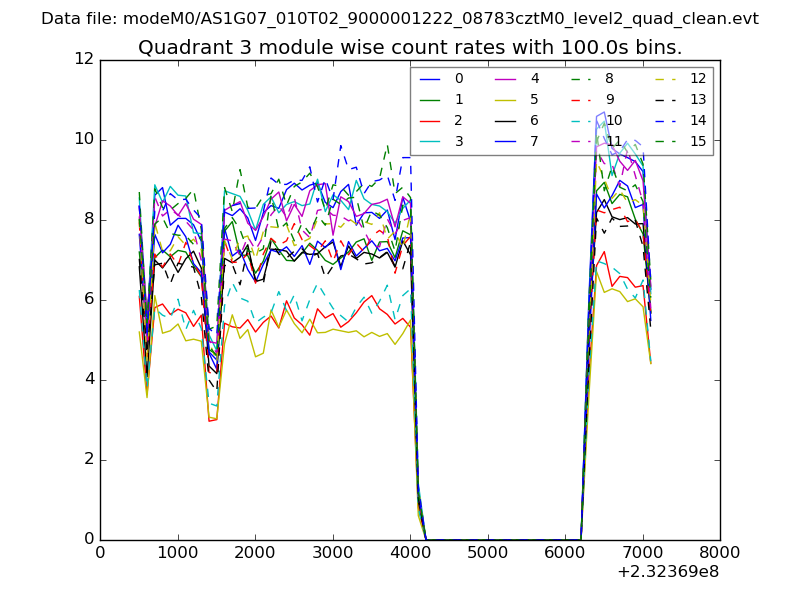 |
 |
| Parameter | Plot |
|---|---|
| CZT HV Monitor | 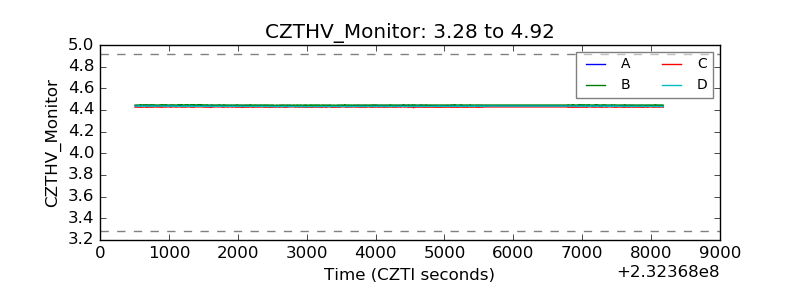 |
| D_VDD | 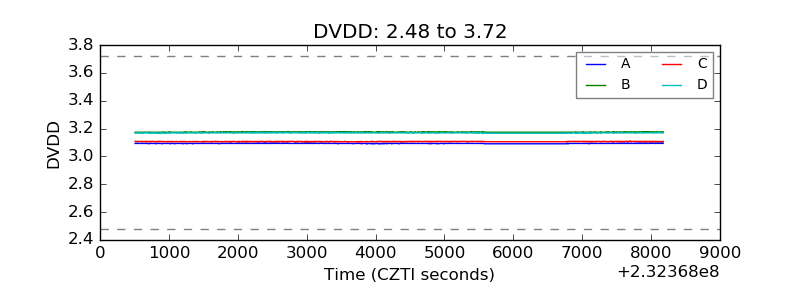 |
| Temperature 1 | 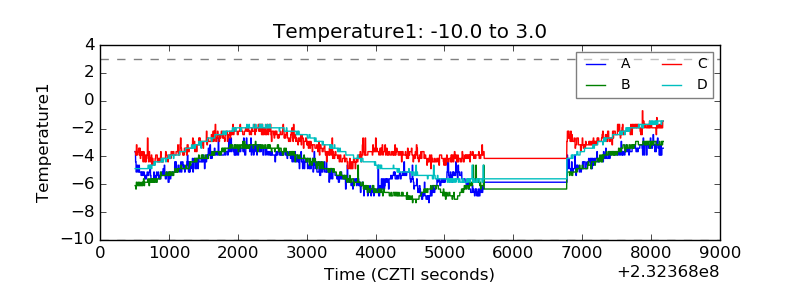 |
| Veto HV Monitor |  |
| Veto LLD | 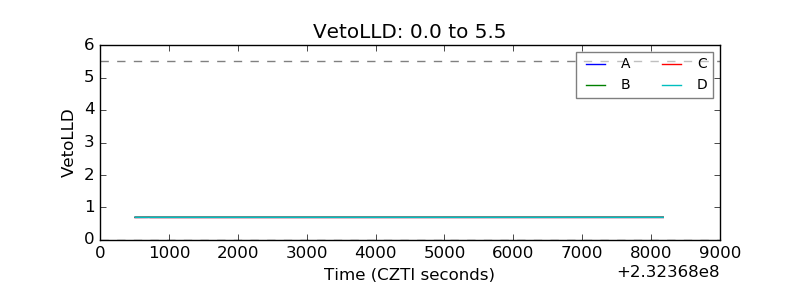 |
| Alpha Counter | 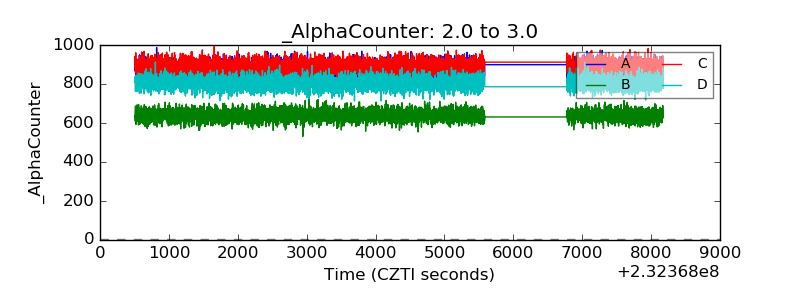 |
| _CPM_Rate | 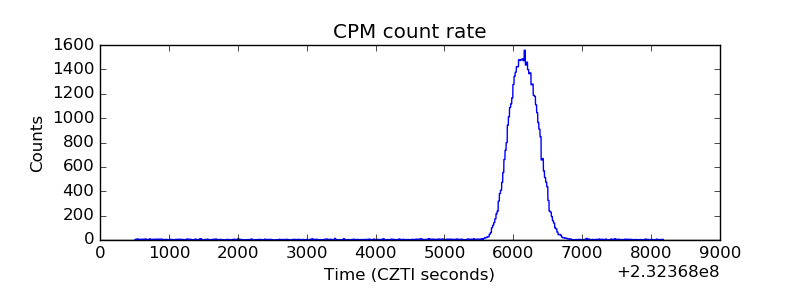 |
| CZT Counter | 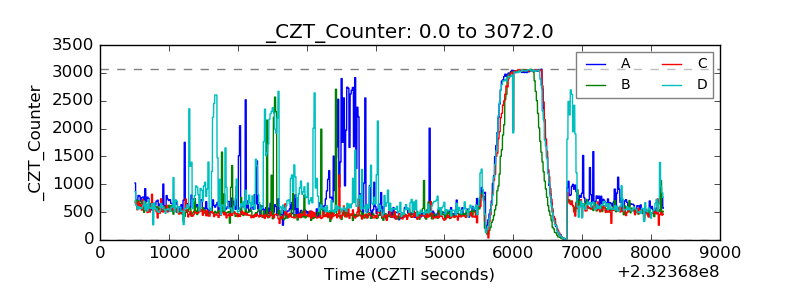 |
| +2.5 Volts monitor |  |
| +5 Volts monitor |  |
| _ROLL_ROT | 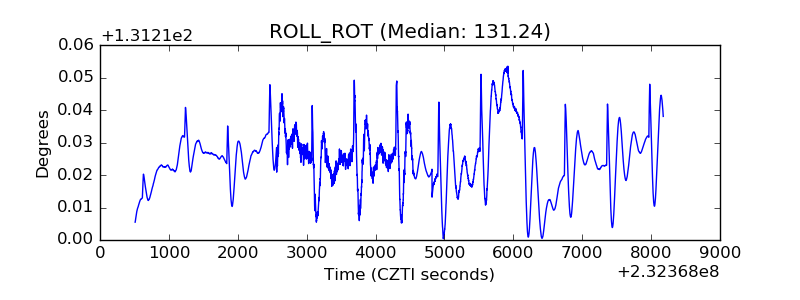 |
| _Roll_DEC | 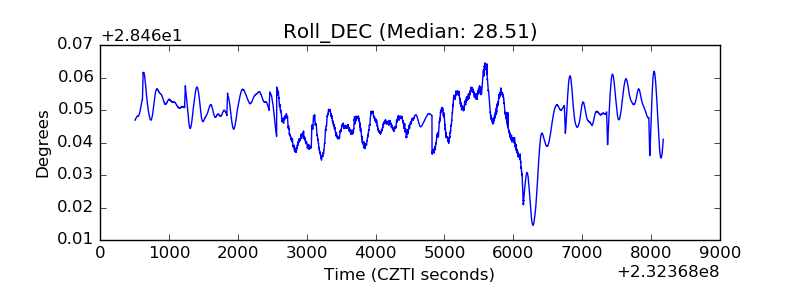 |
| _Roll_RA | 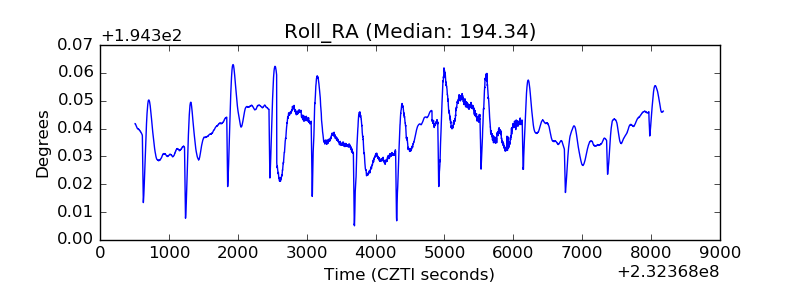 |
| Veto Counter | 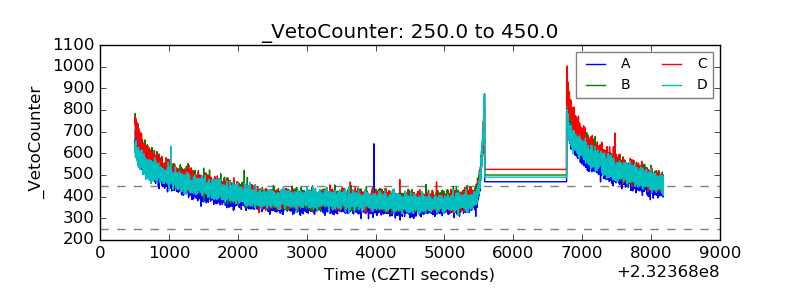 |