| Param | Original file | Final file |
|---|---|---|
| Filename | modeM0/AS1G07_010T02_9000001222_08785cztM0_level2.evt | modeM0/AS1G07_010T02_9000001222_08785cztM0_level2_quad_clean.evt |
| Size (bytes) | 447,315,840 | 106,911,360 |
| Size | 426.6 MB | 102.0 MB |
| Events in quadrant A | 3,414,497 | 712,761 |
| Events in quadrant B | 3,025,567 | 720,703 |
| Events in quadrant C | 3,007,925 | 706,342 |
| Events in quadrant D | 3,691,548 | 679,023 |
| Mode M0 | |||
|---|---|---|---|
| Quadrant | BADHDUFLAG | Total packets | Discarded packets |
| A | 0 | 13937 | 2 |
| B | 0 | 12716 | 1 |
| C | 0 | 12681 | 1 |
| D | 0 | 14934 | 1 |
| Mode SS | |||
|---|---|---|---|
| Quadrant | BADHDUFLAG | Total packets | Discarded packets |
| A | 0 | 122 | 0 |
| B | 0 | 122 | 0 |
| C | 0 | 122 | 0 |
| D | 0 | 122 | 0 |
| Mode M9 | |||
|---|---|---|---|
| Quadrant | BADHDUFLAG | Total packets | Discarded packets |
| A | 0 | 13 | 0 |
| B | 0 | 13 | 0 |
| C | 0 | 13 | 0 |
| D | 0 | 13 | 0 |
| Quadrant | Total seconds | Saturated seconds | Saturation percentage |
|---|---|---|---|
| A | 6000 | 95 | 1.583333% |
| B | 6000 | 67 | 1.116667% |
| C | 6000 | 62 | 1.033333% |
| D | 6000 | 126 | 2.100000% |
Noise dominated data is calculated using 1-second bins in cleaned event files. If a bin has >2000 counts, and if more than 50% of those come from <1% of pixels, then it is considered to be noise-dominated and hence unusable.
| Quadrant | # 1 sec bins | Bins with >0 counts | Bins with >2000 counts | High rate bins dominated by noise | Noise dominated (total time) | Noise dominated (detector-on time) | Marked lightcurve |
|---|---|---|---|---|---|---|---|
| A | 7325 | 6000 | 15 | 15 | 0.20% | 0.25% | 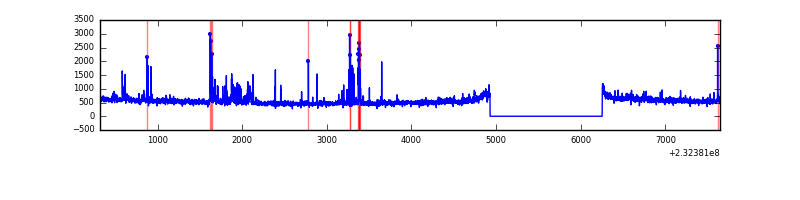 |
| B | 7325 | 6000 | 0 | 0 | 0.00% | 0.00% | 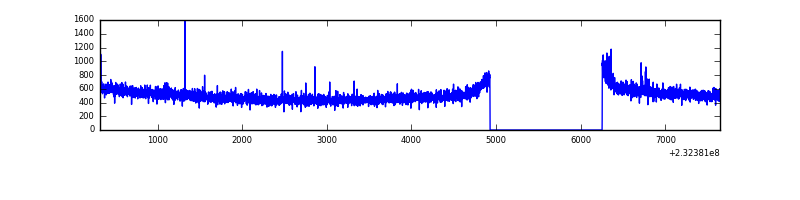 |
| C | 7325 | 6000 | 4 | 4 | 0.05% | 0.07% | 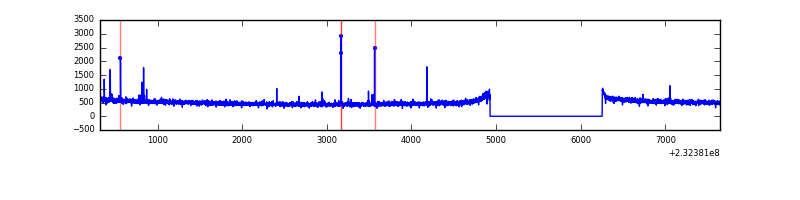 |
| D | 7325 | 6000 | 58 | 58 | 0.79% | 0.97% | 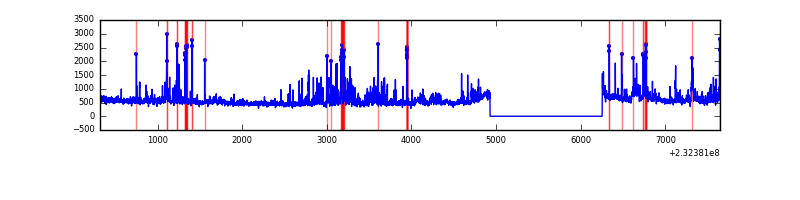 |
Top three noisy pixels from each quadrant. If the there are fewer than three noisy pixels in the level2.evt file, extra rows are filled as -1
| Pixel properties | Quadrant properties | ||||||
|---|---|---|---|---|---|---|---|
| Quadrant | DetID | PixID | Counts | Sigma | Mean | Median | Sigma |
| A | 8 | 5 | 155458 | 988.37 | 781 | 768 | 156.5 |
| A | 13 | 251 | 109650 | 695.69 | 781 | 768 | 156.5 |
| A | 15 | 223 | 93460 | 592.24 | 781 | 768 | 156.5 |
| B | 12 | 111 | 15401 | 100.94 | 775 | 758 | 145.1 |
| B | 11 | 111 | 12871 | 83.5 | 775 | 758 | 145.1 |
| B | 4 | 173 | 12711 | 82.4 | 775 | 758 | 145.1 |
| C | 1 | 16 | 18458 | 101.46 | 761 | 765 | 174.4 |
| C | 9 | 68 | 16962 | 92.88 | 761 | 765 | 174.4 |
| C | 13 | 61 | 5618 | 27.83 | 761 | 765 | 174.4 |
| D | 2 | 152 | 319464 | 1698.77 | 758 | 740 | 187.6 |
| D | 9 | 64 | 154398 | 818.98 | 758 | 740 | 187.6 |
| D | 13 | 169 | 120803 | 639.92 | 758 | 740 | 187.6 |
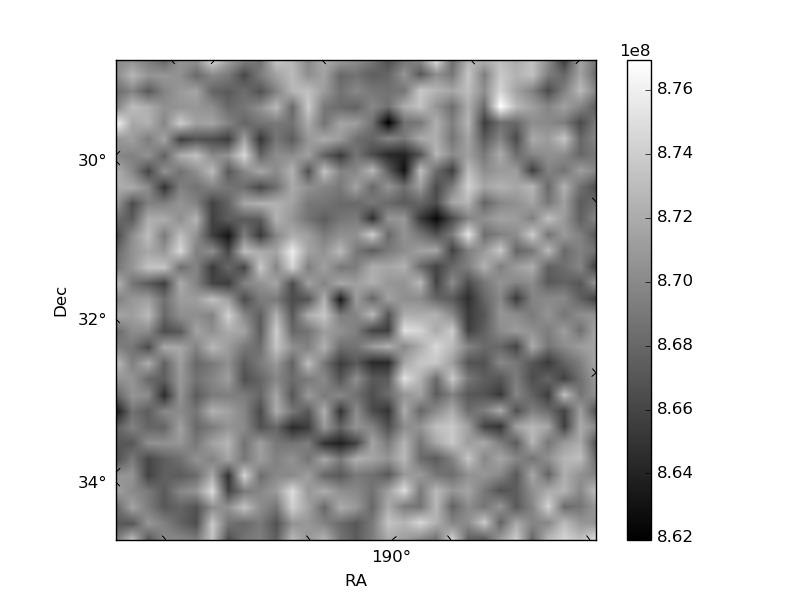
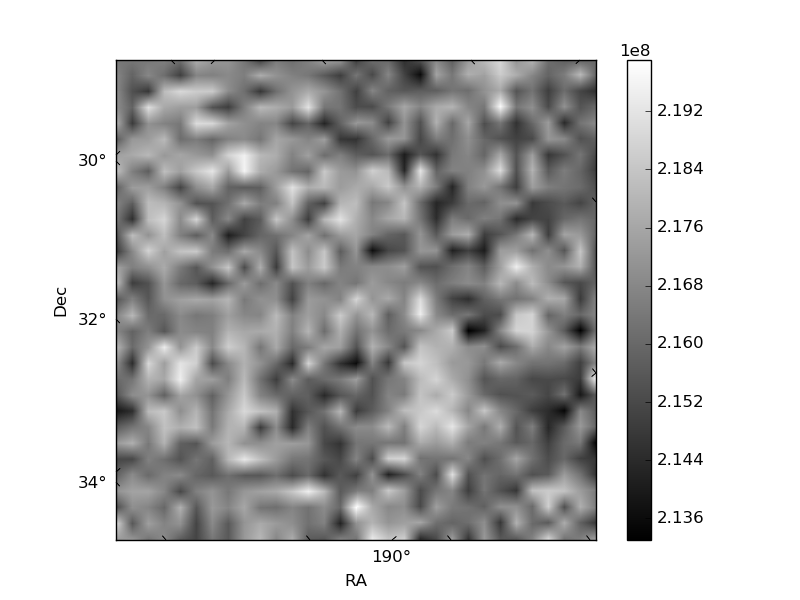
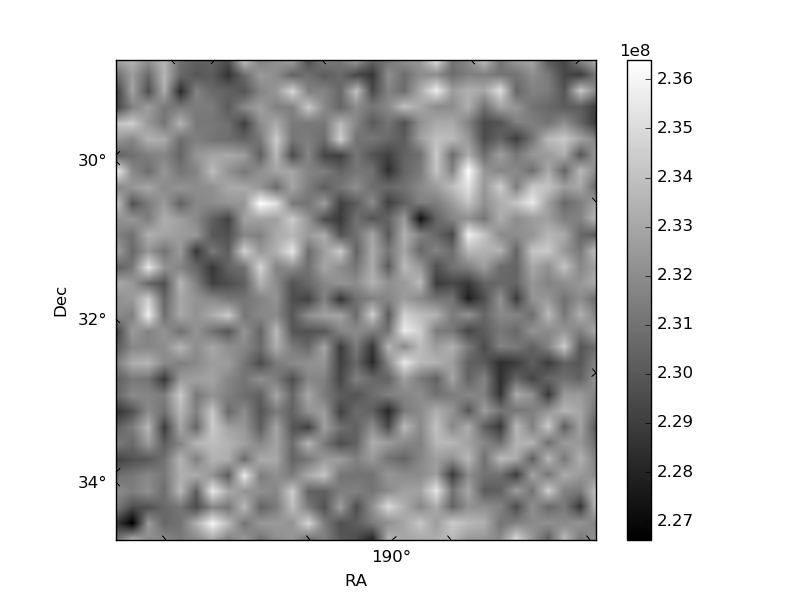
Histogram calculated using DETX and DETY for each event in the final _common_clean file
| Quadrant A | 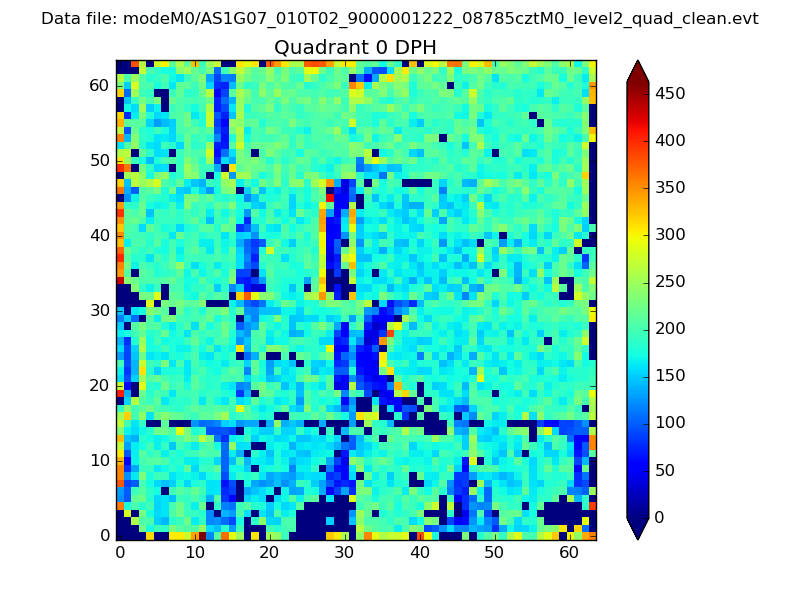 |
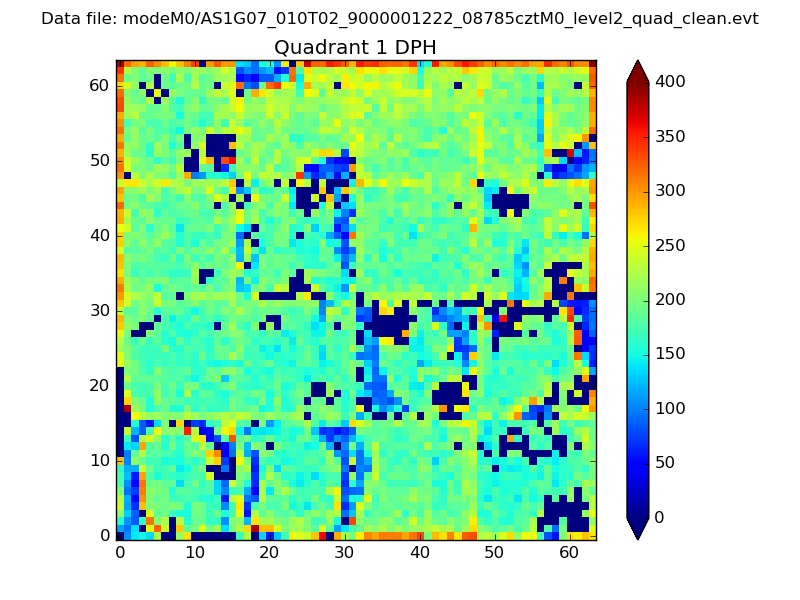 |
Quadrant B |
|---|---|---|---|
| Quadrant D | 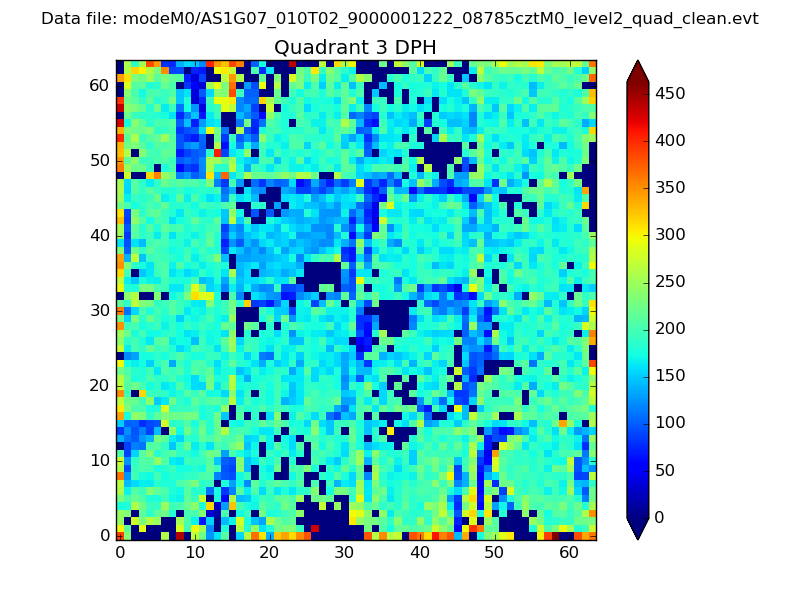 |
 |
Quadrant C |
| Plot type | Count rate plots | Images |
|---|---|---|
| Comparison with Poisson distribution Blue bars denote a histogram of data divided into 1 sec bins. Red curve is a Poisson curve with rate = median count rate of data. |
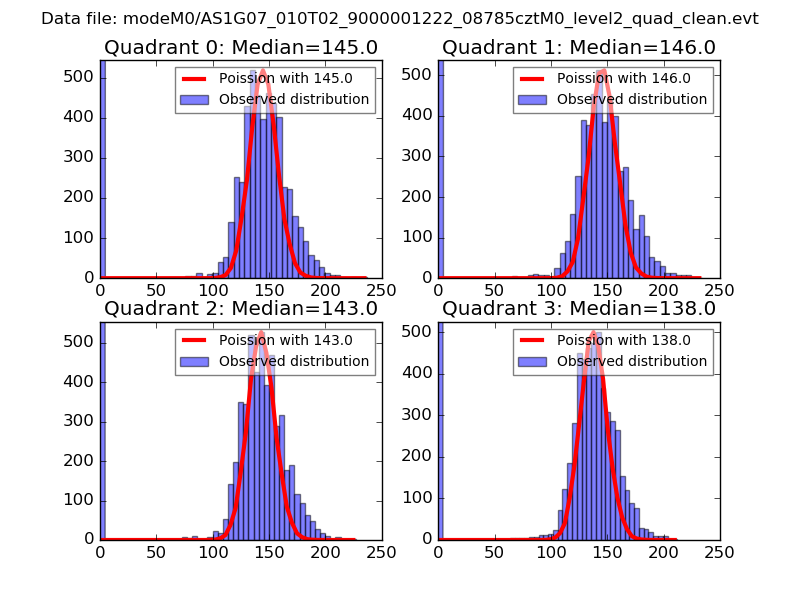 |
 |
| Quadrant-wise count rates Data is divided into 100 sec bins |
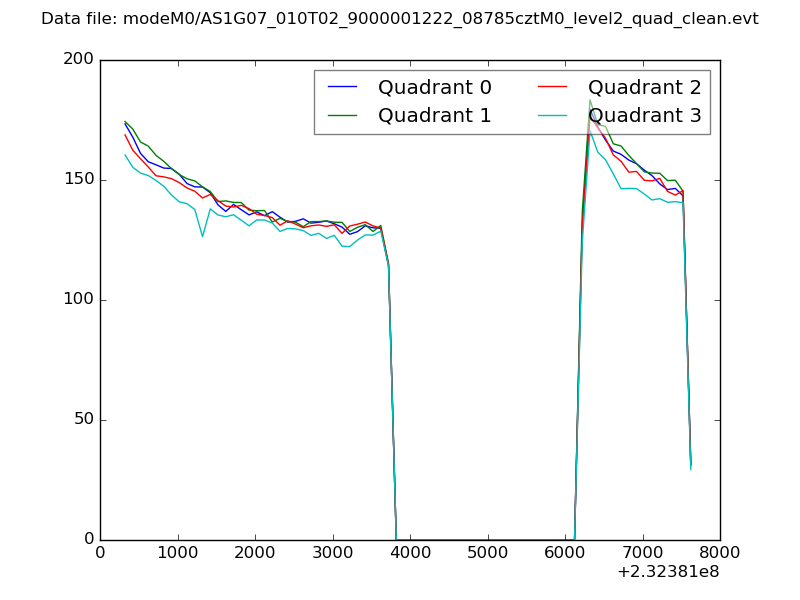 |
|
| Module-wise count rates for Quadrant A Data is divided into 100 sec bins |
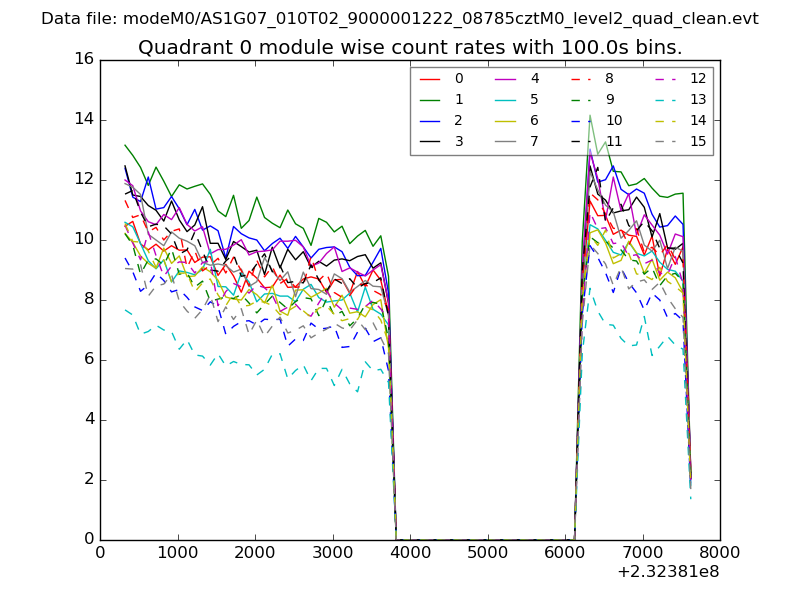 |
 |
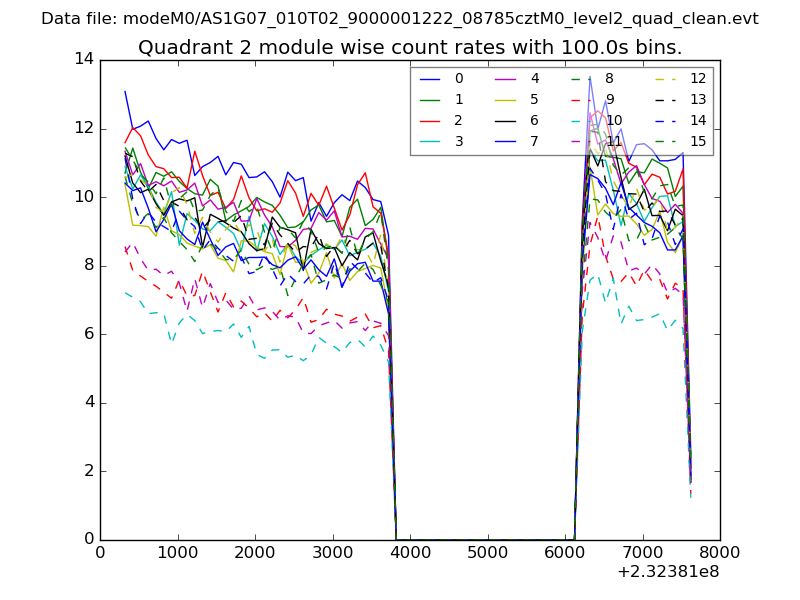
| Module-wise count rates for Quadrant B Data is divided into 100 sec bins |
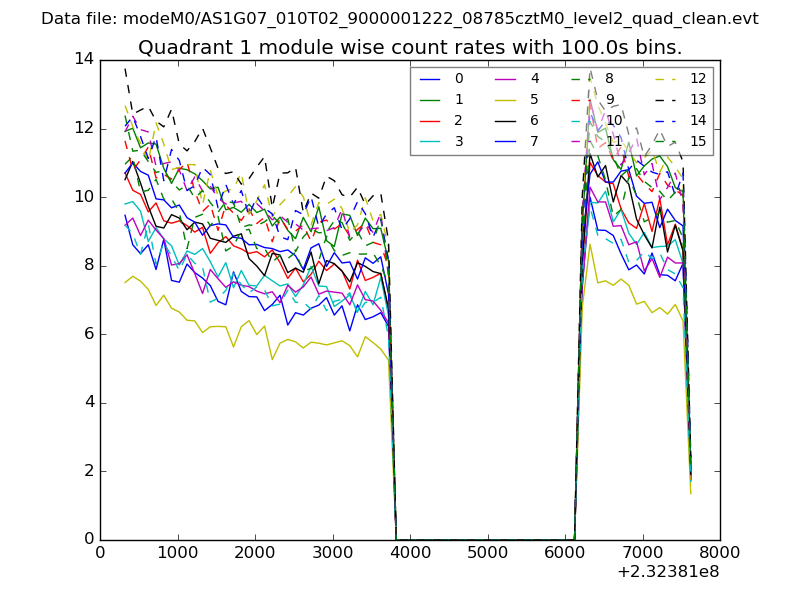 |
 |
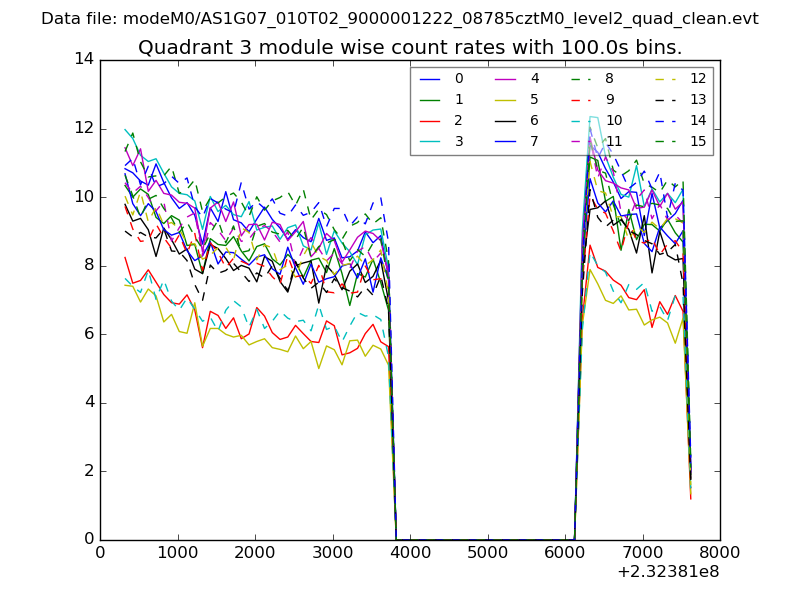
| Module-wise count rates for Quadrant C Data is divided into 100 sec bins |
 |
 |
| Module-wise count rates for Quadrant D Data is divided into 100 sec bins |
 |
 |
| Parameter | Plot |
|---|---|
| CZT HV Monitor | 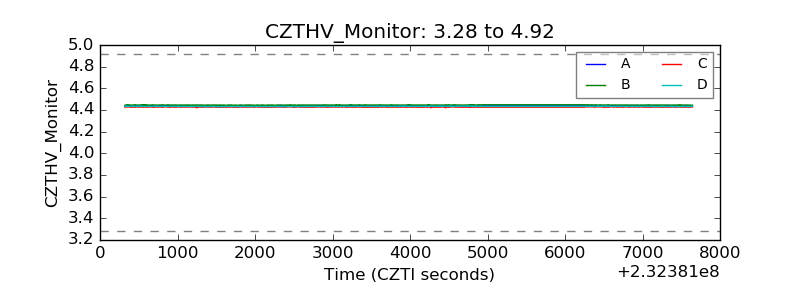 |
| D_VDD |  |
| Temperature 1 | 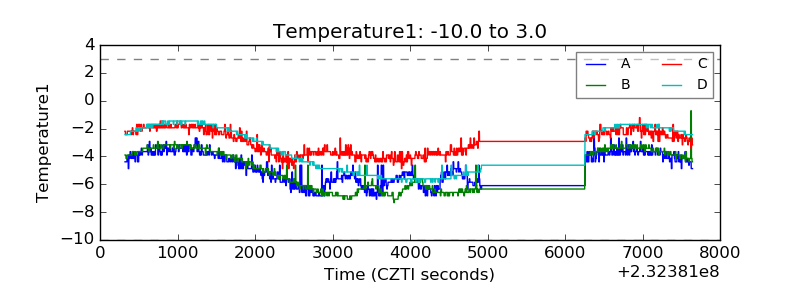 |
| Veto HV Monitor | 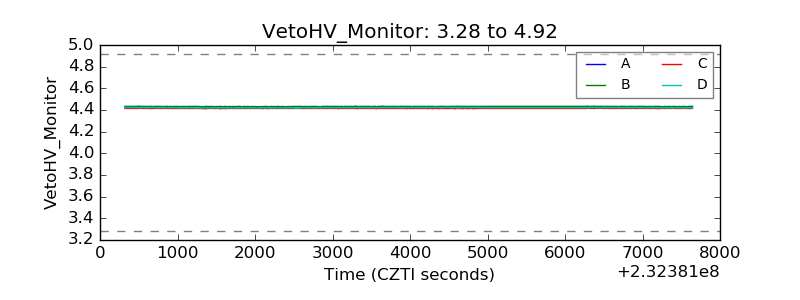 |
| Veto LLD | 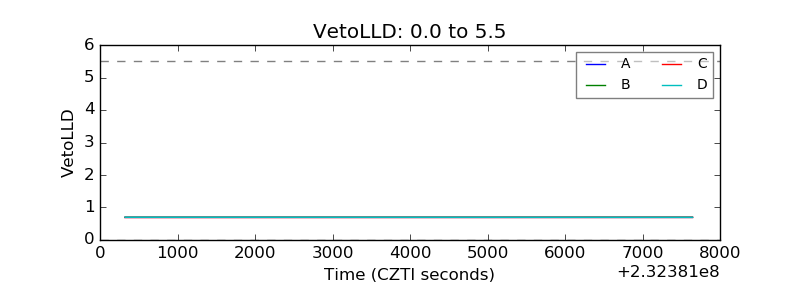 |
| Alpha Counter | 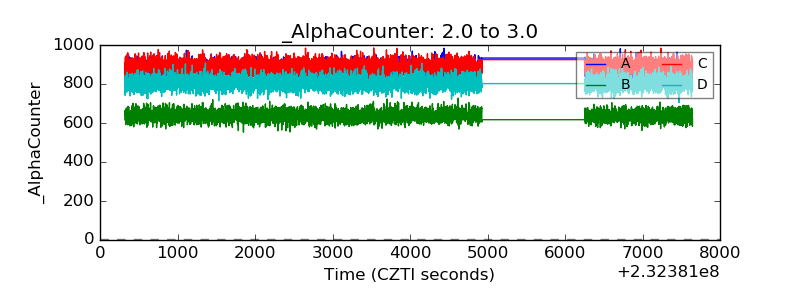 |
| _CPM_Rate | 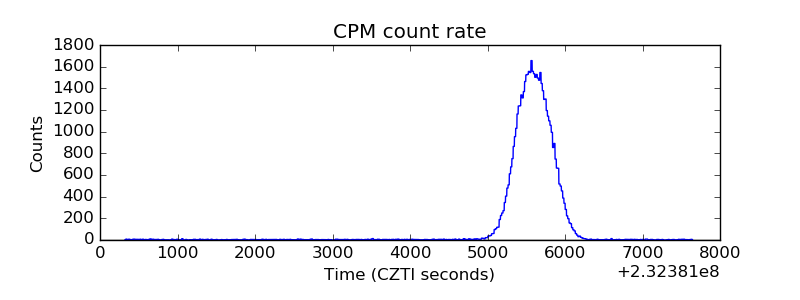 |
| CZT Counter |  |
| +2.5 Volts monitor |  |
| +5 Volts monitor |  |
| _ROLL_ROT | 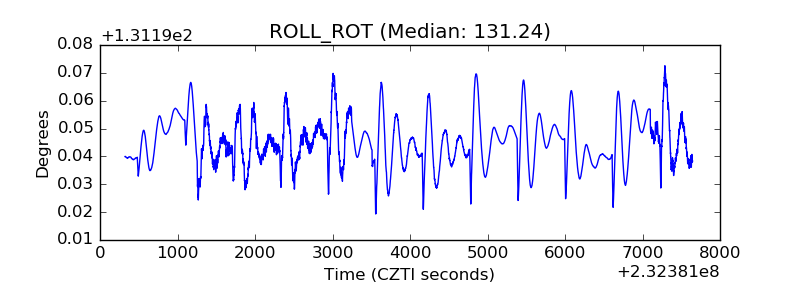 |
| _Roll_DEC | 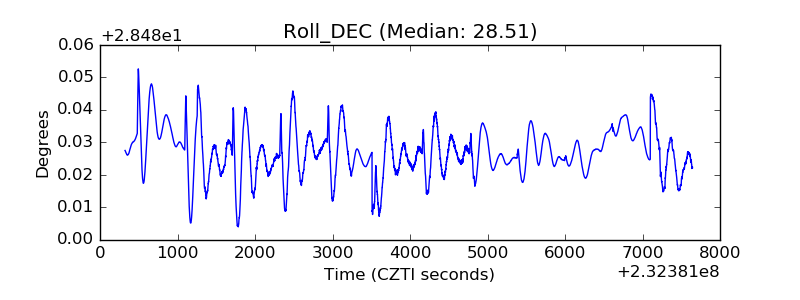 |
| _Roll_RA | 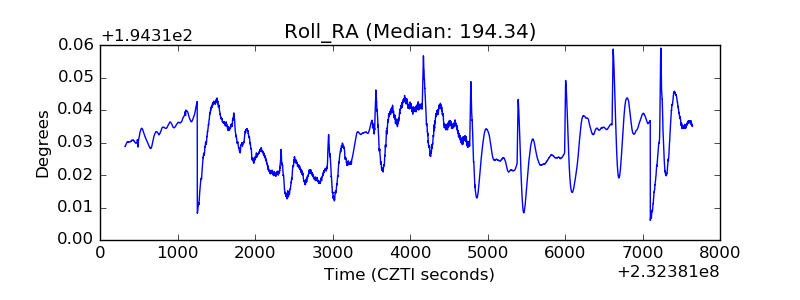 |
| Veto Counter | 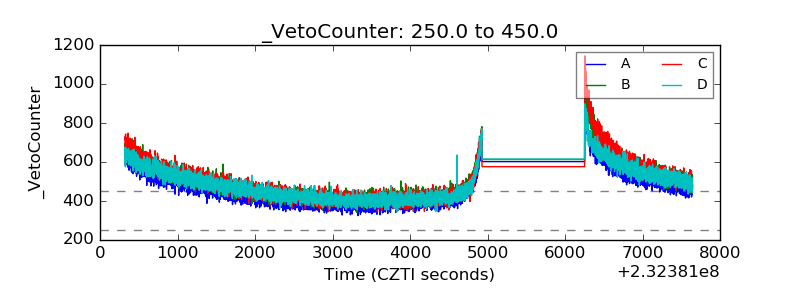 |