| Param | Original file | Final file |
|---|---|---|
| Filename | modeM0/AS1G07_010T02_9000001222_08788cztM0_level2.evt | modeM0/AS1G07_010T02_9000001222_08788cztM0_level2_quad_clean.evt |
| Size (bytes) | 139,098,240 | 29,445,120 |
| Size | 132.7 MB | 28.1 MB |
| Events in quadrant A | 760,230 | 199,203 |
| Events in quadrant B | 744,985 | 202,297 |
| Events in quadrant C | 727,328 | 199,930 |
| Events in quadrant D | 1,875,941 | 178,939 |
| Mode M0 | |||
|---|---|---|---|
| Quadrant | BADHDUFLAG | Total packets | Discarded packets |
| A | 0 | 3196 | 1 |
| B | 0 | 3147 | 1 |
| C | 0 | 3091 | 1 |
| D | 0 | 6639 | 1 |
| Mode SS | |||
|---|---|---|---|
| Quadrant | BADHDUFLAG | Total packets | Discarded packets |
| A | 0 | 30 | 0 |
| B | 0 | 30 | 0 |
| C | 0 | 30 | 0 |
| D | 0 | 30 | 0 |
| Mode M9 | |||
|---|---|---|---|
| Quadrant | BADHDUFLAG | Total packets | Discarded packets |
| A | 0 | 2 | 0 |
| B | 0 | 2 | 0 |
| C | 0 | 2 | 0 |
| D | 0 | 3 | 0 |
| Quadrant | Total seconds | Saturated seconds | Saturation percentage |
|---|---|---|---|
| A | 1495 | 6 | 0.401338% |
| B | 1495 | 9 | 0.602007% |
| C | 1495 | 2 | 0.133779% |
| D | 1495 | 225 | 15.050167% |
Noise dominated data is calculated using 1-second bins in cleaned event files. If a bin has >2000 counts, and if more than 50% of those come from <1% of pixels, then it is considered to be noise-dominated and hence unusable.
| Quadrant | # 1 sec bins | Bins with >0 counts | Bins with >2000 counts | High rate bins dominated by noise | Noise dominated (total time) | Noise dominated (detector-on time) | Marked lightcurve |
|---|---|---|---|---|---|---|---|
| A | 1495 | 1495 | 0 | 0 | 0.00% | 0.00% | 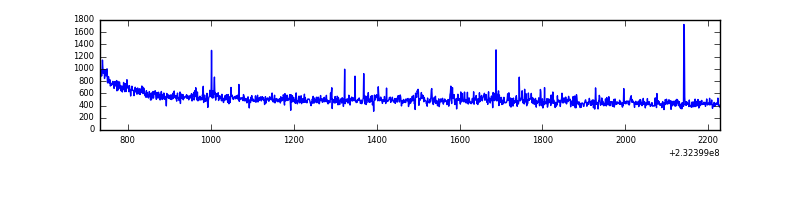 |
| B | 1495 | 1495 | 0 | 0 | 0.00% | 0.00% | 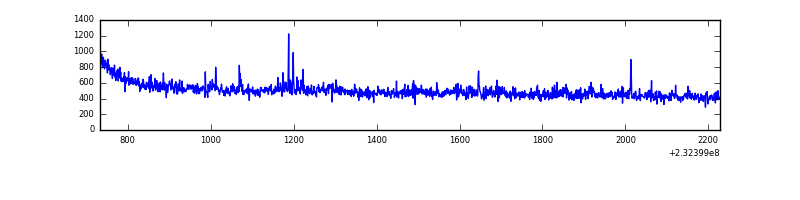 |
| C | 1495 | 1495 | 0 | 0 | 0.00% | 0.00% | 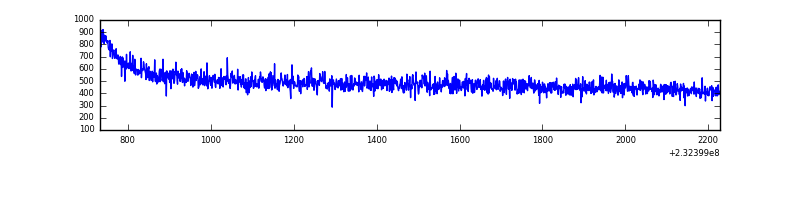 |
| D | 1494 | 1494 | 202 | 202 | 13.52% | 13.52% | 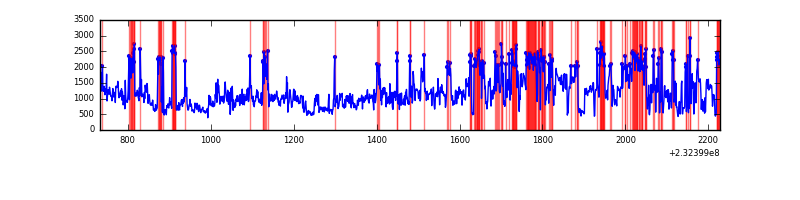 |
Top three noisy pixels from each quadrant. If the there are fewer than three noisy pixels in the level2.evt file, extra rows are filled as -1
| Pixel properties | Quadrant properties | ||||||
|---|---|---|---|---|---|---|---|
| Quadrant | DetID | PixID | Counts | Sigma | Mean | Median | Sigma |
| A | 8 | 5 | 12785 | 316.47 | 187 | 183 | 39.8 |
| A | 13 | 251 | 12067 | 298.44 | 187 | 183 | 39.8 |
| A | 15 | 223 | 5213 | 126.32 | 187 | 183 | 39.8 |
| B | 4 | 173 | 14130 | 375.07 | 187 | 182 | 37.2 |
| B | 12 | 111 | 3739 | 95.65 | 187 | 182 | 37.2 |
| B | 5 | 255 | 3466 | 88.31 | 187 | 182 | 37.2 |
| C | 13 | 61 | 1322 | 25.48 | 185 | 186 | 44.6 |
| C | 14 | 234 | 1044 | 19.25 | 185 | 186 | 44.6 |
| C | 14 | 67 | 787 | 13.48 | 185 | 186 | 44.6 |
| D | 2 | 16 | 1128770 | 25580.64 | 176 | 171 | 44.1 |
| D | 7 | 71 | 27289 | 614.65 | 176 | 171 | 44.1 |
| D | 2 | 152 | 15890 | 356.28 | 176 | 171 | 44.1 |
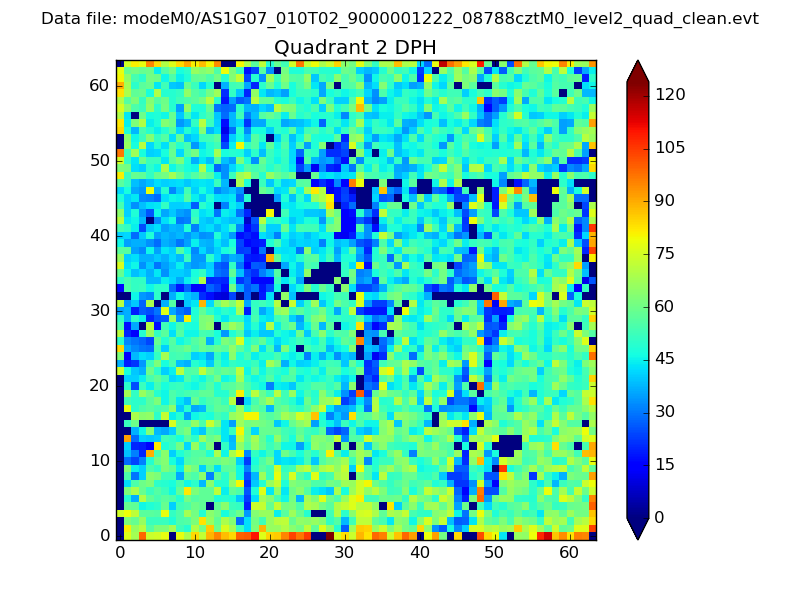
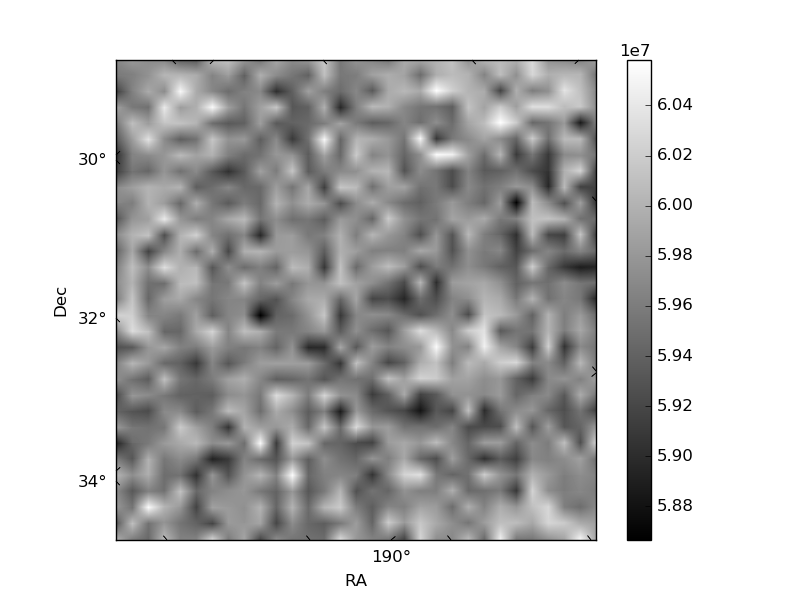
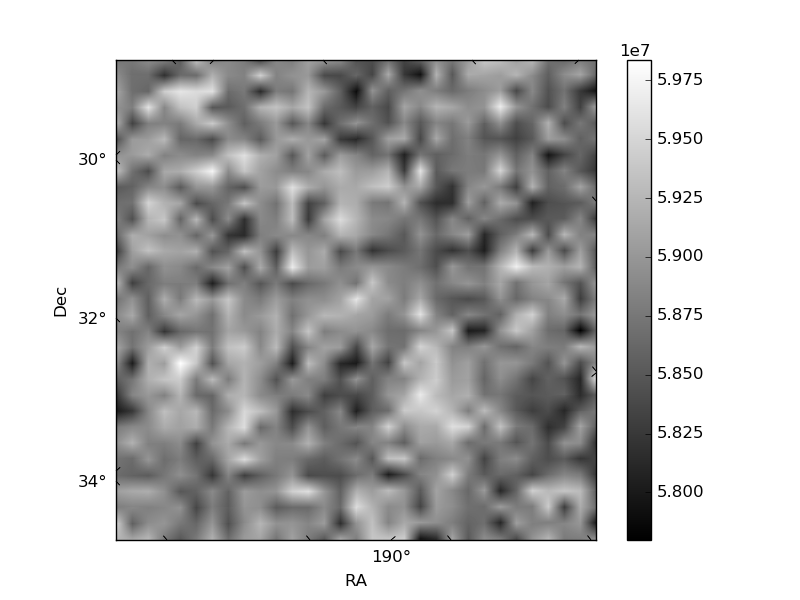
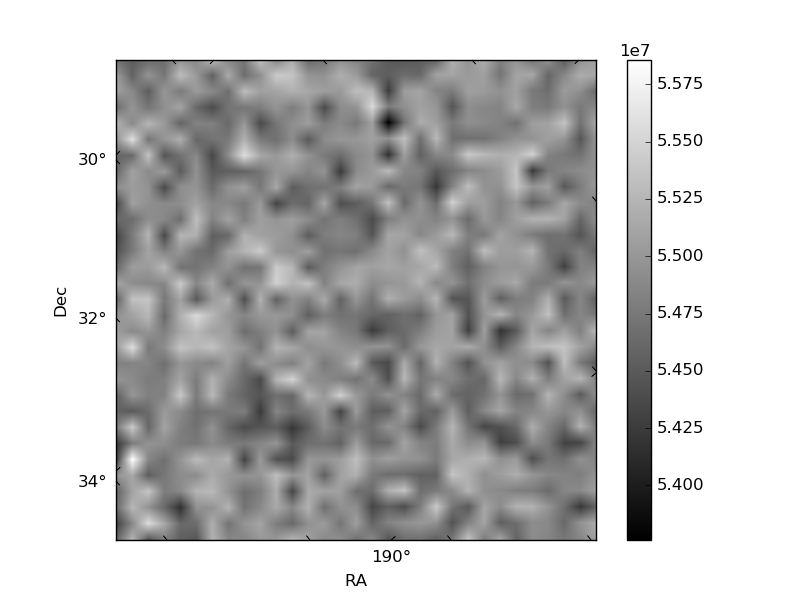
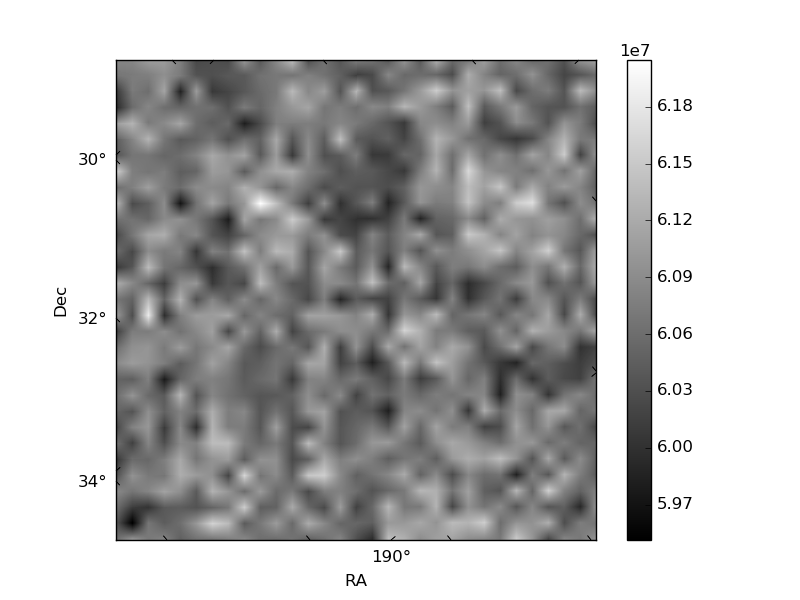
Histogram calculated using DETX and DETY for each event in the final _common_clean file
| Quadrant A | 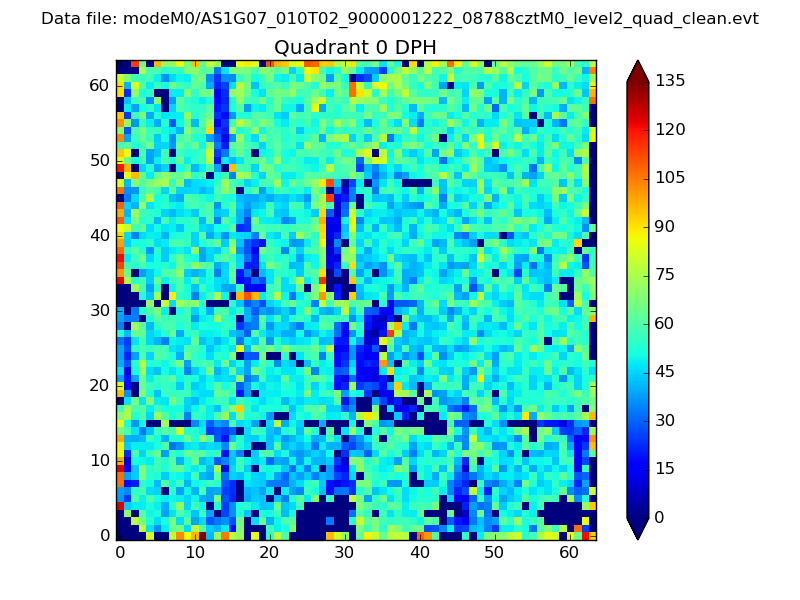 |
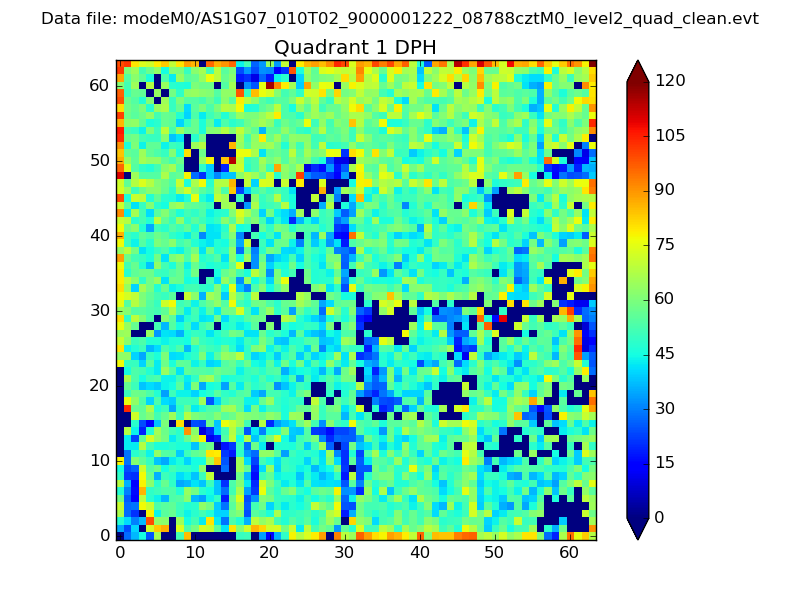 |
Quadrant B |
|---|---|---|---|
| Quadrant D | 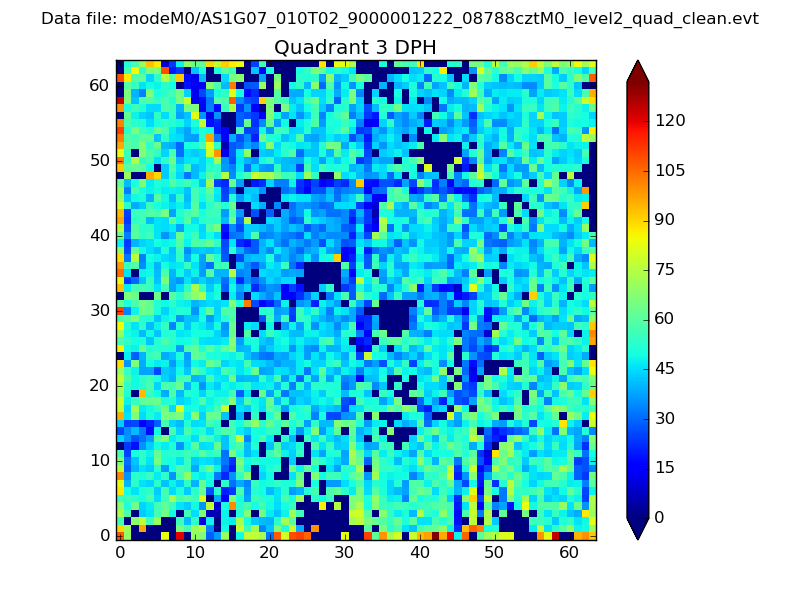 |
 |
Quadrant C |
| Plot type | Count rate plots | Images |
|---|---|---|
| Comparison with Poisson distribution Blue bars denote a histogram of data divided into 1 sec bins. Red curve is a Poisson curve with rate = median count rate of data. |
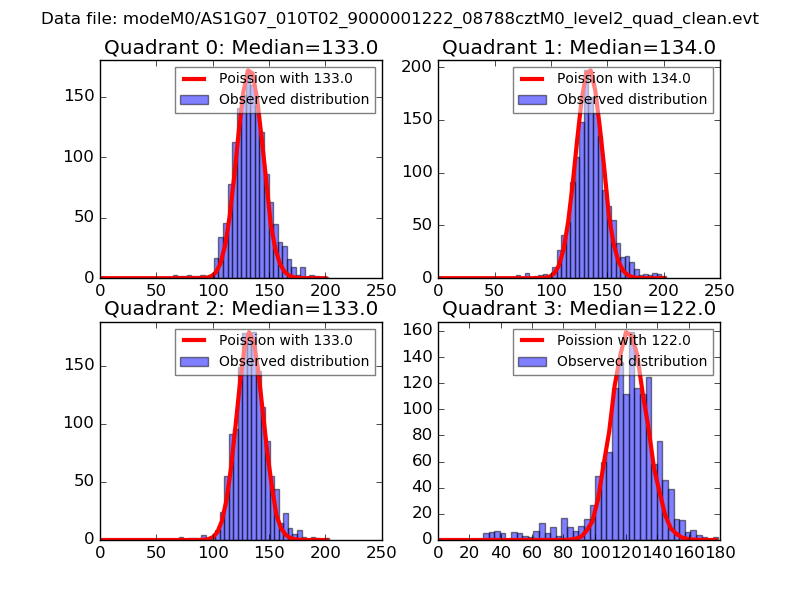 |
 |
| Quadrant-wise count rates Data is divided into 100 sec bins |
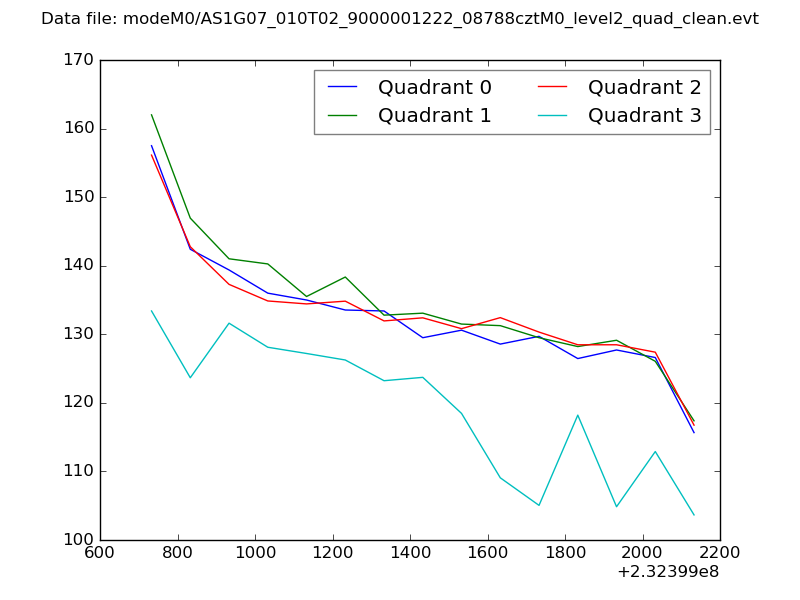 |
|
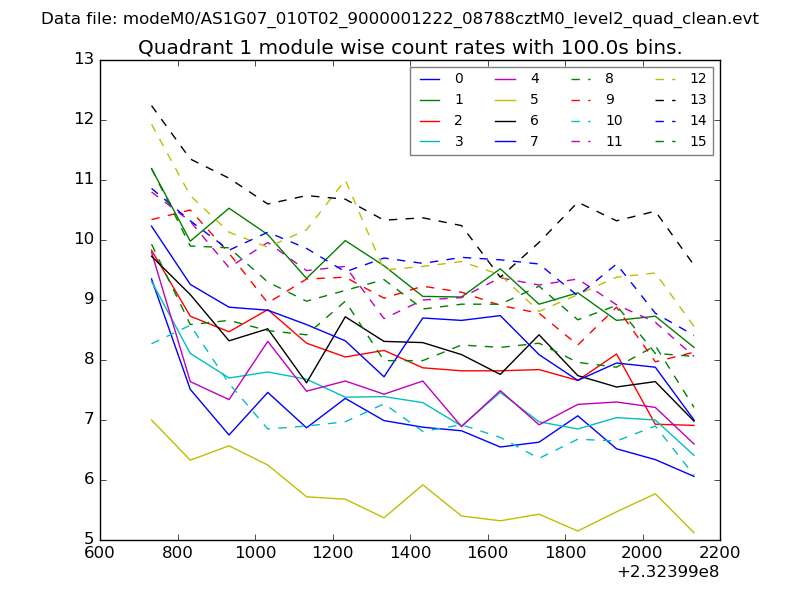
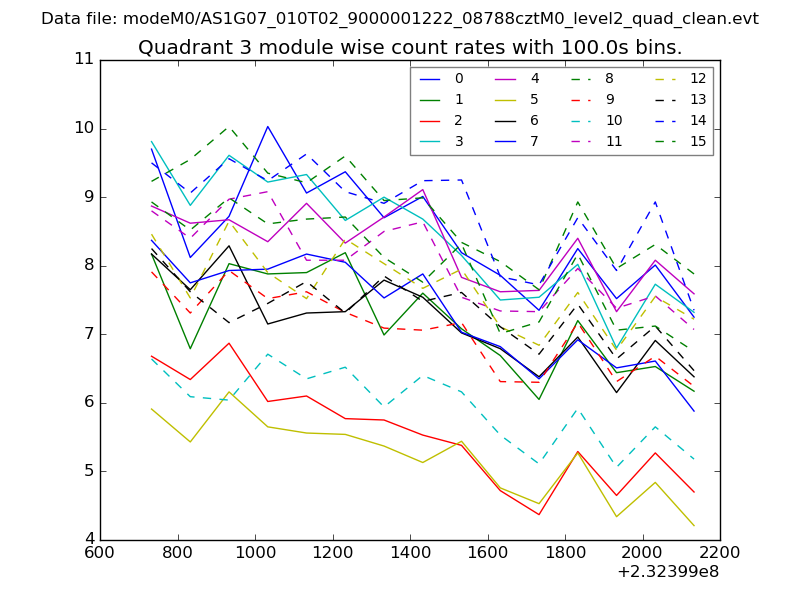
| Module-wise count rates for Quadrant A Data is divided into 100 sec bins |
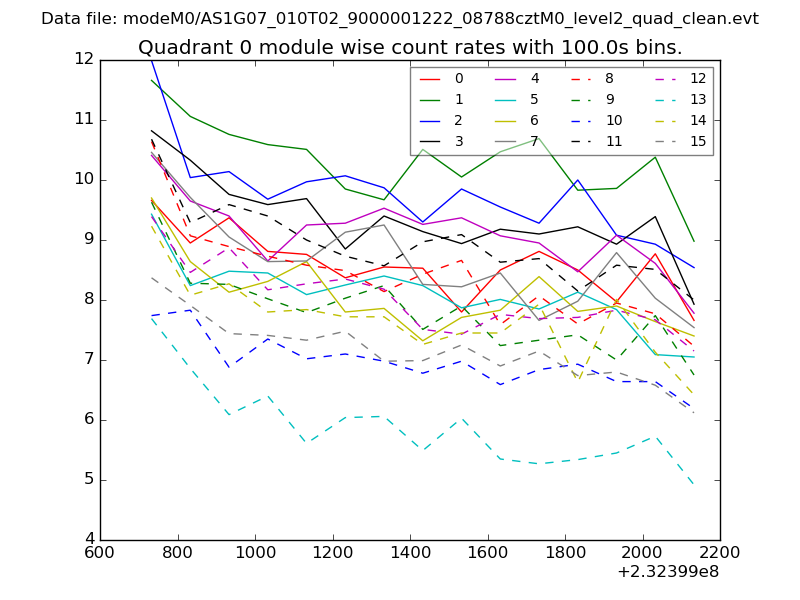 |
 |
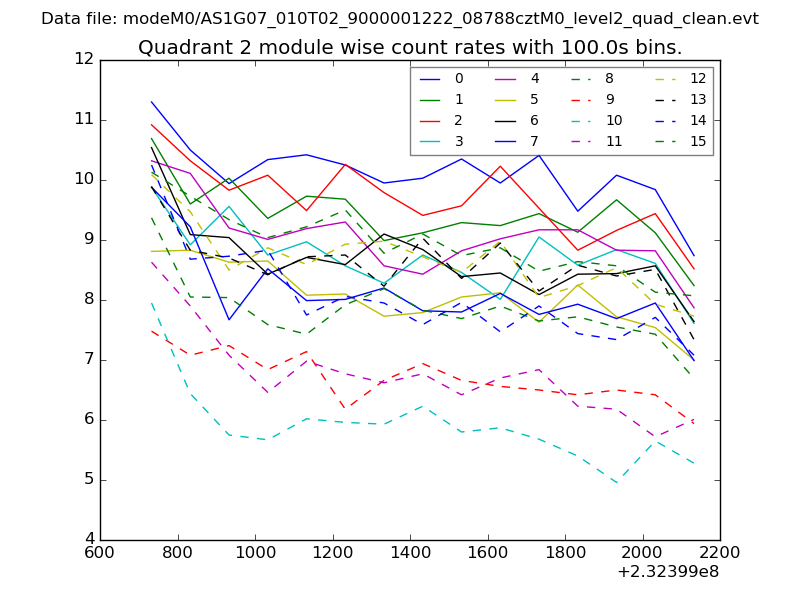
| Module-wise count rates for Quadrant B Data is divided into 100 sec bins |
 |
 |
| Module-wise count rates for Quadrant C Data is divided into 100 sec bins |
 |
 |
| Module-wise count rates for Quadrant D Data is divided into 100 sec bins |
 |
 |
| Parameter | Plot |
|---|---|
| CZT HV Monitor | 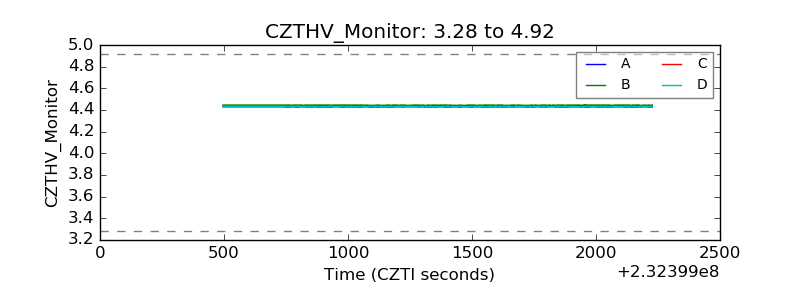 |
| D_VDD |  |
| Temperature 1 | 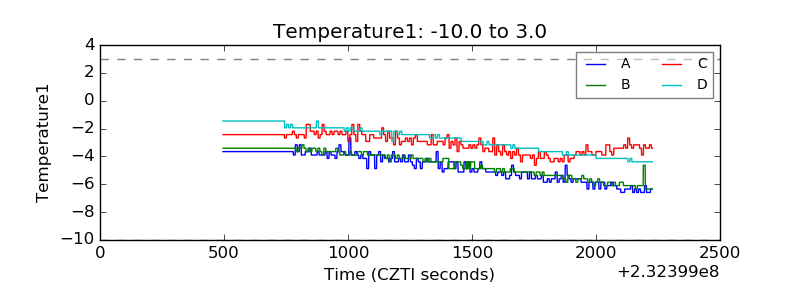 |
| Veto HV Monitor | 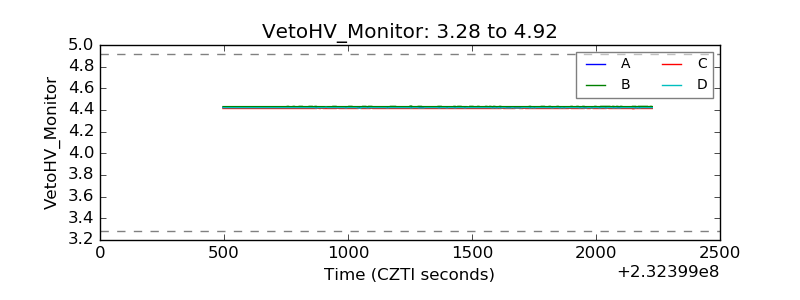 |
| Veto LLD | 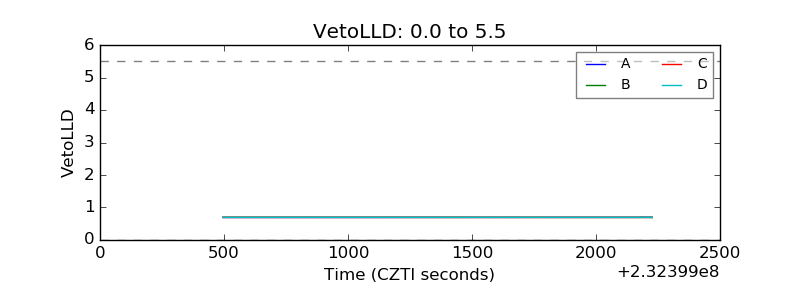 |
| Alpha Counter | 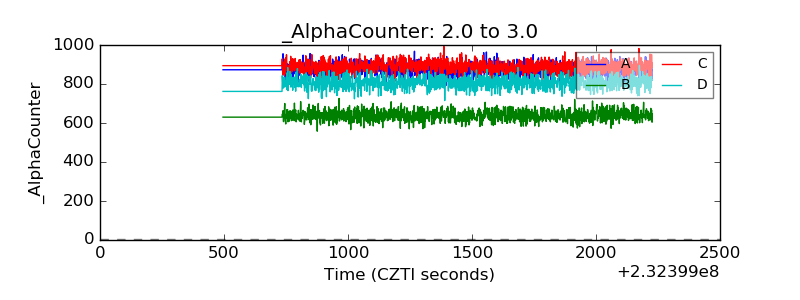 |
| _CPM_Rate | 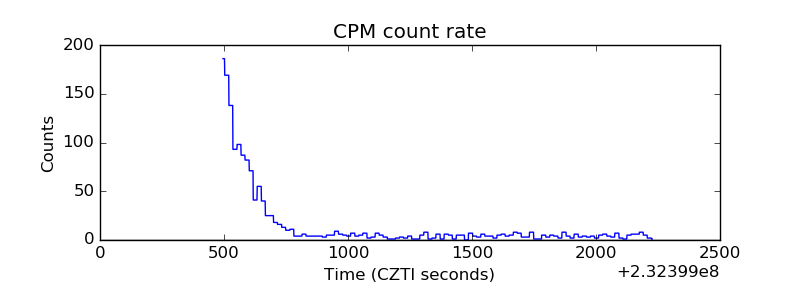 |
| CZT Counter | 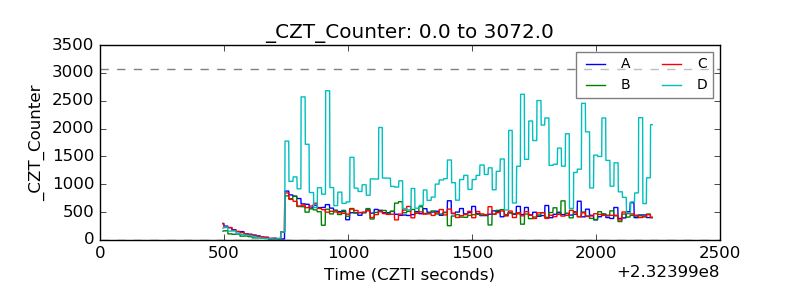 |
| +2.5 Volts monitor |  |
| +5 Volts monitor |  |
| _ROLL_ROT | 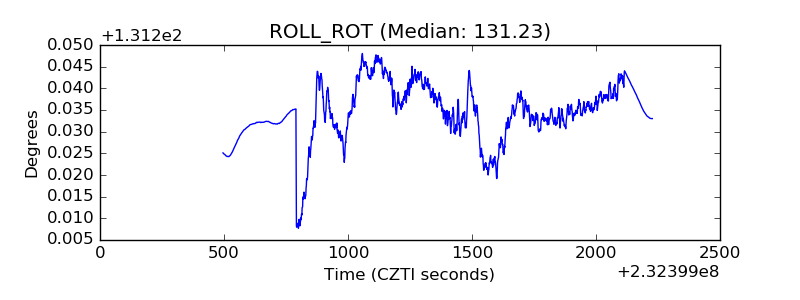 |
| _Roll_DEC | 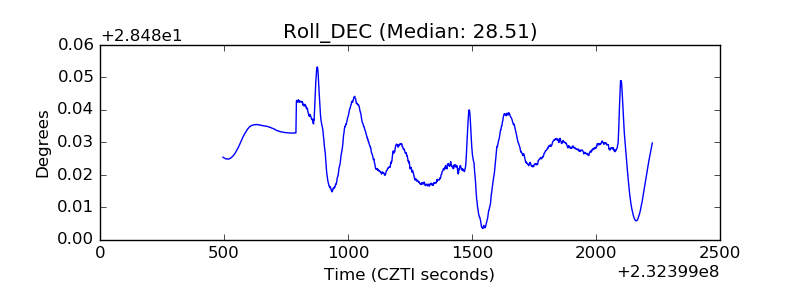 |
| _Roll_RA | 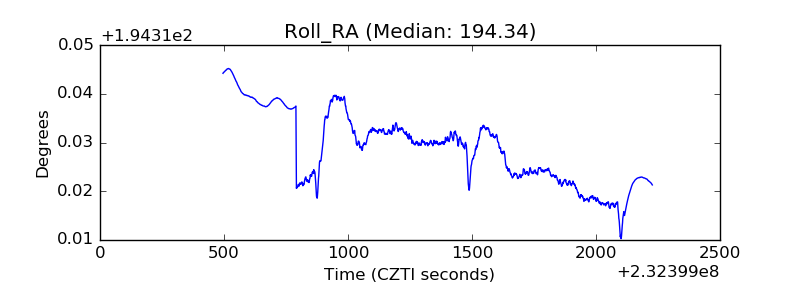 |
| Veto Counter | 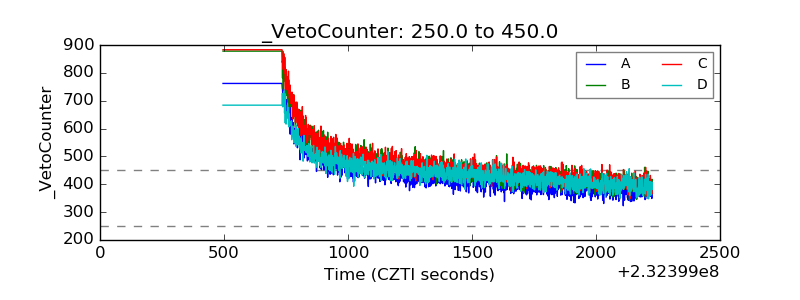 |