| Param | Original file | Final file |
|---|---|---|
| Filename | modeM0/AS1G07_010T03_9000001224cztM0_level2.fits | modeM0/AS1G07_010T03_9000001224cztM0_level2_quad_clean.evt |
| Size (bytes) | 528,744,960 | 526,150,080 |
| Size | 504.3 MB | 501.8 MB |
| Events in quadrant A | 3,203,086 | 3,239,209 |
| Events in quadrant B | 3,115,772 | 3,266,724 |
| Events in quadrant C | 3,192,950 | 3,112,782 |
| Events in quadrant D | 2,561,976 | 2,380,033 |
| Mode SS | |||
|---|---|---|---|
| Quadrant | BADHDUFLAG | Total packets | Discarded packets |
| A | 0 | 1170 | 0 |
| B | 0 | 1178 | 0 |
| C | 0 | 1176 | 0 |
| D | 0 | 1170 | 0 |
| Mode M0 | |||
|---|---|---|---|
| Quadrant | BADHDUFLAG | Total packets | Discarded packets |
| A | 0 | 129848 | 0 |
| B | 0 | 119180 | 0 |
| C | 0 | 117698 | 0 |
| D | 0 | 205416 | 0 |
| Mode M9 | |||
|---|---|---|---|
| Quadrant | BADHDUFLAG | Total packets | Discarded packets |
| A | 0 | 69 | 0 |
| B | 0 | 69 | 0 |
| C | 0 | 69 | 0 |
| D | 0 | 69 | 0 |
| Quadrant | Total seconds | Saturated seconds | Saturation percentage |
|---|---|---|---|
| A | 57385 | 1264 | 2.202666% |
| B | 57414 | 614 | 1.069426% |
| C | 57413 | 322 | 0.560849% |
| D | 57170 | 7966 | 13.933881% |
Noise dominated data is calculated using 1-second bins in cleaned event files. If a bin has >2000 counts, and if more than 50% of those come from <1% of pixels, then it is considered to be noise-dominated and hence unusable.
| Quadrant | # 1 sec bins | Bins with >0 counts | Bins with >2000 counts | High rate bins dominated by noise | Noise dominated (total time) | Noise dominated (detector-on time) | Marked lightcurve |
|---|---|---|---|---|---|---|---|
| A | 64743 | 57580 | 0 | 0 | 0.00% | 0.00% |  |
| B | 64743 | 57646 | 0 | 0 | 0.00% | 0.00% |  |
| C | 64743 | 57645 | 0 | 0 | 0.00% | 0.00% |  |
| D | 64742 | 57421 | 0 | 0 | 0.00% | 0.00% |  |
Top three noisy pixels from each quadrant. If the there are fewer than three noisy pixels in the level2.evt file, extra rows are filled as -1
| Pixel properties | Quadrant properties | ||||||
|---|---|---|---|---|---|---|---|
| Quadrant | DetID | PixID | Counts | Sigma | Mean | Median | Sigma |
| A | 0 | 29 | 3116 | 11.14 | 832 | 776 | 210.0 |
| A | 7 | 110 | 2521 | 8.31 | 832 | 776 | 210.0 |
| A | 9 | 19 | 2365 | 7.57 | 832 | 776 | 210.0 |
| B | 2 | 9 | 2729 | 11.96 | 819 | 778 | 163.1 |
| B | 14 | 254 | 2177 | 8.57 | 819 | 778 | 163.1 |
| B | 2 | 8 | 2125 | 8.26 | 819 | 778 | 163.1 |
| C | 12 | 241 | 2313 | 6.84 | 843 | 782 | 224.0 |
| C | 1 | 81 | 2274 | 6.66 | 843 | 782 | 224.0 |
| C | 1 | 80 | 2270 | 6.64 | 843 | 782 | 224.0 |
| D | 1 | 19 | 1851 | 6.04 | 731 | 664 | 196.7 |
| D | 6 | 231 | 1840 | 5.98 | 731 | 664 | 196.7 |
| D | 3 | 14 | 1812 | 5.84 | 731 | 664 | 196.7 |
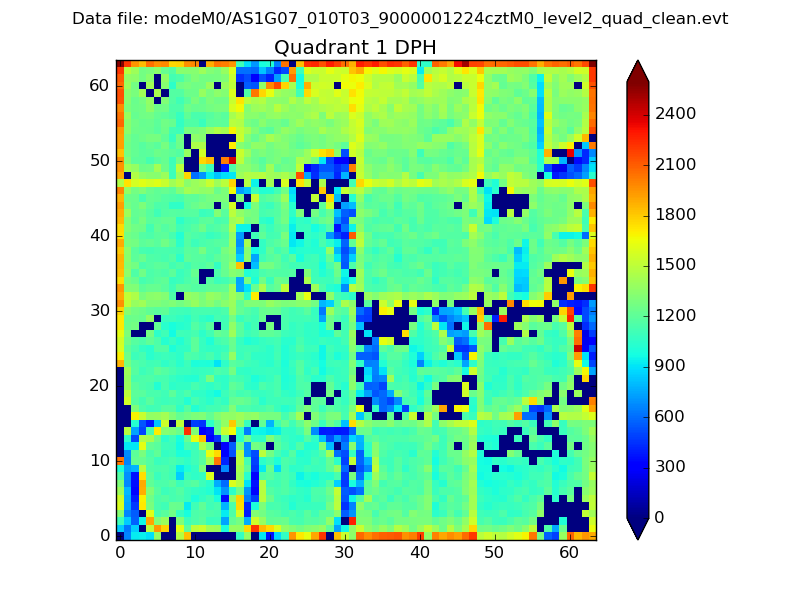
Histogram calculated using DETX and DETY for each event in the final _common_clean file
| Quadrant A |  |
 |
Quadrant B |
|---|---|---|---|
| Quadrant D |  |
 |
Quadrant C |
| Plot type | Count rate plots | Images |
|---|---|---|
| Comparison with Poisson distribution Blue bars denote a histogram of data divided into 1 sec bins. Red curve is a Poisson curve with rate = median count rate of data. |
 |
 |
| Quadrant-wise count rates Data is divided into 100 sec bins |
 |
|
| Module-wise count rates for Quadrant A Data is divided into 100 sec bins |
 |
 |
| Module-wise count rates for Quadrant B Data is divided into 100 sec bins |
 |
 |
| Module-wise count rates for Quadrant C Data is divided into 100 sec bins |
 |
 |
| Module-wise count rates for Quadrant D Data is divided into 100 sec bins |
 |
 |
| Parameter | Plot |
|---|---|
| CZT HV Monitor |  |
| D_VDD |  |
| Temperature 1 |  |
| Veto HV Monitor |  |
| Veto LLD | 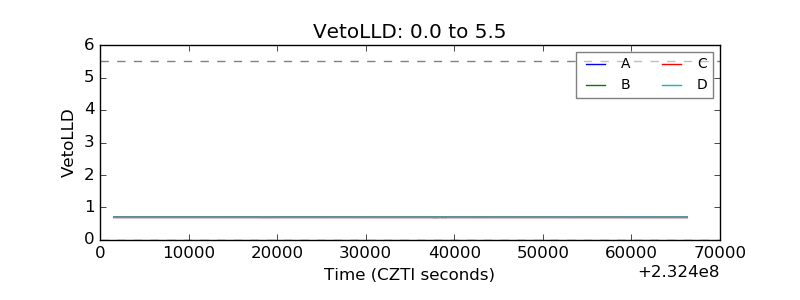 |
| Alpha Counter |  |
| _CPM_Rate |  |
| CZT Counter |  |
| +2.5 Volts monitor |  |
| +5 Volts monitor |  |
| _ROLL_ROT |  |
| _Roll_DEC |  |
| _Roll_RA |  |
| Veto Counter |  |