| Param | Original file | Final file |
|---|---|---|
| Filename | modeM0/AS1G07_010T03_9000001224_08788cztM0_level2.evt | modeM0/AS1G07_010T03_9000001224_08788cztM0_level2_quad_clean.evt |
| Size (bytes) | 400,432,320 | 52,407,360 |
| Size | 381.9 MB | 50.0 MB |
| Events in quadrant A | 3,137,250 | 316,748 |
| Events in quadrant B | 2,260,078 | 323,706 |
| Events in quadrant C | 2,180,462 | 318,569 |
| Events in quadrant D | 4,225,896 | 293,352 |
| Mode SS | |||
|---|---|---|---|
| Quadrant | BADHDUFLAG | Total packets | Discarded packets |
| A | 0 | 98 | 0 |
| B | 0 | 98 | 0 |
| C | 0 | 98 | 0 |
| D | 0 | 98 | 0 |
| Mode M0 | |||
|---|---|---|---|
| Quadrant | BADHDUFLAG | Total packets | Discarded packets |
| A | 0 | 12448 | 2 |
| B | 0 | 9947 | 1 |
| C | 0 | 9798 | 1 |
| D | 0 | 16051 | 3 |
| Mode M9 | |||
|---|---|---|---|
| Quadrant | BADHDUFLAG | Total packets | Discarded packets |
| A | 0 | 10 | 0 |
| B | 0 | 10 | 0 |
| C | 0 | 10 | 0 |
| D | 0 | 10 | 0 |
| Quadrant | Total seconds | Saturated seconds | Saturation percentage |
|---|---|---|---|
| A | 4761 | 380 | 7.981516% |
| B | 4761 | 51 | 1.071204% |
| C | 4761 | 18 | 0.378072% |
| D | 4760 | 293 | 6.155462% |
Noise dominated data is calculated using 1-second bins in cleaned event files. If a bin has >2000 counts, and if more than 50% of those come from <1% of pixels, then it is considered to be noise-dominated and hence unusable.
| Quadrant | # 1 sec bins | Bins with >0 counts | Bins with >2000 counts | High rate bins dominated by noise | Noise dominated (total time) | Noise dominated (detector-on time) | Marked lightcurve |
|---|---|---|---|---|---|---|---|
| A | 5656 | 4762 | 317 | 317 | 5.60% | 6.66% | 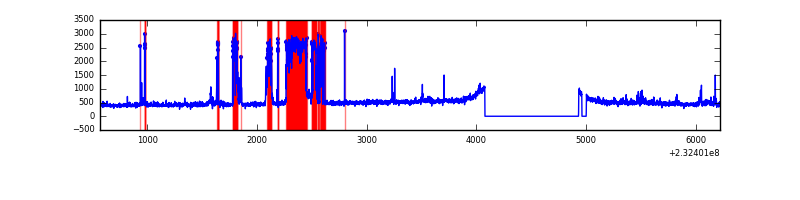 |
| B | 5656 | 4762 | 1 | 1 | 0.02% | 0.02% | 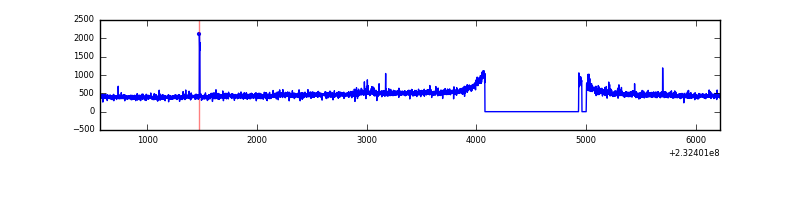 |
| C | 5656 | 4763 | 0 | 0 | 0.00% | 0.00% | 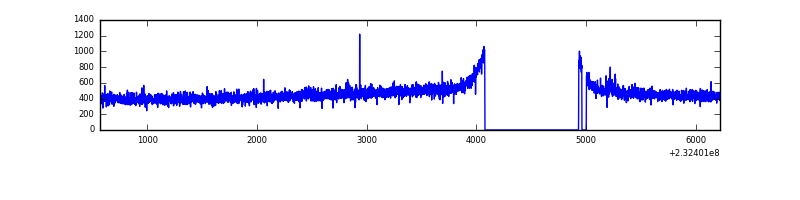 |
| D | 5656 | 4762 | 240 | 240 | 4.24% | 5.04% | 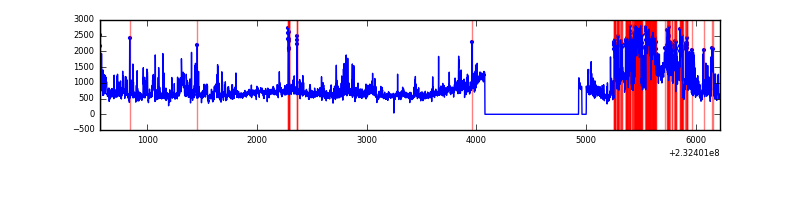 |
Top three noisy pixels from each quadrant. If the there are fewer than three noisy pixels in the level2.evt file, extra rows are filled as -1
| Pixel properties | Quadrant properties | ||||||
|---|---|---|---|---|---|---|---|
| Quadrant | DetID | PixID | Counts | Sigma | Mean | Median | Sigma |
| A | 15 | 223 | 637040 | 5636.4 | 548 | 533 | 112.9 |
| A | 15 | 239 | 258874 | 2287.66 | 548 | 533 | 112.9 |
| A | 8 | 5 | 84813 | 746.31 | 548 | 533 | 112.9 |
| B | 4 | 173 | 28026 | 249.23 | 571 | 558 | 110.2 |
| B | 12 | 111 | 12673 | 109.93 | 571 | 558 | 110.2 |
| B | 11 | 111 | 10086 | 86.45 | 571 | 558 | 110.2 |
| C | 14 | 67 | 11166 | 81.32 | 554 | 557 | 130.5 |
| C | 13 | 61 | 4252 | 28.32 | 554 | 557 | 130.5 |
| C | 9 | 68 | 3929 | 25.85 | 554 | 557 | 130.5 |
| D | 2 | 16 | 2008011 | 14981.79 | 538 | 525 | 134.0 |
| D | 2 | 152 | 81254 | 602.48 | 538 | 525 | 134.0 |
| D | 1 | 52 | 55902 | 413.28 | 538 | 525 | 134.0 |
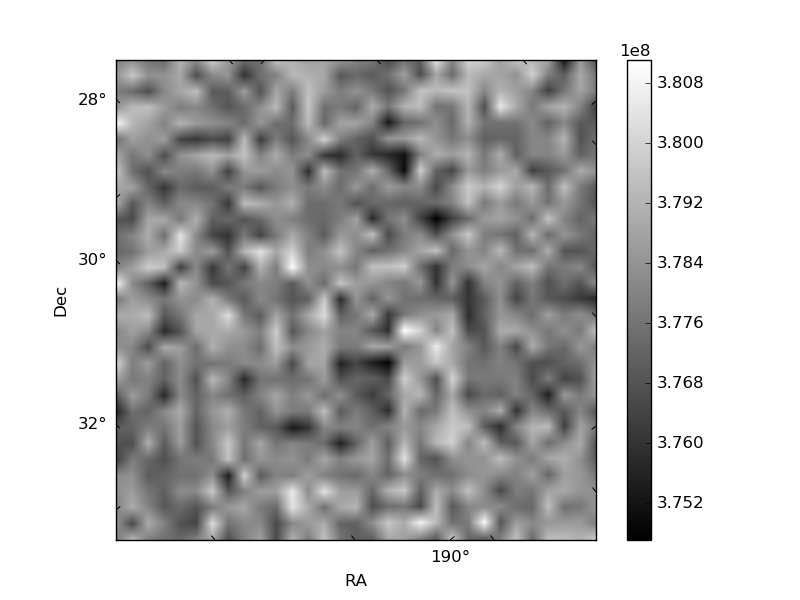
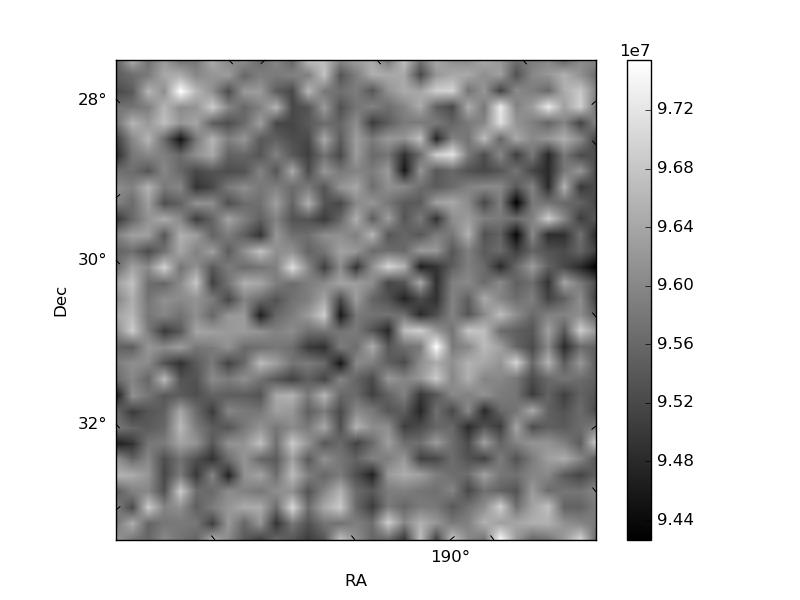
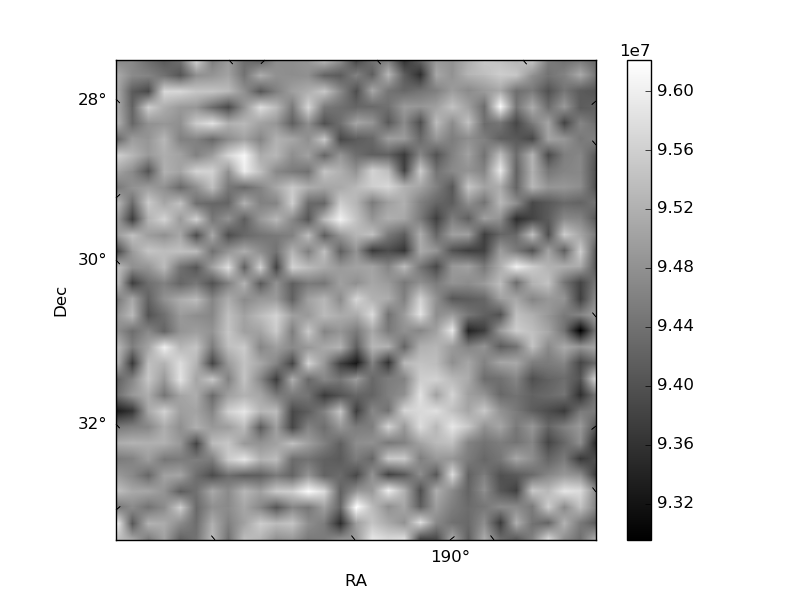
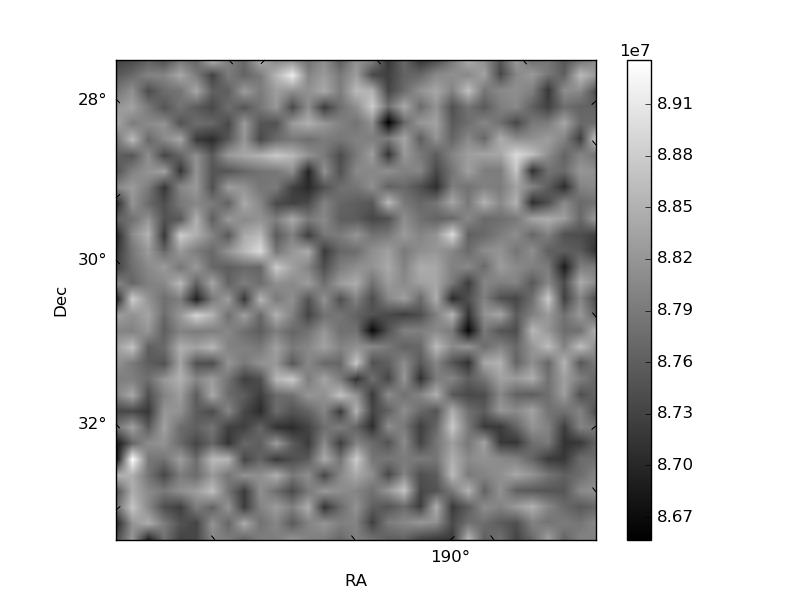
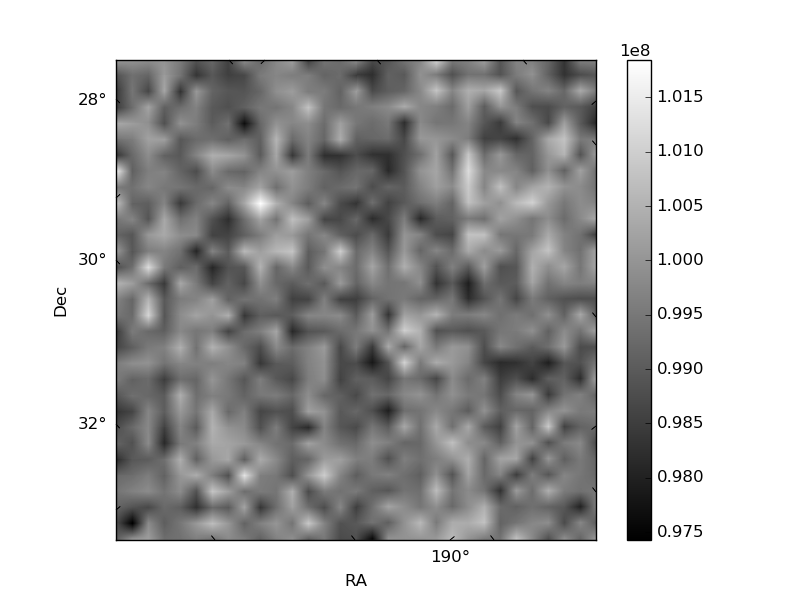
Histogram calculated using DETX and DETY for each event in the final _common_clean file
| Quadrant A | 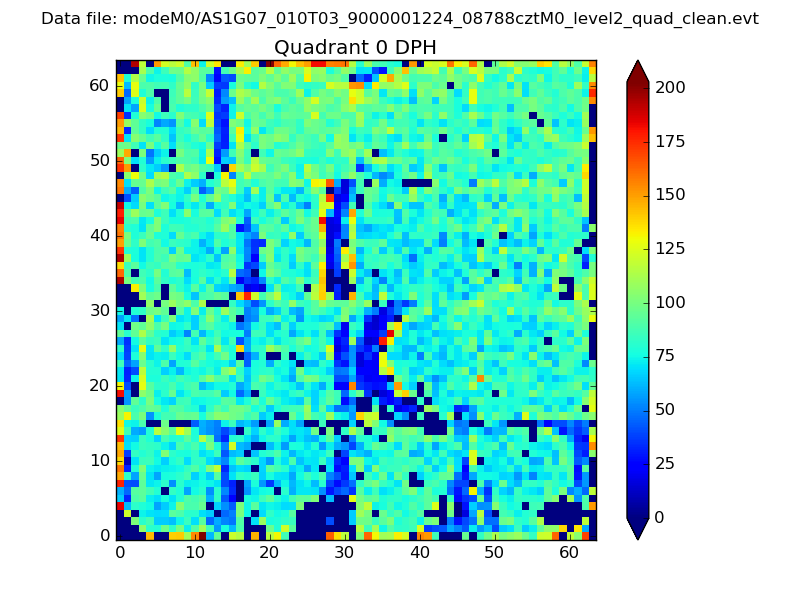 |
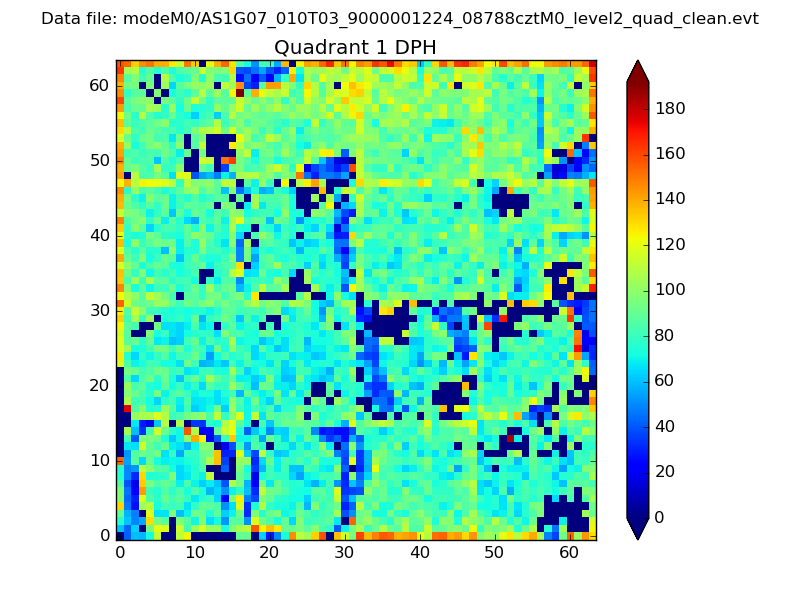 |
Quadrant B |
|---|---|---|---|
| Quadrant D | 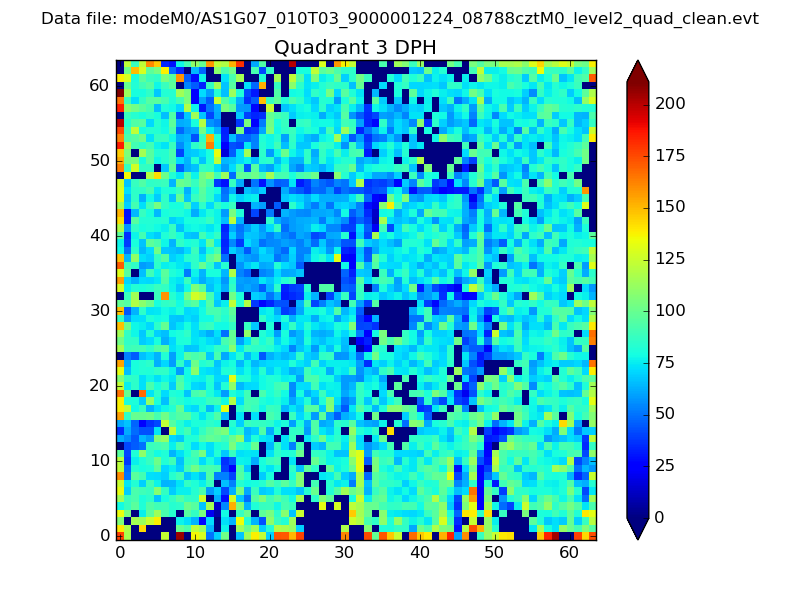 |
 |
Quadrant C |
| Plot type | Count rate plots | Images |
|---|---|---|
| Comparison with Poisson distribution Blue bars denote a histogram of data divided into 1 sec bins. Red curve is a Poisson curve with rate = median count rate of data. |
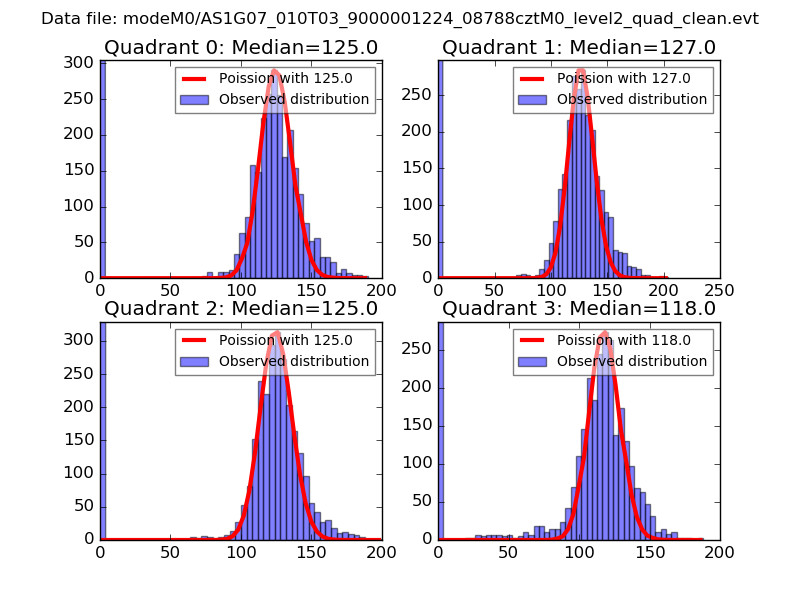 |
 |
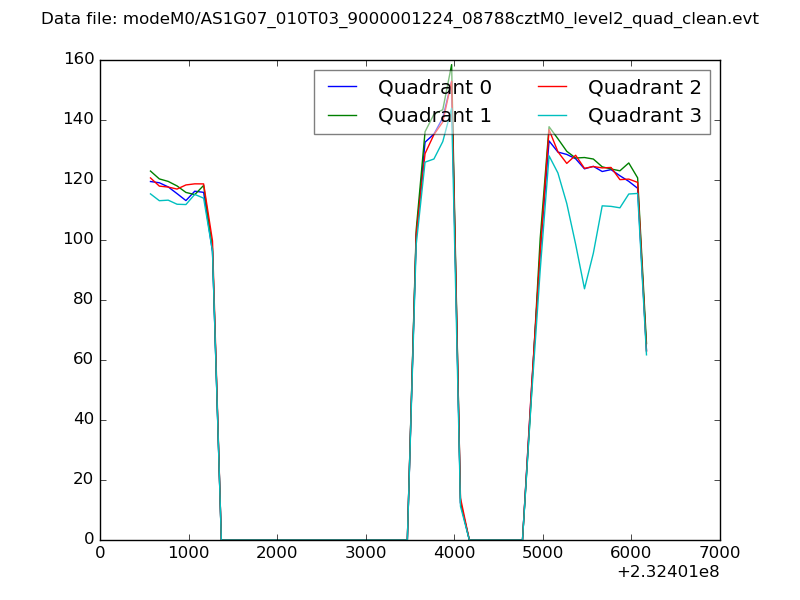
| Quadrant-wise count rates Data is divided into 100 sec bins |
 |
|
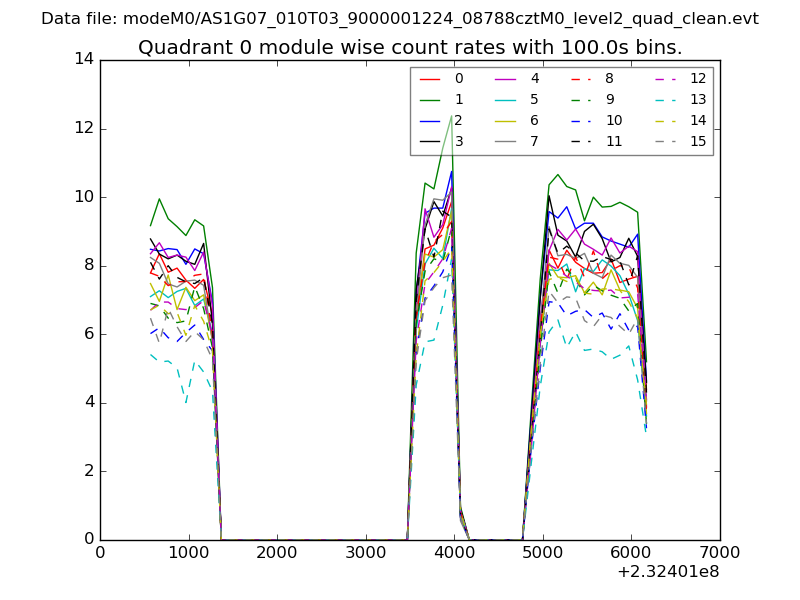
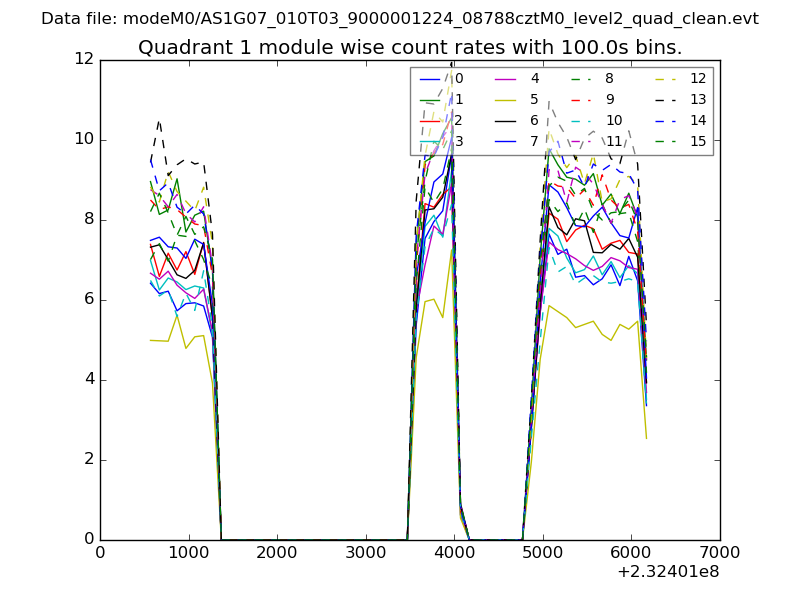
| Module-wise count rates for Quadrant A Data is divided into 100 sec bins |
 |
 |
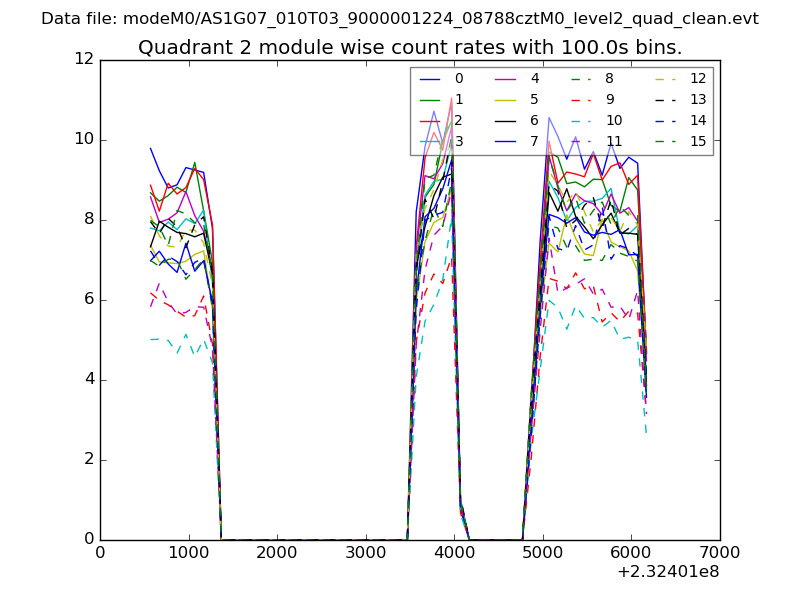
| Module-wise count rates for Quadrant B Data is divided into 100 sec bins |
 |
 |
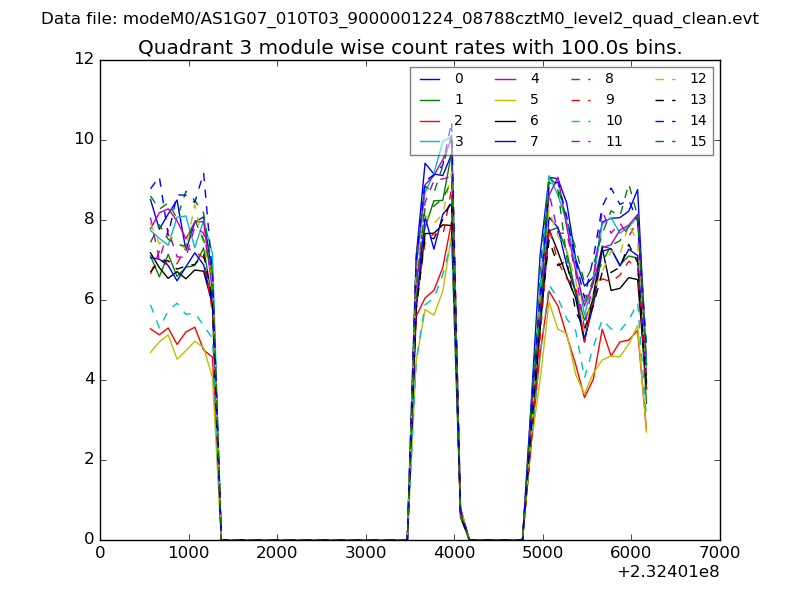
| Module-wise count rates for Quadrant C Data is divided into 100 sec bins |
 |
 |
| Module-wise count rates for Quadrant D Data is divided into 100 sec bins |
 |
 |
| Parameter | Plot |
|---|---|
| CZT HV Monitor | 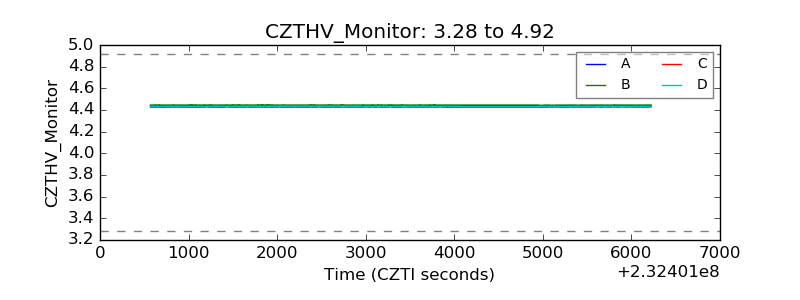 |
| D_VDD | 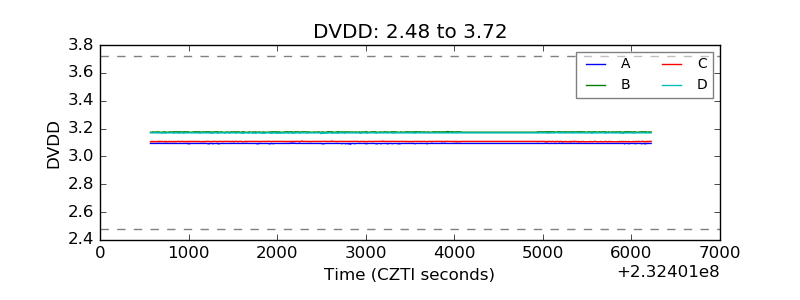 |
| Temperature 1 | 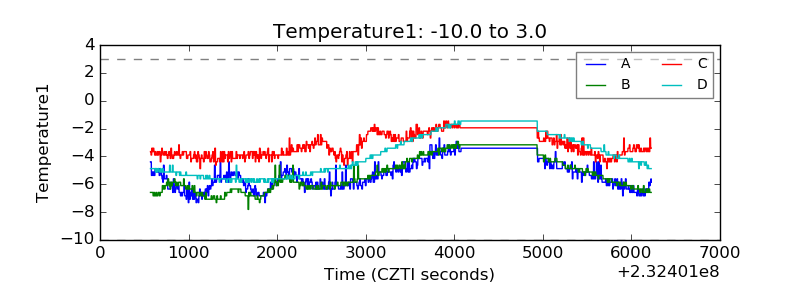 |
| Veto HV Monitor | 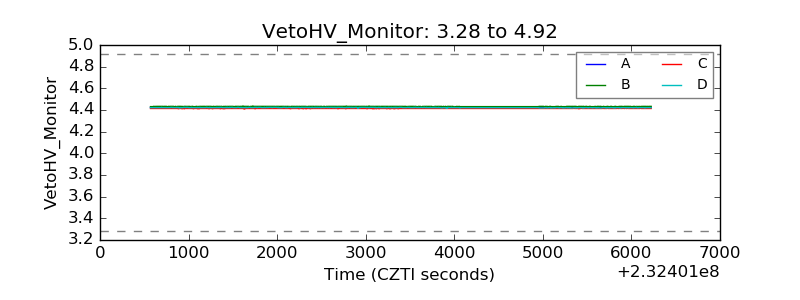 |
| Veto LLD | 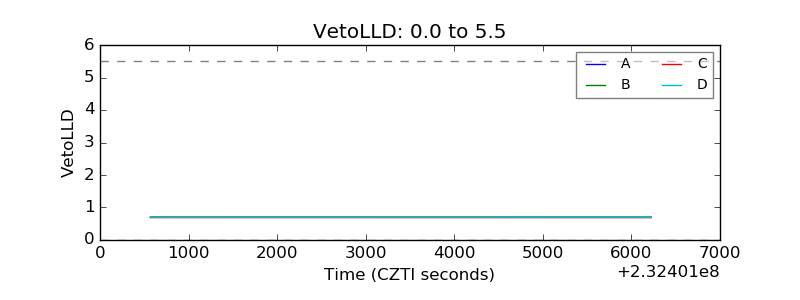 |
| Alpha Counter | 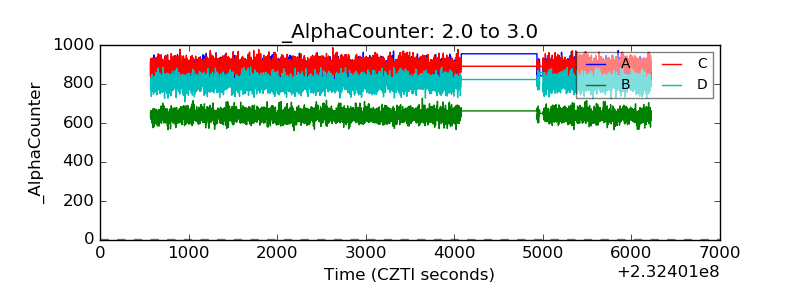 |
| _CPM_Rate | 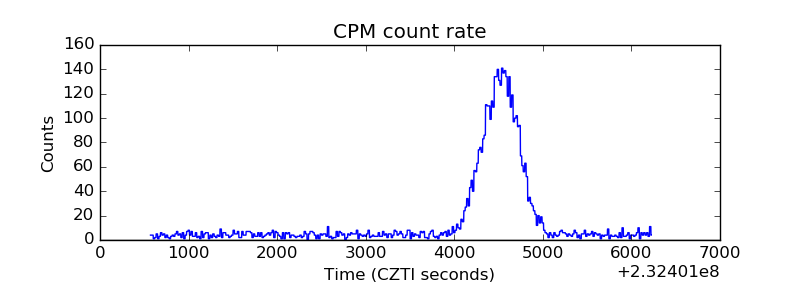 |
| CZT Counter | 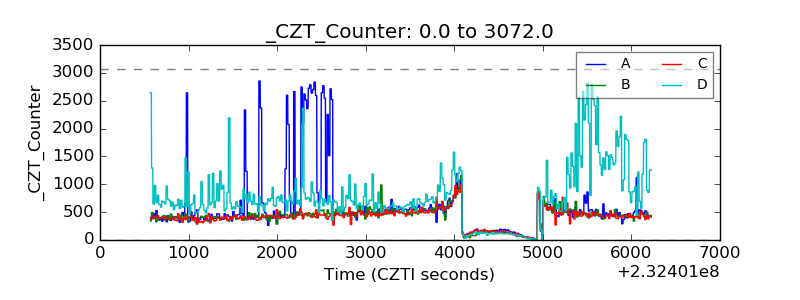 |
| +2.5 Volts monitor |  |
| +5 Volts monitor |  |
| _ROLL_ROT | 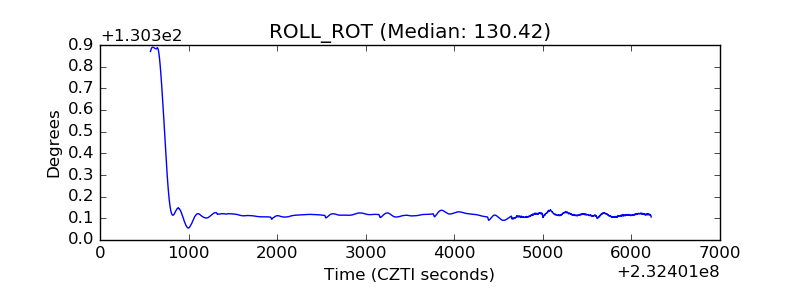 |
| _Roll_DEC | 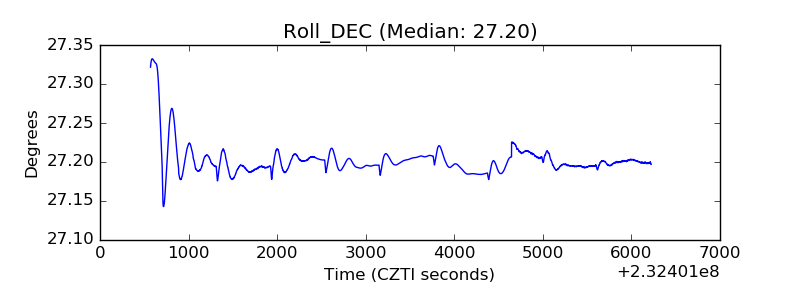 |
| _Roll_RA | 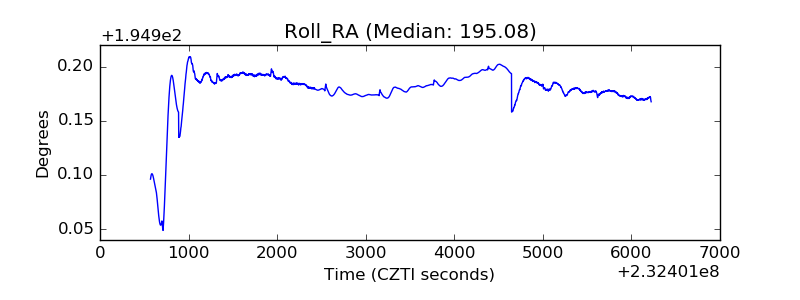 |
| Veto Counter | 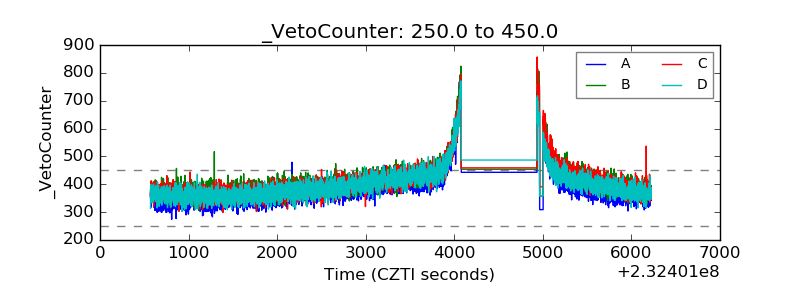 |