| Param | Original file | Final file |
|---|---|---|
| Filename | modeM0/AS1G07_010T03_9000001224_08789cztM0_level2.evt | modeM0/AS1G07_010T03_9000001224_08789cztM0_level2_quad_clean.evt |
| Size (bytes) | 629,015,040 | 98,202,240 |
| Size | 599.9 MB | 93.7 MB |
| Events in quadrant A | 3,627,489 | 632,333 |
| Events in quadrant B | 3,489,092 | 640,481 |
| Events in quadrant C | 3,362,214 | 631,410 |
| Events in quadrant D | 8,076,264 | 560,825 |
| Mode SS | |||
|---|---|---|---|
| Quadrant | BADHDUFLAG | Total packets | Discarded packets |
| A | 0 | 152 | 0 |
| B | 0 | 152 | 0 |
| C | 0 | 152 | 0 |
| D | 0 | 152 | 0 |
| Mode M0 | |||
|---|---|---|---|
| Quadrant | BADHDUFLAG | Total packets | Discarded packets |
| A | 0 | 15662 | 5 |
| B | 0 | 15357 | 4 |
| C | 0 | 15102 | 2 |
| D | 0 | 29308 | 10 |
| Mode M9 | |||
|---|---|---|---|
| Quadrant | BADHDUFLAG | Total packets | Discarded packets |
| A | 0 | 14 | 0 |
| B | 0 | 14 | 0 |
| C | 0 | 14 | 0 |
| D | 0 | 14 | 0 |
| Quadrant | Total seconds | Saturated seconds | Saturation percentage |
|---|---|---|---|
| A | 7306 | 78 | 1.067616% |
| B | 7306 | 70 | 0.958117% |
| C | 7307 | 23 | 0.314767% |
| D | 7305 | 1036 | 14.182067% |
Noise dominated data is calculated using 1-second bins in cleaned event files. If a bin has >2000 counts, and if more than 50% of those come from <1% of pixels, then it is considered to be noise-dominated and hence unusable.
| Quadrant | # 1 sec bins | Bins with >0 counts | Bins with >2000 counts | High rate bins dominated by noise | Noise dominated (total time) | Noise dominated (detector-on time) | Marked lightcurve |
|---|---|---|---|---|---|---|---|
| A | 8652 | 7309 | 7 | 7 | 0.08% | 0.10% |  |
| B | 8652 | 7309 | 3 | 3 | 0.03% | 0.04% |  |
| C | 8652 | 7310 | 0 | 0 | 0.00% | 0.00% | 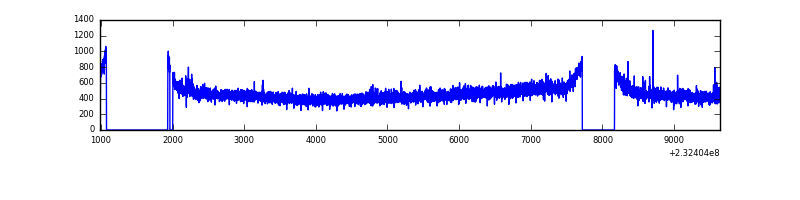 |
| D | 8652 | 7308 | 725 | 725 | 8.38% | 9.92% | 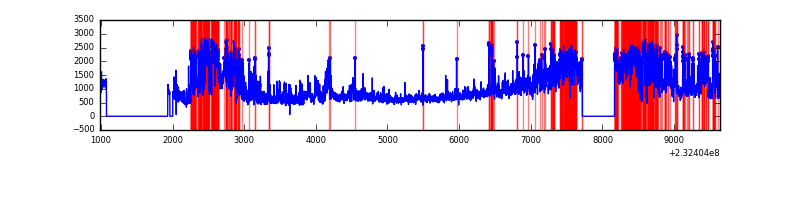 |
Top three noisy pixels from each quadrant. If the there are fewer than three noisy pixels in the level2.evt file, extra rows are filled as -1
| Pixel properties | Quadrant properties | ||||||
|---|---|---|---|---|---|---|---|
| Quadrant | DetID | PixID | Counts | Sigma | Mean | Median | Sigma |
| A | 8 | 5 | 165658 | 922.96 | 870 | 850 | 178.6 |
| A | 15 | 223 | 63544 | 351.1 | 870 | 850 | 178.6 |
| A | 15 | 239 | 19969 | 107.07 | 870 | 850 | 178.6 |
| B | 4 | 173 | 63136 | 370.87 | 871 | 846 | 168.0 |
| B | 5 | 255 | 25514 | 146.87 | 871 | 846 | 168.0 |
| B | 12 | 111 | 18815 | 106.99 | 871 | 846 | 168.0 |
| C | 14 | 67 | 18326 | 87.43 | 851 | 854 | 199.8 |
| C | 9 | 68 | 15853 | 75.05 | 851 | 854 | 199.8 |
| C | 1 | 16 | 8901 | 40.26 | 851 | 854 | 199.8 |
| D | 2 | 16 | 4683626 | 23912.12 | 805 | 786 | 195.8 |
| D | 2 | 152 | 146845 | 745.83 | 805 | 786 | 195.8 |
| D | 1 | 52 | 69193 | 349.31 | 805 | 786 | 195.8 |
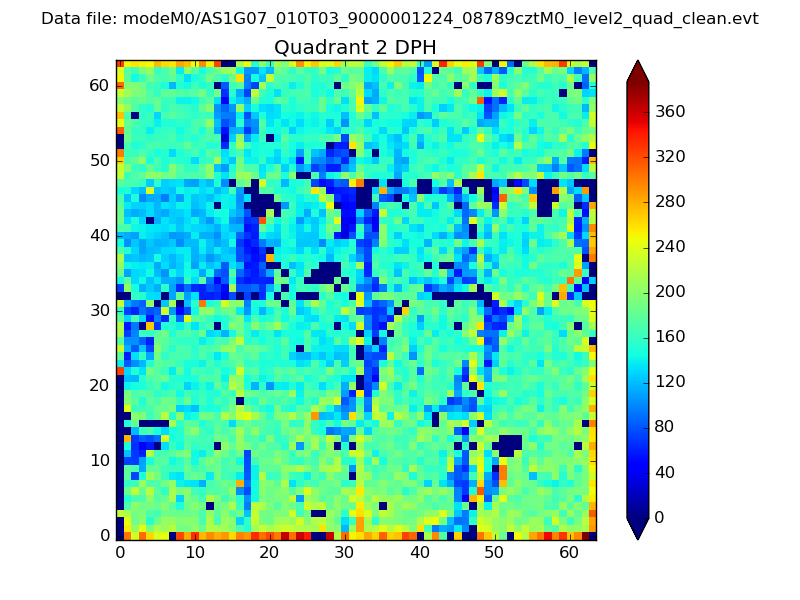
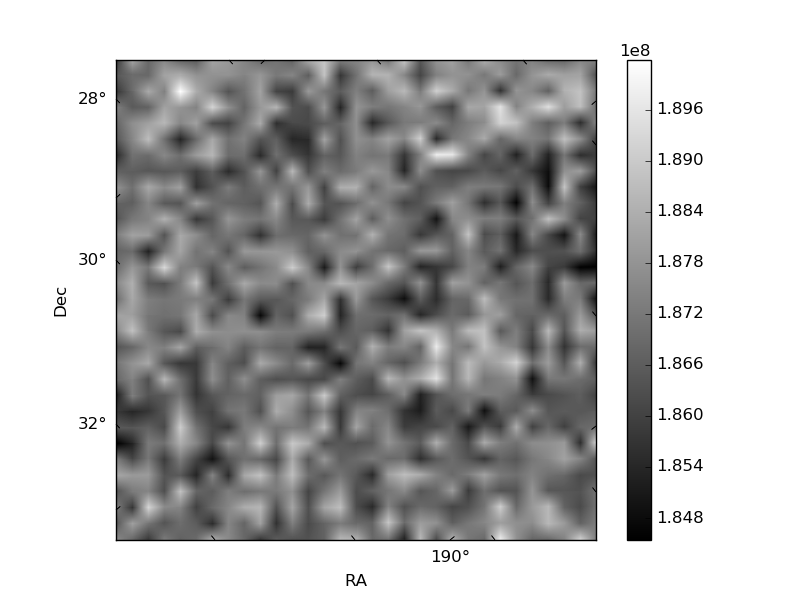
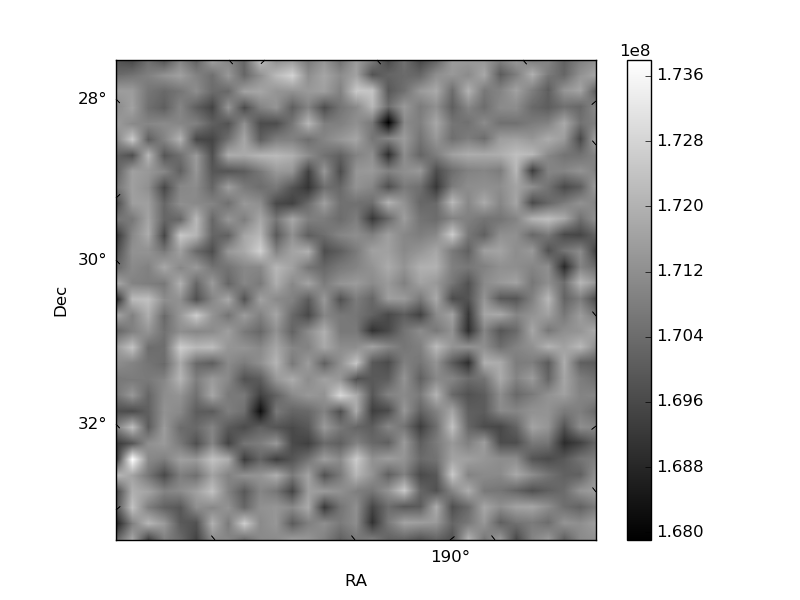
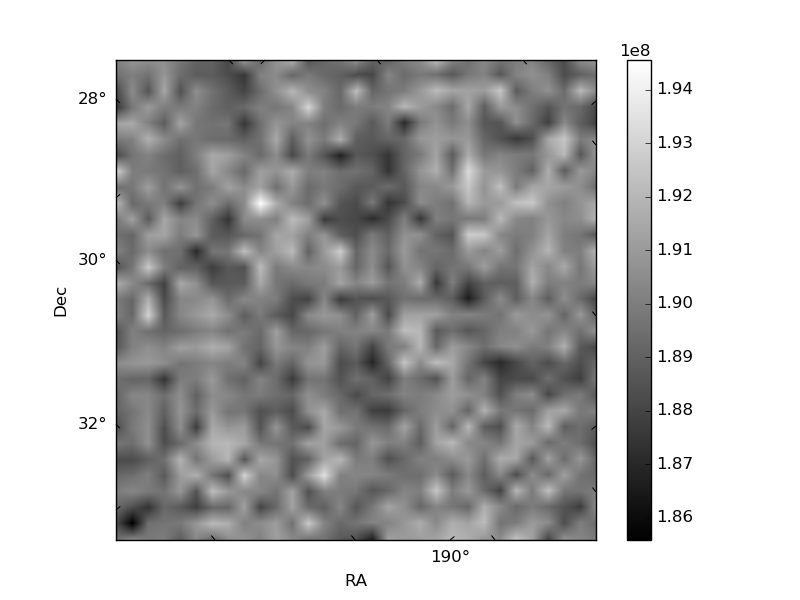
Histogram calculated using DETX and DETY for each event in the final _common_clean file
| Quadrant A | 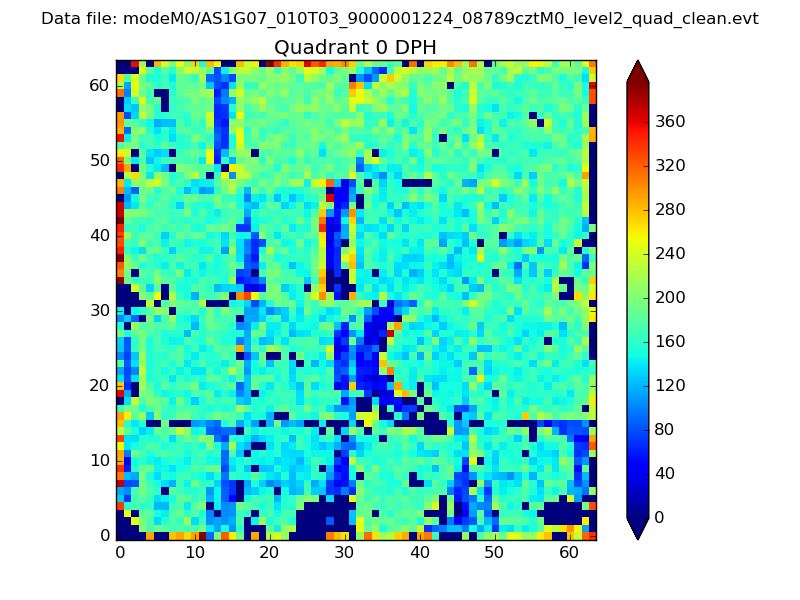 |
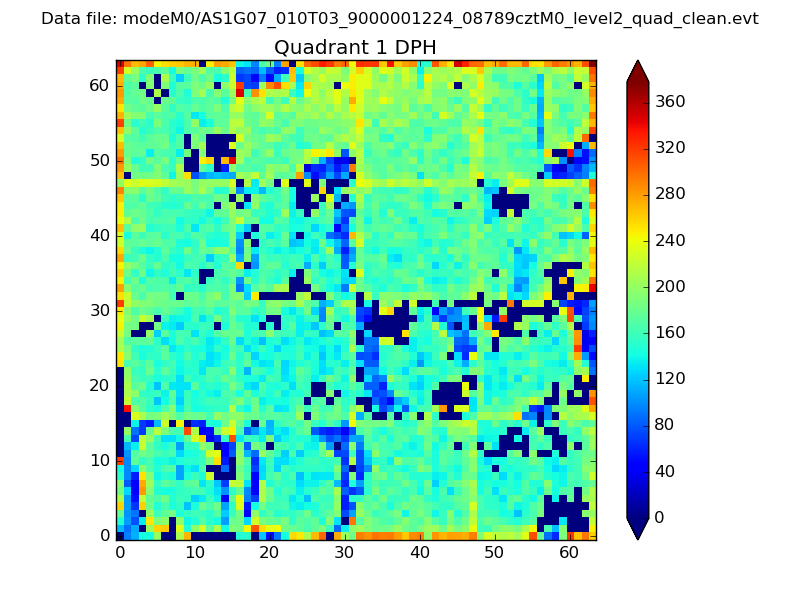 |
Quadrant B |
|---|---|---|---|
| Quadrant D | 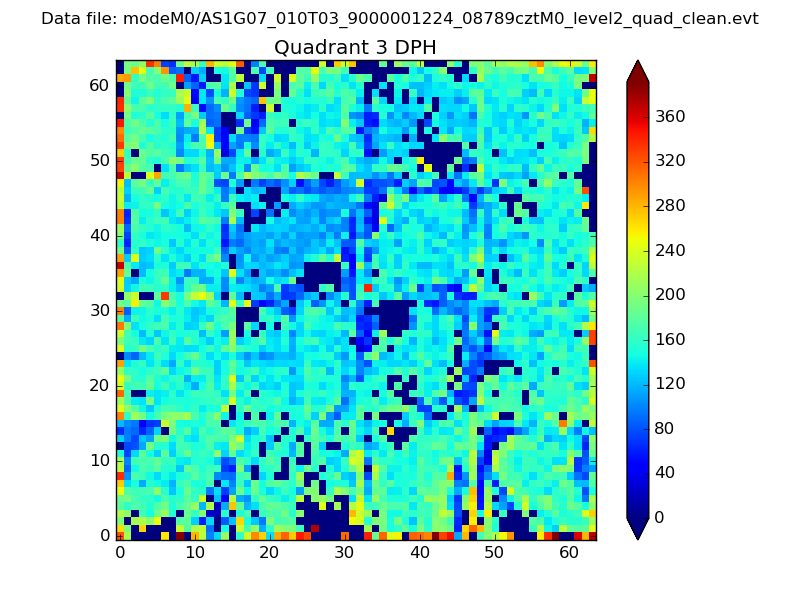 |
 |
Quadrant C |
| Plot type | Count rate plots | Images |
|---|---|---|
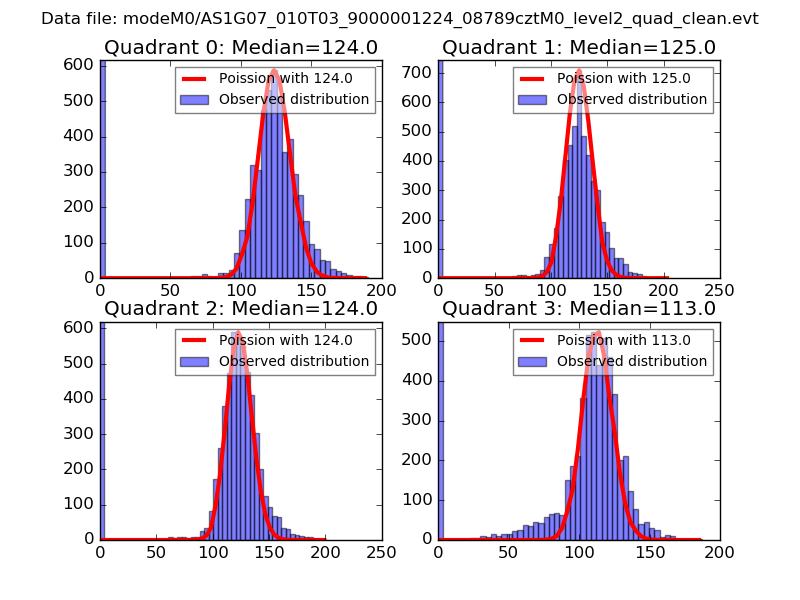
| Comparison with Poisson distribution Blue bars denote a histogram of data divided into 1 sec bins. Red curve is a Poisson curve with rate = median count rate of data. |
 |
 |
| Quadrant-wise count rates Data is divided into 100 sec bins |
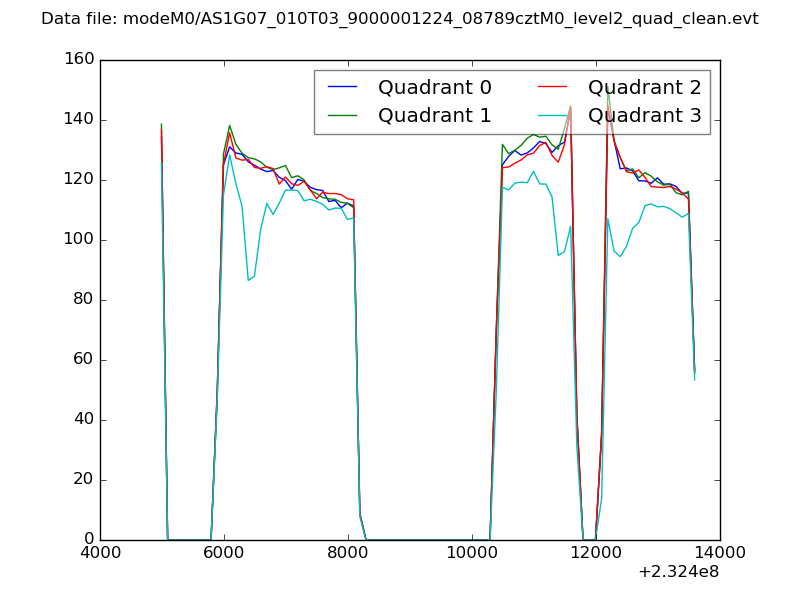 |
|
| Module-wise count rates for Quadrant A Data is divided into 100 sec bins |
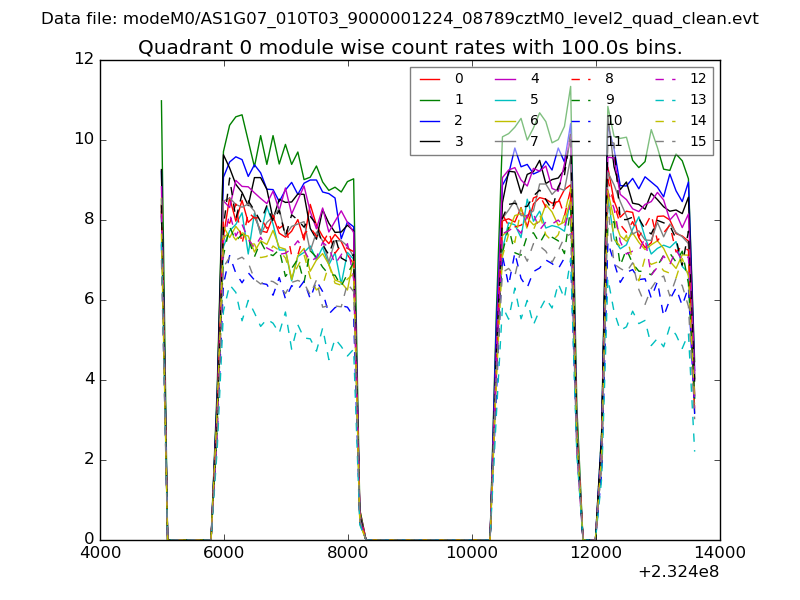 |
 |
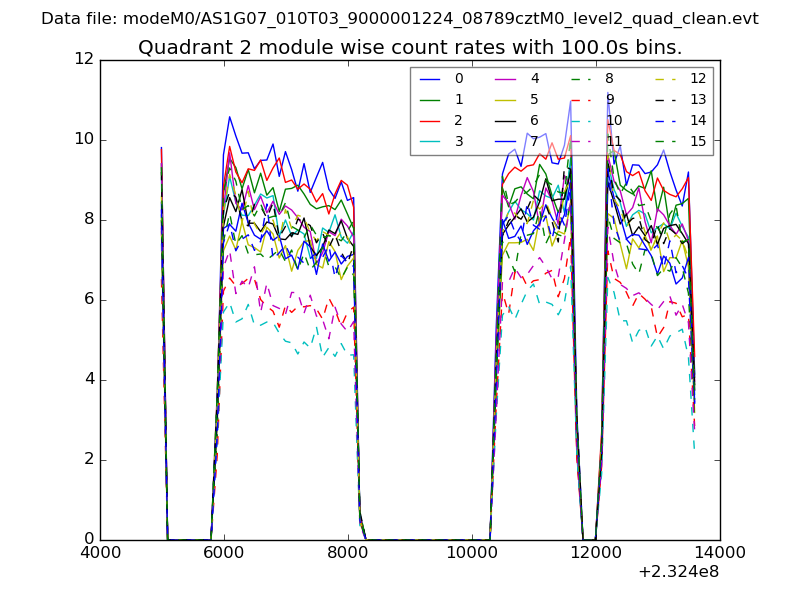
| Module-wise count rates for Quadrant B Data is divided into 100 sec bins |
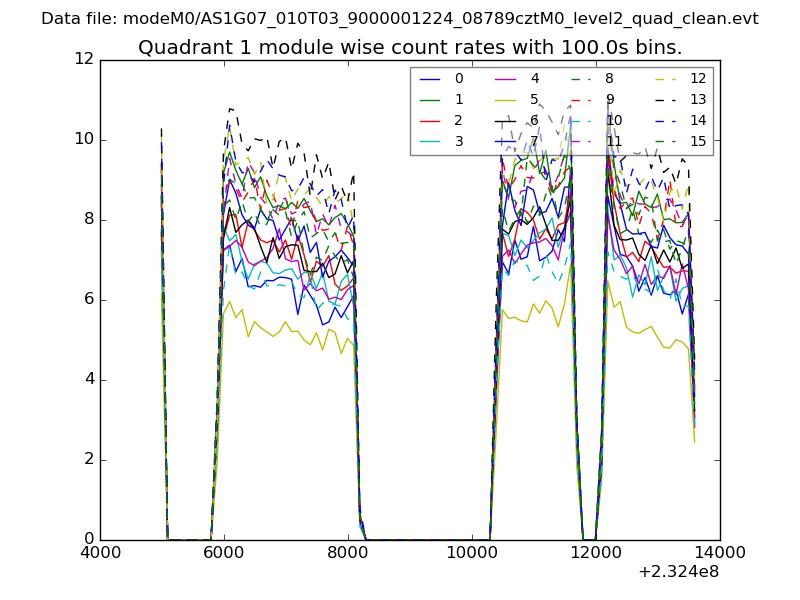 |
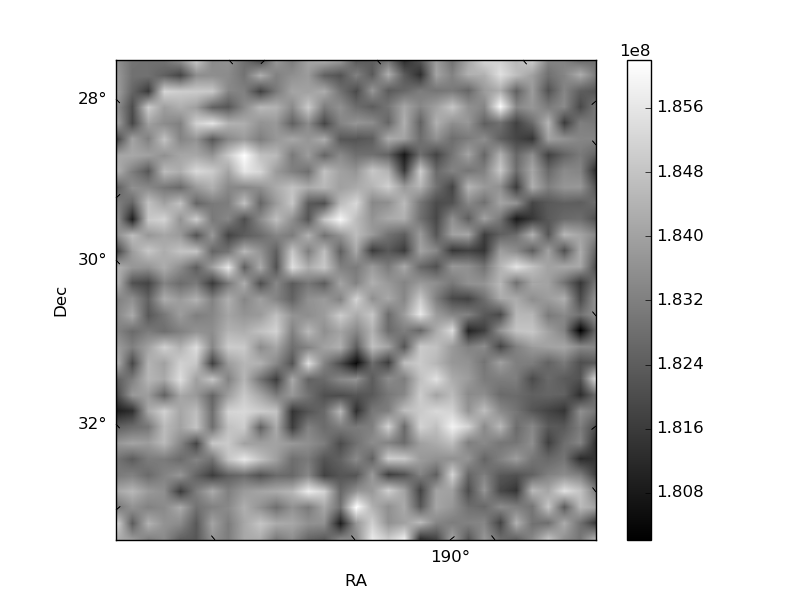 |
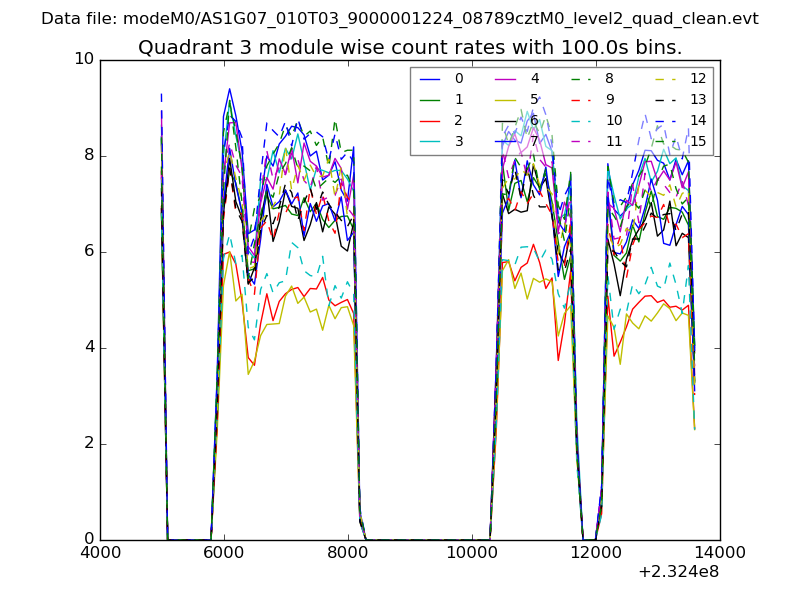
| Module-wise count rates for Quadrant C Data is divided into 100 sec bins |
 |
 |
| Module-wise count rates for Quadrant D Data is divided into 100 sec bins |
 |
 |
| Parameter | Plot |
|---|---|
| CZT HV Monitor | 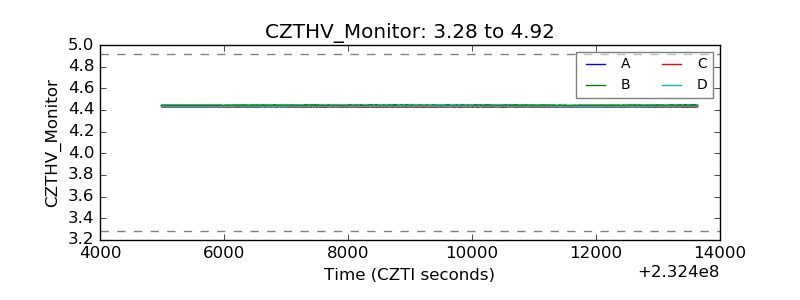 |
| D_VDD | 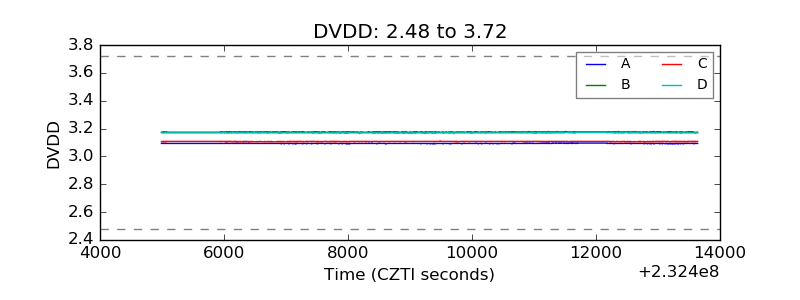 |
| Temperature 1 | 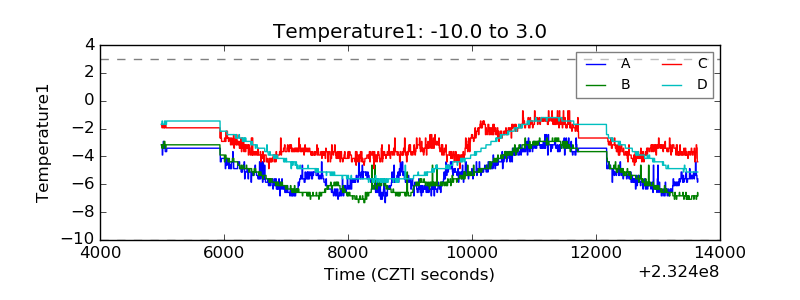 |
| Veto HV Monitor | 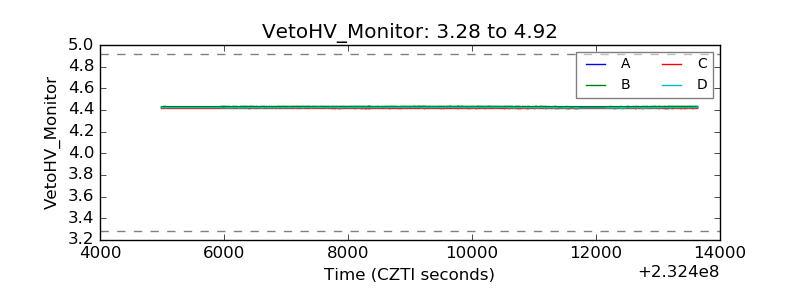 |
| Veto LLD |  |
| Alpha Counter | 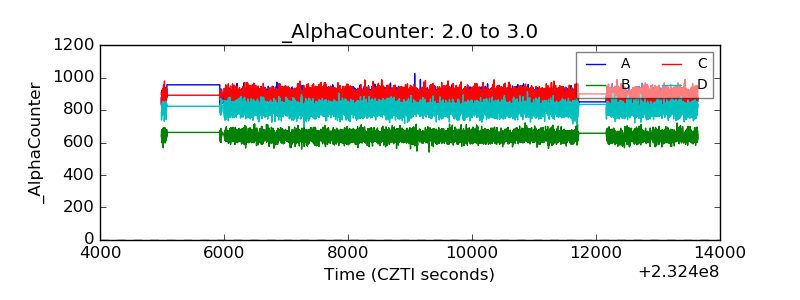 |
| _CPM_Rate | 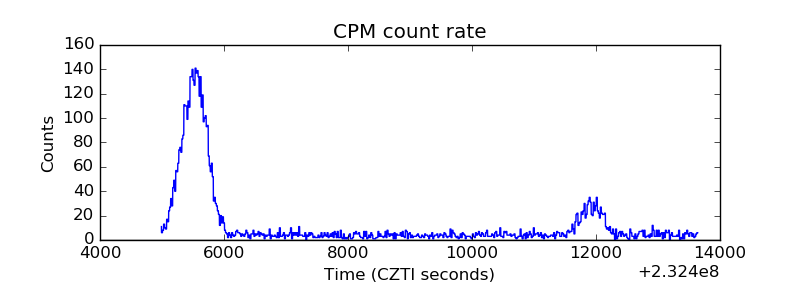 |
| CZT Counter | 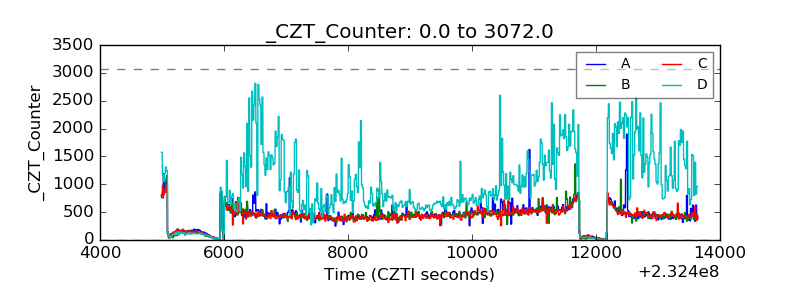 |
| +2.5 Volts monitor |  |
| +5 Volts monitor |  |
| _ROLL_ROT | 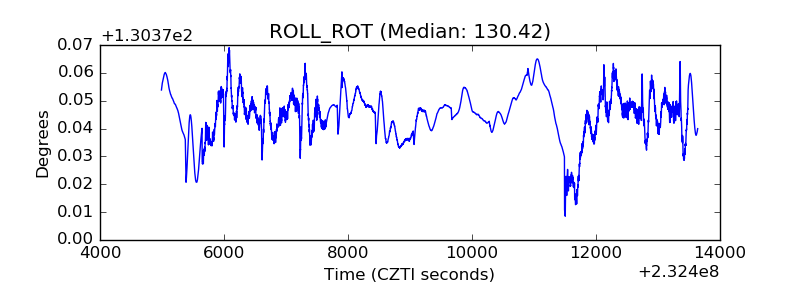 |
| _Roll_DEC | 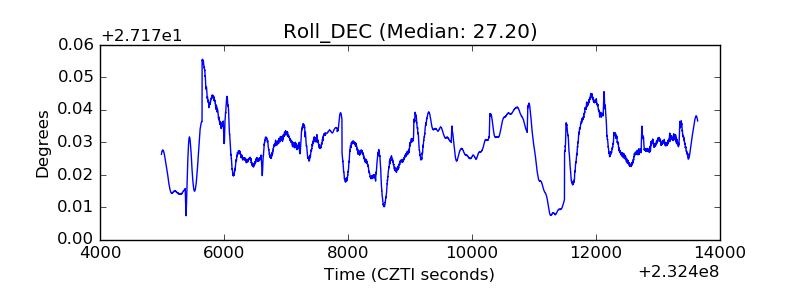 |
| _Roll_RA | 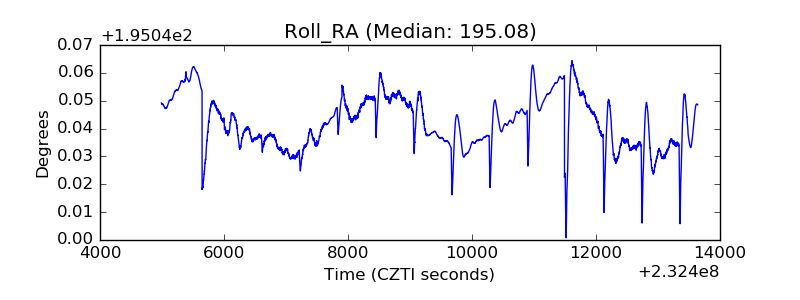 |
| Veto Counter | 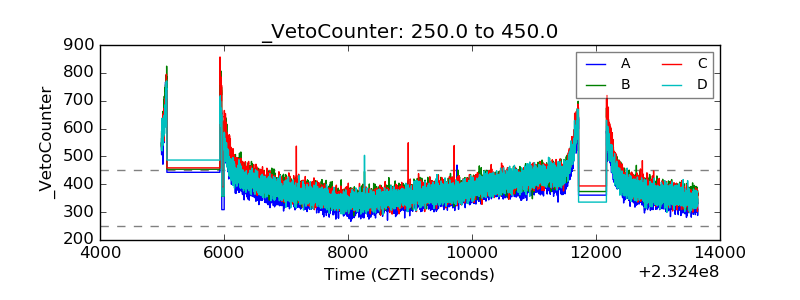 |